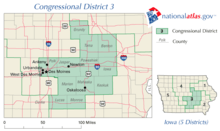
Iowa's 3rd congressional district
Iowa's 3rd congressional district is a congressional district in the U.S. state of Iowa that covers its southwest quadrant, roughly an area including Des Moines to the borders with Nebraska and Missouri.
| Iowa's 3rd congressional district | |||
|---|---|---|---|
.tif.png) Iowa's 3rd congressional district since January 3, 2013 | |||
| Representative |
| ||
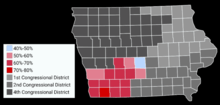
| Distribution |
| ||
| Population (2018 est.) | 843,598 | ||
| Median income | $66,630[1] | ||
| Ethnicity | |||
| Cook PVI | R+1[3] | ||
From 2003 to 2013 it encompassed Des Moines (on the western end) to the western outskirts of the metropolitan area of Cedar Falls and Waterloo (on the northeastern end) to the western outskirts of the Cedar Rapids area (on the eastern end) and to Lucas County and Monroe County (on the southern end).
The district has been represented in the United States House of Representatives by Democrat Cindy Axne since 2019.
Presidential voting since 2000
Election results from presidential races:
| Year | Office | Results |
|---|---|---|
| 2000 | President | Gore 49% – Bush 48% |
| 2004 | President | Bush 50% – Kerry 50% |
| 2008 | President | Obama 54% – McCain 44% |
| 2012 | President | Obama 51% – Romney 47% |
| 2016 | President | Trump 48% – Clinton 45% |
List of members representing the district
| Representative | Party | Years | Congress | Electoral history |
|---|---|---|---|---|
| District created | March 4, 1863 | |||
 William B. Allison |
Republican | March 4, 1863 – March 3, 1871 |
38th 39th 40th 41st |
[data unknown/missing] |
 William G. Donnan |
Republican | March 4, 1871 – March 3, 1875 |
42nd 43rd |
[data unknown/missing] |
 Lucien L. Ainsworth |
Democratic | March 4, 1875 – March 3, 1877 |
44th | [data unknown/missing] |
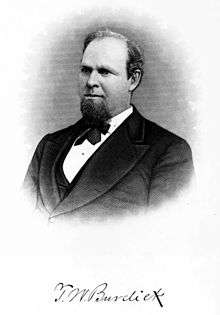 Theodore W. Burdick |
Republican | March 4, 1877 – March 3, 1879 |
45th | [data unknown/missing] |
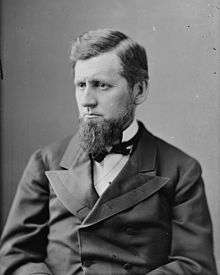
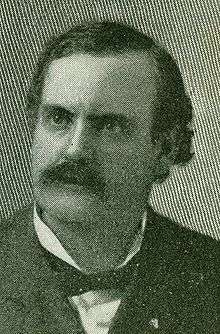
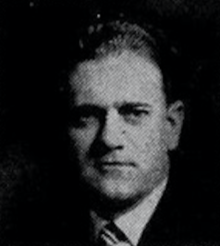
.jpg) Thomas Updegraff |
Republican | March 4, 1879 – March 3, 1883 |
46th 47th |
[data unknown/missing] |
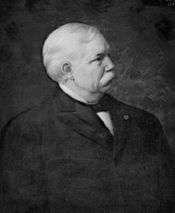 David B. Henderson |
Republican | March 4, 1883 – March 3, 1903 |
48th 49th 50th 51st 52nd 53rd 54th 55th 56th 57th |
[data unknown/missing] |
 Benjamin P. Birdsall |
Republican | March 4, 1903 – March 3, 1909 |
58th 59th 60th |
[data unknown/missing] |
| Charles E. Pickett | Republican | March 4, 1909 – March 3, 1913 |
61st 62nd |
[data unknown/missing] |
| Maurice Connolly | Democratic | March 4, 1913 – March 3, 1915 |
63rd | [data unknown/missing] |
 Burton E. Sweet |
Republican | March 4, 1915 – March 3, 1923 |
64th 65th 66th 67th |
[data unknown/missing] |
 Thomas J. B. Robinson |
Republican | March 4, 1923 – March 3, 1933 |
68th 69th 70th 71st 72nd |
[data unknown/missing] |
| Albert C. Willford | Democratic | March 4, 1933 – January 3, 1935 |
73rd | [data unknown/missing] |
 John W. Gwynne |
Republican | January 3, 1935 – January 3, 1949 |
74th 75th 76th 77th 78th 79th 80th |
[data unknown/missing] |
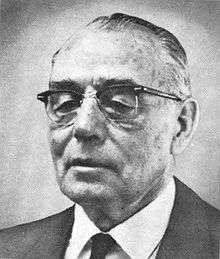 Harold R. Gross |
Republican | January 3, 1949 – January 3, 1975 |
81st 82nd 83rd 84th 85th 86th 87th 88th 89th 90th 91st 92nd 93rd |
[data unknown/missing] |
 Chuck Grassley |
Republican | January 3, 1975 – January 3, 1981 |
94th 95th 96th |
[data unknown/missing] |
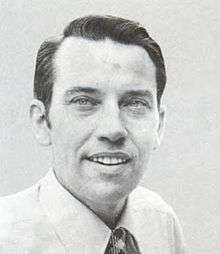
 T. Cooper Evans |
Republican | January 3, 1981 – January 3, 1987 |
97th 98th 99th |
[data unknown/missing] |
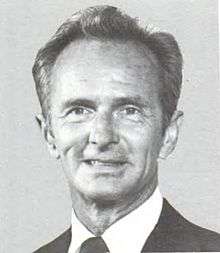
 David R. Nagle |
Democratic | January 3, 1987 – January 3, 1993 |
100th 101st 102nd |
[data unknown/missing] |
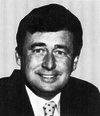
 Jim R. Lightfoot |
Republican | January 3, 1993 – January 3, 1997 |
103rd 104th |
Redistricted from the 5th district. |
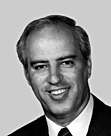
 Leonard Boswell |
Democratic | January 3, 1997 – January 3, 2013 |
105th 106th 107th 108th 109th 110th 111th 112th |
[data unknown/missing] |
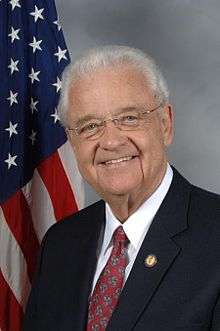
 Tom Latham |
Republican | January 3, 2013 – January 3, 2015 |
113th | Redistricted from the 4th district. |
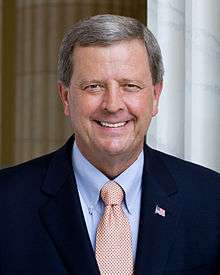
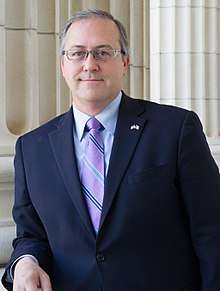 David Young |
Republican | January 3, 2015 – January 3, 2019 |
114th 115th |
Lost re-election. |
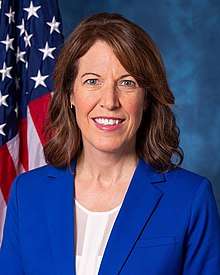 Cindy Axne |
Democratic | January 3, 2019 - Present |
116th | Elected in 2018. |
Recent election results
| Year[4] | Party affiliation | Winner | Number of votes | Party affiliation | Loser | Number of votes | Percentage of votes |
|---|---|---|---|---|---|---|---|
| 1920 | Republican | Burton E. Sweet | 67,859 | Farmer-Labor | Roy Jacobs | 1,974 | 97% – 3% |
| 1922 | Republican | Thomas J. B. Robinson | 34,518 | Democrat | Fred P. Hageman | 24,304 | 58% – 41% |
| 1924 | Republican | Thomas J. B. Robinson | 54,921 | Democrat | Willis N. Birdsall | 25,215 | 69% – 31% |
| 1926 | Republican | Thomas J. B. Robinson | 32,180 | Democrat | Ellis E. Wilson | 13,696 | 70% – 30% |
| 1928 | Republican | Thomas J. B. Robinson | 60,025 | Democrat | Leo. F. Tierney | 38,469 | 61% – 39% |
| 1930 | Republican | Thomas J. B. Robinson | 27,098 | Democrat | W. L. Beecher | 15,908 | 63% – 37% |
| 1932 | Democrat | Albert C. Willford | 48,939 | Republican | Thomas J. B. Robinson | 47,776 | 51% – 49% |
| 1934 | Republican | John W. Gwynne | 42,063 | Democrat | Albert C. Willford | 35,159 | 51% – 43% |
| 1936 | Republican | John W. Gwynne | 53,928 | Democrat | Albert C. Willford | 47,391 | 52% – 46% |
| 1938 | Republican | John W. Gwynne | 45,541 | Democrat | W. F. Hayes | 30,158 | 60% – 40% |
| 1940 | Republican | John W. Gwynne | 65,425 | Democrat | Ernest J. Seemann | 43,709 | 60% – 40% |
| 1942 | Republican | John W. Gwynne | 54,124 | Democrat | William D. Kearney | 35,065 | 61% – 39% |
| 1944 | Republican | John W. Gwynne | 74,901 | Democrat | William D. Kearney | 56,985 | 58% – 42% |
| 1946 | Republican | John W. Gwynne | 48,346 | Democrat | Dan J. P. Ryan | 29,661 | 62% – 38% |
| 1948 | Republican | H. R. Gross | 78,838 | Democrat | Dan J. P. Ryan | 56,002 | 58% – 41% |
| 1950 | Republican | H. R. Gross | 73,490 | Democrat | James O. Babcock | 40,786 | 64% – 36% |
| 1952 | Republican | H. R. Gross | 109,992 | Democrat | George R. Laub | 56,871 | 66% – 34% |
| 1954 | Republican | H. R. Gross | 68,307 | Democrat | George R. Laub | 41,622 | 62% – 38% |
| 1956 | Republican | H. R. Gross | 97,590 | Democrat | Michael Micich | 69,076 | 59% – 41% |
| 1958 | Republican | H. R. Gross | 61,920 | Democrat | Michael Micich | 53,467 | 54% – 46% |
| 1960 | Republican | H. R. Gross | 99,046 | Democrat | Edward J. Gallagher, Jr. | 76,837 | 56% – 44% |
| 1962 | Republican | H. R. Gross | 66,337 | Democrat | Neel F. Hill | 50,580 | 57% – 43% |
| 1964 | Republican | H. R. Gross | 83,455 | Democrat | Stephen M. Peterson | 83,036 | 50.1% – 49.9% |
| 1966 | Republican | H. R. Gross | 79,343 | Democrat | L. A. Pat Touchae | 48,530 | 62% – 38% |
| 1968 | Republican | H. R. Gross | 101,839 | Democrat | John E. Van Eschen | 57,164 | 64% – 36% |
| 1970 | Republican | H. R. Gross | 66,087 | Democrat | Lyle D. Taylor | 45,958 | 59% – 41% |
| 1972 | Republican | H. R. Gross | 109,113 | Democrat | Lyle D. Taylor | 86,848 | 56% – 44% |
| 1974 | Republican | Charles E. Grassley | 77,468 | Democrat | Stephen J. Rapp | 74,859 | 51% – 49% |
| 1976 | Republican | Charles E. Grassley | 117,957 | Democrat | Stephen J. Rapp | 90,981 | 56% – 44% |
| 1978 | Republican | Charles E. Grassley | 103,659 | Democrat | John Knudson | 34,880 | 75% – 25% |
| 1980 | Republican | Cooper Evans | 107,869 | Democrat | Lynn G. Cutler | 101,735 | 51% – 48% |
| 1982 | Republican | Cooper Evans | 104,072 | Democrat | Lynn G. Cutler | 83,581 | 55% – 45% |
| 1984 | Republican | Cooper Evans | 133,737 | Democrat | Joe Johnston | 86,574 | 61% – 39% |
| 1986 | Democrat | David R. Nagle | 83,504 | Republican | John McIntee | 69,386 | 55% – 45% |
| 1988 | Democrat | David R. Nagle | 129,204 | Republican | Donald B. Redfern | 74,682 | 63% – 37% |
| 1990 | Democrat | David R. Nagle | 100,947 | N/A | No Opponent | 833 | 99% – 1% |
| 1992 | Republican | Jim Ross Lightfoot | 125,931 | Democrat | Elaine Baxter | 121,063 | 49% – 47% |
| 1994 | Republican | Jim Ross Lightfoot | 111,862 | Democrat | Elaine Baxter | 79,310 | 58% – 41% |
| 1996 | Democrat | Leonard L. Boswell | 115,914 | Republican | Mike Mahaffey | 111,895 | 49% – 48% |
| 1998 | Democrat | Leonard L. Boswell | 107,947 | Republican | Larry McKibben | 78,063 | 57% – 41% |
| 2000 | Democrat | Leonard L. Boswell | 156,327 | Republican | Jay Marcus | 83,810 | 63% – 34% |
| 2002 | Democrat | Leonard L. Boswell | 115,367 | Republican | Stan Thompson | 97,285 | 53% – 45% |
| 2004 | Democrat | Leonard L. Boswell | 168,007 | Republican | Stan Thompson | 136,099 | 55% – 45% |
| 2006 | Democrat | Leonard L. Boswell | 114,689 | Republican | Jeff Lamberti | 103,182 | 52% – 47% |
| 2008 | Democrat | Leonard L. Boswell | 175,423 | Republican | Kim Schmett | 131,524 | 56% – 42% |
| 2010 | Democrat | Leonard L. Boswell | 122,147 | Republican | Brad Zaun | 111,925 | 50% – 46% |
| 2012 | Republican | Tom Latham | 202,000 | Democrat | Leonard L. Boswell | 168,632 | 51% – 42% |
| 2014 | Republican | David Young | 148,814 | Democrat | Staci Appel | 119,109 | 52% – 42% |
| 2016 | Republican | David Young | 208,598 | Democrat | Jim Mowrer | 155,002 | 53% – 40% |
| 2018 | Democrat | Cindy Axne | 169,888 | Republican | David Young | 164,667 | 49% – 47% |
2002
| Party | Candidate | Votes | % | |
|---|---|---|---|---|
| Democratic | Leonard Boswell* | 115,367 | 53.41 | |
| Republican | Stan Thompson | 97,285 | 45.04 | |
| Libertarian | Jeffrey J. Smith | 2,689 | 1.25 | |
| Socialist Workers | Edwin B. Fruit | 569 | 0.26 | |
| No party | Others | 75 | 0.04 | |
| Total votes | 215,985 | 100.00 | ||
| Turnout | ||||
| Democratic hold | ||||
2004
| Party | Candidate | Votes | % | |
|---|---|---|---|---|
| Democratic | Leonard Boswell* | 168,007 | 55.21 | |
| Republican | Stan Thompson | 136,009 | 44.72 | |
| No party | Others | 213 | 0.07 | |
| Total votes | 304,229 | 100.00 | ||
| Turnout | ||||
| Democratic hold | ||||
2006
| Party | Candidate | Votes | % | |
|---|---|---|---|---|
| Democratic | Leonard Boswell* | 115,769 | 51.85 | |
| Republican | Jeff Lamberti | 103,722 | 46.45 | |
| Socialist Workers | Helen Meyers | 3,591 | 1.61 | |
| No party | Others | 205 | 0.09 | |
| Total votes | 223,287 | 100.00 | ||
| Turnout | ||||
| Democratic hold | ||||
2008
| Party | Candidate | Votes | % | |
|---|---|---|---|---|
| Democratic | Leonard Boswell* | 176,904 | 56.31 | |
| Republican | Kim Schmett | 132,136 | 42.06 | |
| Socialist Workers | Frank Forrestal | 4,599 | 1.46 | |
| No party | Others | 521 | 0.17 | |
| Total votes | 314,160 | 100.00 | ||
| Turnout | ||||
| Democratic hold | ||||
2010
| Party | Candidate | Votes | % | |
|---|---|---|---|---|
| Democratic | Leonard Boswell* | 122,147 | 50.73 | |
| Republican | Brad Zaun | 111,925 | 46.49 | |
| Socialist Workers | Rebecca Williamson | 6,258 | 2.60 | |
| No party | Others | 426 | 0.18 | |
| Total votes | 240,756 | 100.00 | ||
| Turnout | ||||
| Democratic hold | ||||
2012
| Party | Candidate | Votes | % | |||
|---|---|---|---|---|---|---|
| Republican | Tom Latham* | 202,000 | 50.56 | |||
| Democratic | Leonard Boswell* | 168,632 | 42.20 | |||
| Independent | Scott G. Batcher | 9,352 | 2.34 | |||
| Socialist Workers | David Rosenfeld | 6,286 | 1.57 | |||
| No party | Others | 572 | 0.14 | |||
| Total votes | 399,561 | 100.00 | ||||
| Turnout | ||||||
| Republican gain from Democratic | ||||||
2014
| Party | Candidate | Votes | % | |
|---|---|---|---|---|
| Republican | David Young | 148,814 | 52.8 | |
| Democratic | Staci Appel | 119,109 | 42.2 | |
| Libertarian | Edward Wright | 9,054 | 3.2 | |
| No party preference | Bryan Jack Holder | 4,360 | 1.5 | |
| Write-ins | 729 | 0.3 | ||
| Total votes | 282,066 | 100 | ||
| Republican hold | ||||
2016
Map showing the results of the 2016 election in Iowa's 3rd congressional district by county
| Party | Candidate | Votes | % | |
|---|---|---|---|---|
| Republican | David Young* | 208,598 | 53.45 | |
| Democratic | Jim Mowrer | 155,002 | 39.71 | |
| Libertarian | Bryan Jack Holder | 15,372 | 3.94 | |
| Nominated by Petition | Claudia Addy | 6,348 | 1.63 | |
| Nominated by Petition | Joe Grandanette | 4,518 | 1.16 | |
| Write-ins | 449 | 0.12 | ||
| Total votes | 390,287 | 100.00 | ||
| Republican hold | ||||
2018
| Party | Candidate | Votes | % | ± | |
|---|---|---|---|---|---|
| Democratic | Cindy Axne | 169,888 | 49.0 | +9.29 | |
| Republican | David Young* | 164,667 | 47.49 | -5.96 | |
| Libertarian | Bryan Jack Holder | 7,005 | 2.02 | -1.92 | |
| Legal Marijuana Now | Mark Elworth Jr. | 1,906 | 0.55 | +0.55 | |
| Green | Paul Knupp | 1,795 | 0.52 | +0.52 | |
| Independent | Joe Grandanette | 1,271 | 0.37 | -0.79 | |
| Write-ins | 178 | 0.05 | +0.00 | ||
| Plurality | 5,221 | 1.51 | |||
| Turnout | 346,710 | 100 | |||
| Democratic gain from Republican | Swing | +15.25 | |||
Historical district boundaries
2003–2013
gollark: I kind of wanted one so I could make an entirely pointless point about optical drives, but they don't seem to be readily available.
gollark: One from, what, 7-8 years ago, clearly.
gollark: Like I said, ancient.
gollark: Yes, I saw.
gollark: It's from "Wolfdale", which I think is roughly the last core 2 duos.
References
- https://www.census.gov/mycd/?st=19&cd=03
- https://censusreporter.org/profiles/50000US1903-congressional-district-3-ia/
- "Partisan Voting Index – Districts of the 115th Congress" (PDF). The Cook Political Report. April 7, 2017. Retrieved April 7, 2017.
- "Election Statistics,". 2005. Archived from the original on 2007-07-25.
- "Iowa General Election 2018". Iowa Secretary of State. Retrieved November 11, 2018.
- Martis, Kenneth C. (1989). The Historical Atlas of Political Parties in the United States Congress. New York: Macmillan Publishing Company.
- Martis, Kenneth C. (1982). The Historical Atlas of United States Congressional Districts. New York: Macmillan Publishing Company.
- Congressional Biographical Directory of the United States 1774–present
| U.S. House of Representatives | ||
|---|---|---|
| Preceded by Maine's 1st congressional district |
Home district of the Speaker of the House December 4, 1899 – March 4, 1903 |
Succeeded by Illinois's 18th congressional district |
This article is issued from Wikipedia. The text is licensed under Creative Commons - Attribution - Sharealike. Additional terms may apply for the media files.