Google Public Data Explorer
Google Public Data Explorer provides public data and forecasts from a range of international organizations and academic institutions including the World Bank, OECD, Eurostat and the University of Denver.[2][3] These can be displayed as line graphs, bar graphs, cross sectional plots or on maps.[4] The product was launched on March 8, 2010 as an experimental visualization tool in Google Labs.[5]
 | |
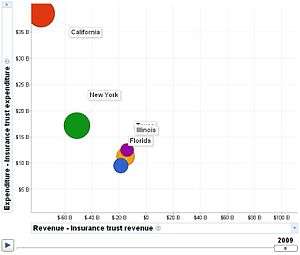
 Example of an animated bubble plot.[1] | |
| Developer(s) | Google Inc. |
|---|---|
| Initial release | 8 March 2010 |
| Platform | Web platform |
| Available in | 40 languages |
| Type | Collaborative software, Data visualization |
| Website | www |
In 2011 the Public Data Explorer was made available for anyone to upload, share and visualize data sets. To facilitate this, Google created a new data format, the Dataset Publishing Language (DSPL). Once the data is imported, a dataset can be visualized, embedded in external websites, and shared with others like a Google Doc.[6]
In 2016, this toolset was enhanced with the Google Analytics Suite, particularly Data Studio 360, whose release expanded to a free public beta in May 2016, which enabled import of public or individual datasets and overlaid user-friendly (non-coding) data visualization tools.
SDMX conversion
The SDMX converter is an open source application, which offers the ability to convert DSPL (Google's Dataset Publishing Language) messages to SDMX-ML and backwards. The output file of a DSPL dataset is a zip file containing data (CSV files) and metadata (XML file). Datasets in this format can be processed by Google and visualized in the Google Public Data Explorer.[7]
See also
References
- Edwards, Kerstin. "Visualizing Data from Government Census and Surveys: Plans for the Future" (PDF). U.S. Census Bureau. Retrieved 20 January 2015.
- "Pardee Center for International Futures Data Explorer". University of Denver. Retrieved 18 January 2015.
- "Data Providers". Retrieved 18 January 2015.
- "Visualize the data in a dataset". Google Inc. Retrieved 18 January 2015.
- "Statistics for a changing world: Google Public Data Explorer in Labs". Retrieved 20 January 2015.
- Sherman, Chris. "Visualize Your Own Information With Google Public Data Explorer". Search Engine Land. Retrieved 19 January 2015.
- "SDMX Converter". European Commission. Archived from the original on 30 October 2015. Retrieved 25 January 2015.
Further reading
- Eurostat data as open data: experience with Google and with the open data community by Chris Laevaert, May 2012
- Enhancing Data Discovery and Exploration by Jürgen Schwärzler, March 2011
- Using the Google Public Data Explorer as a Learning Tool in the University Geography Classroom by Thomas Pingel and Devin Moeller, October 2014
External links
- Official website
- International Telecommunication Union Data Explorer
- United Nations Human Development Reports