Gale of January 1976
The Gale of January 1976, widely known as the "Capella" storm in Germany and the Ruisbroek flood in Belgium, was one in a series of extratropical cyclones and storm surges, which occurred over January 1976. The gale of 2–5 January resulted in severe wind damage across western and central Europe and coastal flooding around the southern North Sea coasts. At the time, this was the most severe storm of the century to date over the British Isles.[6] Total fatalities reached 82 across Europe, although a figure of 100 is given by the World Meteorological Organization.[4] Of these 24 were reported in Britain and 4 in Ireland.[7] Overall losses of US$1.3 billion were incurred, with insured losses standing at US$500 million (1976).[3]
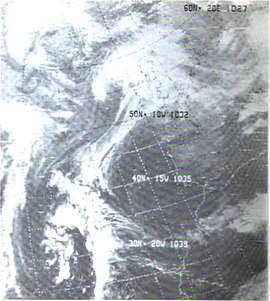 Capella storm January 1976 approaching Ireland | |
| Type | European windstorm, extratropical, extratropical storm surge |
|---|---|
| Formed | 1 January 1976 |
| Dissipated | 5 January 1976 |
| Lowest pressure | 962 hPa (28.4 inHg)[1] |
| Highest gust | 116 kn (215 km/h; 133 mph) Lowther Hills, Strathclyde Scotland[2] |
| Casualties | 82[3]-100[4] |
| Areas affected | Ireland, United Kingdom, Belgium, France, Denmark, West Germany, East Germany, Netherlands, Switzerland, Austria, Italy, Poland, Czechoslovakia, Hungary and Yugoslavia |
| Surgewatch.org UK coastal flooding severity, Medium 3/6[5] | |
Meteorological history
December 1975 saw a deep low persisting over the northern Barents Sea with a high north of the Azores and west of Biscay, which enhanced a strong westerly flow over northern Europe.[8] This anomalously strong westerly flow over the North Atlantic[9] saw a low pressure maintained in the central Atlantic in association with an almost stationary upper trough. During the afternoon of 1 January, a depression broke away from this central Atlantic low[1] from the SW of the Azores in a frontal wave, transporting a mass of warm and moist air[6] and moved quickly northeast, to be centred 150 kilometres (90 mi) north-west of Malin Head Ireland, by midday on 2 January.[1] On its journey, the system rapidly deepened,[10] powered by an in-draught of cold air from the north which supplied temperature contrast powering explosive development.[11] The low then passed eastwards, crossing central Scotland out into the North Sea to reach northern Denmark by the morning of 3 January. The central pressure reached a minimum of 962 hPa in the eastern North Sea.[1] After crossing the North Sea, the low elongated over the southern Baltic Sea, with the centre stretching from Denmark to the Gulf of Gdańsk, with an occluded front stretching parallel to the southern Baltic Sea coast.[12] The low then coalesced with a secondary low which had formed in its wake, taking an elongated form over Denmark and the southern Baltic Sea.[13]
Forecasting and warnings
The gale's rapid development took the Irish weather service by surprise.[10] Flood warnings were only received by the police from the Met Office half an hour before water overwhelmed the sea defences.[14] The UK national forecast service was in operation at this time with warnings provided up to 12 hours before the storm.[5]
Wind damage
Ireland
Met Éireann estimated that the storm in Ireland was one third as disruptive than the previous storm of 11–12 January 1974 and was similarly disruptive as a storm on 27–28 January 1974; the numbers of casualties though were double.[10] Overall the storm was not as severe in Ireland as those storms, but in the mid-west of Ireland was particularly severe, especially along the upper reaches of the River Shannon from Limerick to Portumna and Athlone. The duration and force of the winds were comparable across Ireland to those experienced during Ex-Hurricane Debbie of 1961.[10]
In Ireland, damage from wind brought down trees and power lines on the evening of 2 January, blocking many roads. The Irish electricity board estimated some 90,000 homes (10% of all served) had disrupted power supplies for an extended period.[10] Transportation was widely affected by the storm, with many islands cut off by heavy seas. Air transport was grounded for several hours at Irish airports. At Shannon Airport, a large inflatable hangar was blown away.[10]
United Kingdom
In the British Isles, the storm was described as the worst since 1953[6] and destruction covered a wider area of the United Kingdom than the Great Storm of 1987, with 1.5 million incidents of damage reported.[15] The storm saw structural damage occur across nearly all counties of England, Wales and Northern Ireland,[1] with the worst hit areas in a band from Ulster across the Irish Sea to Lancashire and down through the Midlands into East Anglia.
Wind speeds of over 40 m/s (140 km/h; 89 mph) were recorded at a number of stations in England,[16] with RAF Wittering in Cambridgeshire recording a gust of 105 mph (169 km/h) at 22:18 GMT on 2 January. Many stations across the North East of England, East Anglia and the Midlands experienced gusts in excess of 70 kn (130 km/h; 81 mph), with mean winds (hourly) of 45 kn (83 km/h) or more. Strong gale or storm force was often reached with hurricane force 12 reported from some places in South Wales, southwest and northern England, with Middlesbrough experiencing 114 mph (183 km/h) winds.[10][17]
In mainland Britain, railways were severely affected as overhead power supplies collapsed in the Midlands. A light aircraft was blown onto the railway from the ground at Southend Airport, causing disruption on the line.[1] Damages were also incurred at Manchester Ringway Airport (now Manchester Airport), where runway approach lighting masts were bent and buckled by the wind.[18] The high winds brought down a crane in central Manchester.[19]
The high winds blew a beech tree onto the elephant house of Longleat Safari Park causing estimated damage of US$20,000, The elephants Twiggy and Chiki escaped unharmed and were later put to work pulling the remains of the tree from their home.[20]
One of the pinnacles of the main tower of Worcester Cathedral crashed through the roof into the transept during the storm.[21] There were prolonged power outages in Norfolk,[1] with power being cut to over 100,000 in the three counties of Kent, Surrey and Sussex to the south of London.[22] The Old Vic theatre in London was evacuated as strong winds brought down scaffolding surrounding the venue.[23]
A spokesman for the RAC described the general conditions in the country as being like "A giant bowling alley with trees littered like bowling pins all over the road."[19]
Prolonged power outages occurred in Northern Ireland.[1]
Netherlands
The January storm of 1976 was similar in strength to those of Cyclone Quimburga (13 November 1972) and the storm of 2 April 1973 in the Netherlands,[6] with average winds 114 km/h (71 mph) and gusts reaching 144 km/h (89 mph) in IJmuiden and Vlissingen.[24] Rotterdam-Geulhaven weather station reported a maximum gust of 82 kn (152 km/h). Two lightvessels in the North Sea reported hurricane-force winds lasting over several hours, with high windspeeds continuing for the rest of 3 January.[6]
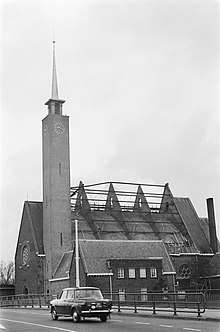
Elsewhere in the Netherlands, damages included the St Boniface church spire in Leeuwarden, which was brought down by the strong winds. Images captured of the event were featured in newspapers around the world.[25] In Amstelveen, the roof of the St Anna church was blown off.[6] Damage to forestry, particularly in the Dutch provinces of Drenthe, Utrecht, Overijssel and Gelderland was widespread, with falling trees damaging buildings in the Veluwe natural area.[6] Two fatalities were recorded in the Netherlands caused by heavy gusts; one resulted from strong winds blowing a car off the Afsluitdijk into the IJsselmeer.[6] Tens of meters of dunes and sand were eroded on Ameland in the Frisian islands, along with the Steinvoorte hotel.[6][26] In Deventer, a number of railway wagons came loose.[6] In the Westland region of South Holland, damage to greenhouses was extensive.
Elsewhere
A brief storm was recorded in northern France, especially affecting Nord-Pas de Calais, with winds in Lille reaching 137 km/h.[27] An inflatable plastic tent was also ripped away in the high winds near to Besançon, France, with the reptile exhibition inside destroyed, releasing 600 reptiles. Police later said they had re-captured the pythons, cobras, rattlesnakes and crocodiles.[20] In Germany the Meteorological institute of the Free University of Berlin saw for the first time hurricane strength (Beaufort 12) winds recorded in Berlin on 3 January.[28] In Berlin, severe storms over Beaufort 10 were recorded for 17 hours.[29] A married couple in Wilmersdorf in the city were victims of a tree brought down in the wind.[30] Peak gusts in Germany of 180 km/h occurred at Feldberg in the Black Forest.[31] In Bavaria there were six deaths caused by car accidents. In East Germany the storm caused several power outages and disrupted rail transport between Magdeburg and Halberstadt.[32]
In Switzerland, two separate incidents stranded passengers in cable cars.[1] Poland and Czechoslovakia also reported transport disruption due to the storm,[1] with winds at Prague Ruzyně Airport reaching 130 km/h (81 mph) and electricity and telephone service disruptions in Prague.[22] 120 mph (75 km/h) winds in Hungary caused forest losses and damage in Budapest, with high winds spreading into northern Yugoslavia.[22] Two deaths were reported in the Austrian Alps from heavy snowstorms, and an avalanche led to the death of a skier in Italy. The heavy winds were also reportedly responsible for spreading a forest fire to a dry cleaning facility in Como, resulting in $1 million (1976 USD) damages. Five deaths were reported across Scandinavia, with one being of a repairman trying to fix downed power lines.[22]
Shipping incidents
In the Irish Sea, 400 passengers aboard the Le Havre to Rosslare ferry arrived 10 hours late after being tossed in the storm.[10] In Merseyside at the Tranmere Oil Terminal, high winds caused the Shell oil tanker Myrina to break loose (breaking 14 mooring lines and oil discharge hoses) and strand on a sandbank. Thirteen tugs re-floated the tanker on the next day's high tide.[33] A recently opened landing stage for the Mersey Ferry was sunk, having cost 1.25 million pounds.[1] The former Isle of Man steamer TSS King Orry (IV) broke her mooring and ran aground in the Lune estuary, while berthed at Glasson Dock waiting to be dismantled.[34]
Disruption to shipping in the English Channel and North Sea was severe.[22] The storm crippled shipping along the French Channel coast sinking boats at their moorings and cross-channel ferries were suspended during the duration of the storm.[35] The Danish coaster Norfos radioed that it was listing off the southwest of England.[23] Heavy seas broke plexiglass windows on the upper decks of a ferry travelling between Norway and Belgium.
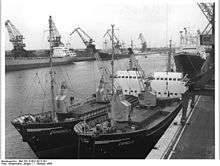
In Rotterdam the freighter Nopalsel 19,000 GRT broke free from its moorings, to prevent it from crashing into the port's main bridge twelve trucks were employed to pull the ship with steel cables.[22][35] The ship Stardust was blown aground at 's-Gravenzande, later to be demolished in situ after refloatation did not succeed.[36] The Italian ore carrier Brasilia 72,350 GRT collided with Forteiland (Fort Island) IJmuiden, on the way to Koninklijke Hoogovens steelworks, the tug Stentor ran aground in the salvage attempt.[37] Five tugs eventually pulled the Brasilia to safety, after blocking the exit to the Port of Amsterdam for eight hours.[35] In West Germany, naval helicopters rescued 22 people from ships in the lower Elbe River.[19] On the Kiel Canal a gust of wind drove the 1,000 ton freighter Elbe to collide with the 1,400 ton freighter Gabbro which was left grounded.[38]
After radioing for help on the afternoon of Saturday, 3 January, some 30 miles north of the Dutch island of Terschelling, radio reports indicated all searches had been in vain, and the 500-ton MV Carnoustie had capsized after its cargo of grain shifted during storms in the North Sea.[39][40] The ship was carrying its load from Brunsbüttel, Germany to Leith, Scotland, and all 8 crew were lost.[40][41]
To the northwest of the East Frisian Islands the 840-series coaster MS Capella registered in Rostock, East Germany began taking on water near to Borkum. The crew of 11 were lost before the Dutch coastguard could reach the ship.[22][42] The name of the ship is used to name this storm in Germany, where it is known as the "Capella" storm.
Storm surge and coastal flooding
Ireland and Irish Sea
The River Shannon flooded in Limerick with the tide level only three inches short of being a record height.[10] At Kinvara the sea crashed over the quay walls, and the town looked at times likely to be cut off as the tide rose over the road in two places, but the tide abated.[10] In Liverpool the largest surge in the city's history was recorded, with a total high water at 1.98 m in January 1976, resulting in a high water level 5.56 m above the mean tidal level (MTL).[43]
North Sea
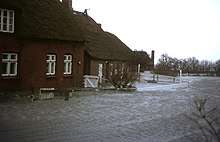
As the strong wind passed over the North Sea, a storm surge was recorded all along the east coast of the United Kingdom on 3 January, advancing from the northern North Sea, water levels in the north of England rose higher than those of the North Sea flood of 1953, although they were lower in the south. The storm surge was far more severe on the north German coast reaching levels never previously recorded, reaching 6.45 m above mean sea level at Hamburg (4.5 m above mean high water levels). Fortunately dykes had been raised after the devastating North Sea flood of 1962 which was 0.85m lower.[44]

| Location | 1953 evening tide | 1976 evening tide | 1978 evening tide |
|---|---|---|---|
| Wick | – | – | 3.92 |
| North Shields | 3.32 | 3.43 | 3.52 |
| Barton on Humber | – | – | 5.15 |
| South Ferriby | 4.79 | 5.30 | 5.30 |
| Immingham | 4.50 | 4.50 | 4.67 |
| Grimsby | – | 4.35 | 4.50 |
| Boygrift | – | 4.30 | 4.50 |
| Boston Dock | 5.25 | 5.24 | 5.50 |
| Boston Grand Sluice | 5.40 | 5.22 | 5.63 |
| Fosdyke | ca. 5.40 | 5.18 | 5.90 |
| Wisbech | ca. 5.10 | 4.99 | 5.60 |
| King's Lynn | 5.65 | 4.99 | 5.92 |
| Wells | 5.13 | 4.46 | 4.91 |
| Great Yarmouth | 3.28 | 2.69 | 2.19 |
| Southwold | 3.50 | 2.50 | 2.00 |
| Aldeburgh | 3.78 | 2.83 | 2.45 |
Aftermath
Three storms in the last quarter of the 20th century are estimated to have caused European losses in excess of €5bn at 2002 exposed property values, the Gale of 2–3 January 1976 (Capella), Daria and Lothar.[46] Capella produced event losses estimated to be more than $22.6 billion[47] (adjusted for inflation) across Europe.[48]
United Kingdom
Across the United Kingdom 1 million cubic metres of timber were destroyed,[16] the Royal Netherlands Meteorological Institute estimated that half of England's forests were flattened.[6] 100 000 m2 of glass (about 0.5% of the national total) were demolished, mainly in the West Midlands, East Anglia and the Lea Valley. There was, additionally, less severe damage to glass in these and other areas. Most of the glass demolished was old, but the cost of replacing 100 000 m2 with new glass was estimated at being up to £1 million. Some 400 000 m2 of plastic structures, about one-third of the national area were also damaged.[49]
In Cleethorpes a new nine hundred metre long sea wall was built along the railway (costing 1 million pounds). Construction began in the summer of 1977. During the construction period the area was hit by the higher locally 1978 North Sea storm surge which flooded 1000 properties,[14][50] leading to the acceleration of the building for completion in October 1978.[50] A scheme costing £215,000 was enacted to strengthen the sea defences at Mablethorpe which included installing timber doors across the pullovers which could be closed in winter. The promenade at Sutton-on-Sea was regraded, with an additional spraywall built, works were also carried out to increase the height of sea wall where it was overtopped.[50] Further along the coast in Skegness, dune defences were devastated just north of Skegness Pier, here a new concrete wall was constructed, with marram grass planted to encourage dune reformation at a cost of £200,000, which withstood the 1978 surge.[50] In Norfolk this storm and the 1978 surge led to the construction of a £1.5 million sea wall built between Happisburgh and Winterton Ness.[50]
Peak wind speeds of over 90 mph (140 km/h) were recorded at Jodrell Bank Observatory, which severely tested the structure of the Lovell Telescope. Following the storm two diagonal bracing struts were added to give the telescope greater rigidity when parked in the zenith to ride out storms.[51]
Major insurance companies estimated in the direct aftermath of the storm that damages in the United Kingdom might exceed $100 million and possibly reach $200 million ($899 million inflation adjusted to 2014).[21] The average insurance payout from the storm was £150 (£964 inflation adjusted to 2014) and totalled over 1.5 million claims. The average insurance claim for this storm was 6 times lower than storm of 1987, primarily as it affected areas of lower property values and density than that storm.[15] Insurance shares fell sharply on the London Stock exchange immediately in the wake of the storm.[1]
Belgium
Residents of affected areas were left angry and stunned, having expected better protection from the flood waters. On 6 January, residents of Ruisbroek confronted the Belgian monarch Baudouin with chants of "We want bread" and "Repair the dykes".[52][53] One angry resident famously confronted the king, asking him why "that there is 30 billion Belgian francs available for airplanes that thunder over our heads, but not enough money for reinforcing dikes?"[52] Angry residents of Moerzeke and Kastel even pelted politicians with stones.[54] This disaster created a high (but short-lived) public awareness of the risk of inundation along the tidal reach of the Scheldt.[55]
Denmark
Before the storm surge, there had been discussion in Denmark of whether to reinforce the dike at Tønder, or whether a new dike should be built forward of the existing one to withstand a 1 in 200-year storm event. This surge ended the debate and Denmark and Germany reached agreement in opening a new cross-border dike forward of the previous (Google Earth view of the area), which was completed by October 1981, with the dike at Ribe being reinforced by 1980.[56] Following the 1976 storm surge, dykes were also raised along the western coast of Jutland sufficient to contain much of the storm surge of 24 November 1981, when water-levels at Esbjerg and Ribe reached up to 5 m higher than predicted.[44]
Gallery
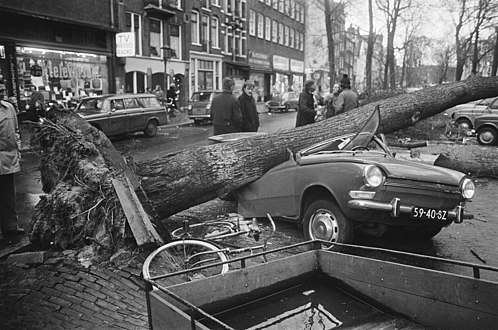 Fallen tree after storm in January 1976 Elandsgracht, Amsterdam
See also
Groundhog Day gale of 1976, an extratropical cyclone which caused disruption to the northeastern United States and Canada a month later.
References
- Shaw, M. S.; Hopkins, J. S.; Caton, P. G. F. (June 1976). "The Gales of 2 January 1976". Weather. 31 (6): 172–183. Bibcode:1976Wthr...31..172S. doi:10.1002/j.1477-8696.1976.tb04429.x.
- "Monthly Weather Report: January 1976" (PDF). Met Office. 1976. Archived (PDF) from the original on 23 October 2012. Retrieved 22 January 2013.
- Berz, Gerhard (1988). "List of major natural disasters, 1960–1987". Natural Hazards. 1 (1): 97–99. doi:10.1007/BF00168223.
- "North Atlantic Oscillation and extreme windstorms" (PDF). World Climate News. 31: 5. June 2007. Archived (PDF) from the original on 12 March 2015. Retrieved 12 March 2015.
- "1976-01-03". www.surgewatch.org. SurgeWatch. Archived from the original on 22 January 2018. Retrieved 22 January 2018.
- "De storm van 2–3 Januari 1976" (PDF) (in Dutch). KNMI. Archived (PDF) from the original on 17 October 2013. Retrieved 29 July 2012.
- "The Storminess Record from Armagh Observatory, N. Ireland 1796–2002". Armagh Observatory Meteorology Databank. Archived from the original on 4 March 2016. Retrieved 24 March 2016.
- Taubensee, Robert, E. (1976). <0325:AWMAMO>2.0.CO;2 "Weather and circulation of December 1975 – A warm month across much of the country". Monthly Weather Review. 104 (3): 325–330. Bibcode:1976MWRv..104..325T. doi:10.1175/1520-0493(1976)104<0325:AWMAMO>2.0.CO;2.
- Wagner, A. James (April 1976). <0491:IDICAT>2.0.CO;2 "Weather and circulation of January 1976 – Increasing drought in California and southern Great Plains". Monthly Weather Review. 104 (4): 491–498. Bibcode:1976MWRv..104..491W. doi:10.1175/1520-0493(1976)104<0491:IDICAT>2.0.CO;2.
- "Storm of January 2, 1976" (PDF). Met Éireann. Archived from the original (PDF) on 22 May 2012. Retrieved 18 July 2012.
- Hubert Lamb (13 June 1991). Historic Storms of the North Sea, British Isles and Northwest Europe. Cambridge University Press. pp. 31–. ISBN 978-0-521-37522-1. Archived from the original on 31 December 2013. Retrieved 16 September 2012.
- Sztobryn, Marzenna (2005). "Storm Surges in the Southern Baltic Sea (Western and Central Parts)". Berichte des Bundesamtes für Seeschifffahrt und Hydrographie. 39. ISSN 0946-6010.
- Harding, J; Binding A. A. (1978). "The specification of wind and pressure fields over the North Sea and some areas of the North Atlantic during 42 gales from the period 1966 to 1976" (PDF). Institute of Oceanographic Sciences, Report Number 55. Unpublished Manuscript. Archived (PDF) from the original on 2 April 2015. Retrieved 26 September 2012.
- "Furious storms punch through resort's defences". Grimsby Telegraph. 10 January 2010. Archived from the original on 5 May 2013. Retrieved 19 October 2012.
- "The Great Storm of 1987: 20-Year Retrospective" (PDF). RMS. Archived (PDF) from the original on 17 February 2012. Retrieved 18 July 2012.
- Merriman, P. A.; Browitt C. W. A. (1993). Natural Disasters: Protecting Vulnerable Communities : Proceedings of the Conference Held in London, 13–15 October 1993. Thomas Telford. p. 527. ISBN 9780727719362. Retrieved 24 August 2012.
- Bartlett, Paul (14 September 2010). "Wild Weather: The perfect storm". BBC. Archived from the original on 27 October 2010. Retrieved 19 July 2012.
- "Gale damage 08.01.1976". ringwaypublications.com. Archived from the original on 1 February 2013. Retrieved 16 September 2012.
- "Deadly gale: British Isles battered". The Evening Independent. 3 January 1976. Retrieved 28 September 2012.
- "Gale Kills 38 Persons in Europe". Ocala Star-Banner. 4 January 1976. Retrieved 17 November 2012.
- "42 die as storm hits West Europe; new gales building up near Iceland". The Montreal Gazette. 3 January 1976. Retrieved 5 October 2012.
- "Europe cleans up after gale havoc". New Straights Times. 6 January 1976. Retrieved 28 September 2012.
- "Death and Havoc: UK Hardest Hit as Gales Lash Europe". The Leader-Post. 3 January 1976. Retrieved 25 October 2012.
- "Zware stormen in Nederland sinds 1910" (in Dutch). KNMI. Archived from the original on 15 November 2012. Retrieved 15 August 2012.
- "Architectuur en Geschiedenis" (in Dutch). stichtingbonifatiustoren.nl. Archived from the original on 2 January 2014. Retrieved 30 July 2012.
- "Thuis heb ik nog een ansichtkaart ..." (in Dutch). Persbureau-ameland. Archived from the original on 2 January 2014. Retrieved 15 August 2012.
- "Les chroniques météo de l'année 1976" (in French). Meteo Paris. Archived from the original on 5 July 2012. Retrieved 29 July 2012.
- Schlaak, Paul. "Wetter in Berlin von 1962 bis 1989" (in German). Archived from the original on 23 December 2012. Retrieved 16 September 2012.
- "Extreme Wetter- und Witterungsereignisse im 20. Jahrhundert" (PDF). DWD. Archived (PDF) from the original on 18 April 2013. Retrieved 19 October 2012.
- "Der stärkste Orkan seit 30 Jahren" (in German). Der Tagesspiegel. Archived from the original on 22 October 2013. Retrieved 27 September 2012.
- "Naturkatastrophen in Deutschland" (PDF) (in German). Munich Re. Archived (PDF) from the original on 16 April 2012. Retrieved 18 July 2012.
- "Europe cleaning up after severe storm". Pittsburgh Post-Gazette. 5 January 1976. Retrieved 28 September 2012.
- "Halt plane, rail traffic; power off". Youngstown Vindicator. 3 January 1976. Retrieved 28 September 2012.
- "King Orry – IMO 5187607". shipspotting.com. Archived from the original on 24 October 2013. Retrieved 2 November 2012.
- "Gale-Force Winds Lash Western Europe". Rome News-Tribune. 4 January 1976. Retrieved 21 November 2012.
- "Beeldbank". Nationaal Archief. Archived from the original on 20 December 2012. Retrieved 3 November 2012.
- "Stentor II, Stories". bureau-wijsmuller.nl. Retrieved 8 November 2012.
- "Violent Storm Kills 38 in West Europe, Cuts Power, Transit". Toledo Blade. 4 January 1976. Retrieved 14 March 2013.
- "Death Toll Tops 40: Europe Cleaning Up After Severe Storm". Pittsburgh Post-Gazette. 5 January 1976. Retrieved 25 October 2012.
- "Update of mortality for workers in the UK merchant shipping and fishing sectors" (PDF). UK Department for Transport. Archived (PDF) from the original on 28 September 2012. Retrieved 29 September 2012.
- "MV Carnoustie [+1976]". wrecksite.eu. Retrieved 28 September 2012.
- "MV Capella (+1976)". wrecksite.eu. Retrieved 9 November 2012.
- Brown, Jennifer M.; Souza, Alejandro J.; Wolf, Judith (20 May 2010). "An investigation of recent decadal-scale storm events in the eastern Irish Sea" (PDF). Journal of Geophysical Research. 115 (C5): C05018. Bibcode:2010JGRC..115.5018B. doi:10.1029/2009JC005662.
- Muir-Wood, R. (1993). Windstorm hazard in Northwest Europe (PDF). in Natural Disasters: Thomas Telford. Archived from the original on 19 April 2016. Retrieved 2 January 2020.
- Steers, J. A.; Stoddart, D. R.; Bayliss-Smith, T. P.; Spencer, T.; Durbidge, P. M. (July 1979). "The Storm Surge of 11 January 1978 on the East Coast of England". The Geographical Journal. 145 (2): 192–205. doi:10.2307/634386. JSTOR 634386.
- "Anatol, Lothar and Martin – When Will They Happen Again?" (PDF). Air Worldwide Corporation. Archived (PDF) from the original on 23 October 2007. Retrieved 7 September 2012.
- Federal Reserve Bank of Minneapolis. "Consumer Price Index (estimate) 1800–". Retrieved 1 January 2020.
- Barredo, J. I. (2010). "No upward trend in normalised windstorm losses in Europe: 1970–2008". Natural Hazards and Earth System Sciences. 10: 97–104. doi:10.5194/nhess-10-97-2010.
- "Glasshouses (Storm Damage)". Parliamentary Debates (Hansard). House of Commons. 16 January 1976. col. 285–6W. Archived from the original on 25 December 2012. Retrieved 15 November 2012.
- Taylor, H. R.; Marsden A. E. "17" (PDF). Anglian Water Authority. Retrieved 24 August 2012. Missing or empty
|title=(help) - "The MKIA Radio Telescope". University of Manchester. Archived from the original on 17 September 2011. Retrieved 23 July 2012.
- "Flood of '76". gogkbr.be. Archived from the original on 17 October 2013. Retrieved 30 July 2012.
- "Belgium: Village of Ruisbroek, South of Antwerp, Still Under Flood After Weekend Storms". ITNsource. Retrieved 25 August 2012.
- Meyvis, Leo (April 2003). "Watersnood 1976 – Vlaams Instituut voor de Zee" (PDF) (in Dutch). Flemish Institute for the sea. Archived (PDF) from the original on 17 October 2013. Retrieved 2 September 2012.
- London Climate Change Partnership (2006). "Adapting to climate change: Lessons for London" (PDF). Adapting to climate change: Lessons for London. Greater London Authority, London. Archived (PDF) from the original on 4 June 2013. Retrieved 30 July 2012.
- Andersen, Jens Otto (1998). "Flood Protection in the Danish Wadden Sea Area". International Conference of Coastal Engineering: 3542–3552. Retrieved 31 July 2012.
External links
- Loader, C. (1976) The Storm of 2–3 January, 1976. Journal of Meteorology 1 (9).
- Surgewatch.org event data
- Cleethorpes railway line severed by floods January 1976, at Daves Railpics of Lincolnshire and UK Heritage Railways.

