Flieth-Stegelitz
Flieth-Stegelitz is a municipality in the Uckermark district, in Brandenburg, Germany. It is part of the Amt ("collective municipality") Gerswalde. The municipality arose on 31 December 2001 by merging the former autonomous municipalities of Flieth and Stegelitz.
Flieth-Stegelitz | |
|---|---|
Location of Flieth-Stegelitz within Uckermark district 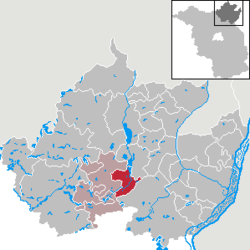 | |
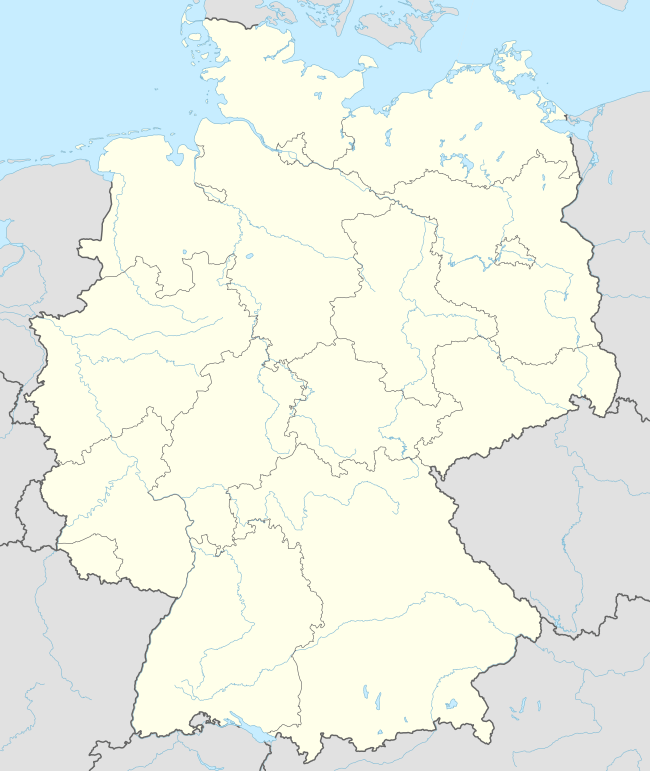 Flieth-Stegelitz 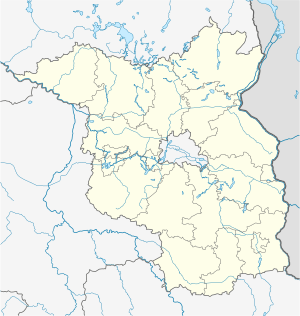 Flieth-Stegelitz | |
| Coordinates: 53°10′00″N 13°49′00″E | |
| Country | Germany |
| State | Brandenburg |
| District | Uckermark |
| Municipal assoc. | Amt Gerswalde |
| Government | |
| • Mayor | Heinz Böttcher |
| Area | |
| • Total | 46.60 km2 (17.99 sq mi) |
| Elevation | 41 m (135 ft) |
| Population (2018-12-31)[1] | |
| • Total | 529 |
| • Density | 11/km2 (29/sq mi) |
| Time zone | CET/CEST (UTC+1/+2) |
| Postal codes | 17268 |
| Dialling codes | 039887 |
| Vehicle registration | UM |
| Website | www.amt-gerswalde.de |
Geography
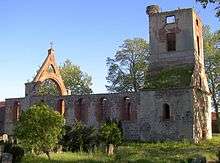
The municipal area is located in the rural Uckermark region of northeastern Brandenburg, within the Schorfheide-Chorin Biosphere Reserve. In the north it borders on the shore of Lake Oberuckersee, fed and drained by the Uecker River. The municipality contains six localities (Ortsteile):
|
|
History
Both Flieth (Vlete) and Stegelitz in the Margraviate of Brandenburg were first mentioned in a 1269 deed, probably founded by the scions of one Stegelitz noble dynasty. While Flieth passed to the Arnim noble family in the mid 15th century, Stegelitz was sold several times, until both villages were devastated during the Thirty Years' War.
In 1734 the Arnim dynasty held Flieth and Stegelitz, they built a lavish manor house in Suckow, which was burnt to the ground in the late days of World War II.
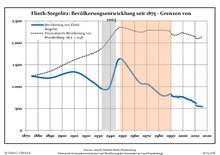
Demography
|
|
|
References
- "Bevölkerung im Land Brandenburg nach amtsfreien Gemeinden, Ämtern und Gemeinden 31. Dezember 2018". Amt für Statistik Berlin-Brandenburg (in German). July 2019.
- Detailed data sources are to be found in the Wikimedia Commons.Population Projection Brandenburg at Wikimedia Commons
| Wikimedia Commons has media related to Flieth-Stegelitz. |