Arcade game
An arcade game or coin-op game is a coin-operated entertainment machine typically installed in public businesses such as restaurants, bars and amusement arcades. Most arcade games are video games, pinball machines, electro-mechanical games, redemption games or merchandisers. While exact dates are debated, the golden age of arcade video games is usually defined as a period beginning sometime in the late 1970s and ending sometime in the mid-1980s. Excluding a brief resurgence in the early 1990s, the arcade industry subsequently declined in the Western hemisphere as competing home video game consoles such as the Sony PlayStation and Microsoft Xbox increased in their graphics and game-play capability and decreased in cost. The Eastern Hemisphere retains a strong arcade industry.[1]
| Part of a series on: |
| Video games |
|---|
|
Platforms
|
History

Games of skill had been popular amusement-park midway attractions since the 19th century, and with the introduction of solid-state electronics and coin-operated machines, presented the opportunity for a viable business. However, the manufacturer of these games had their roots in the production of gambling equipment such as slot machines, and created concerns to the nature of these games. When pinball machines with electronic lights and displays were introduced in 1933, but without the user-controller flippers which would not invented until 1947, these machines were seen as games of luck, as well as amoral playthings that drew the attention of rebellious young people to them, and numerous state and city bans were placed on these machines which lasted into the 1960s and 1970s.[2] Electro-mechanical games introduced in 1996 served a early precursors of the arcade game. Sega's Periscope was one of the first such games, and established the standard of use a quarter per play.[3]
Spacewar!, recognized as the first video game, inspired to the first two arcade games; Galaxy Game, a demonstration coin-operated unit run at Stanford University in November 1971, Computer Space, the first commercial arcade game created by Nolan Bushnell and Ted Dabney in the same month. Bushnell and Dabney followed their success of Computer space with the help of Allan Alcorn to create a table tennis game Pong, released in 1972. Pong was a commercial success, leading to numerous other coin-op manufacturers to enter the market and create the arcade game industry.[4]
The industry entered a "Golden Age" in 1978 with the release of Taito's Space Invaders, which introduced a number of novel gameplay features including tracking the highest score, leading to its popularity. From 1978 to 1982 several other major arcade games from Namco, Atari, Williams Electronics, Stern Electronics, and Nintendo were all considered blockbuster titles, particularly with Namco's Pac-Man in 1980 as the game became a popular culture fixture. Across North America and Japan, dedicated video game arcades appeared and arcade game cabinets appeared in many smaller storefronts. By 1981, the arcade video game industry was worth US$8 billion[5] The novelty of the arcade game waned sharped after 1982 from several factors, including an oversaturation of the market with the number of arcade titles and arcades themselves, a moral panic created over video games due to similar fears that had been raised over pinball machines in the decades prior, and the 1983 video game crash in the home console market that impacted arcades. By 1991, US arcade video game revenues had fallen to US$2.1 billion.[6]
Arcade games continued to improve with technology and gameplay evolutions. In the early 1990s, the release of Capcom's Street Fighter II established the modern style of fighting games and led to a number of similar titles such as Mortal Kombat, The King of Fighters, Virtua Fighter, and Tekken, creating a new renaissance in the arcade.[7][8] Convergence of computer technology and features such as 3D graphics also led to more advanced games, with arcade publishers able to make titles comparable to games on computers and consoles.[9]
Since the 2000s, the arcade game field has taken different routes globally. In the United States, arcades have become niche markets as they compete with the home console market, and they have had to adapt other business models, such as providing other entertainment options or adding prize redemptions. On the other hand, arcades continue to flourish in Japan and China, where arcade games like Dance Dance Revolution and The House of the Dead are tailored to experiences that players cannot easily have at home.[11]
Technology
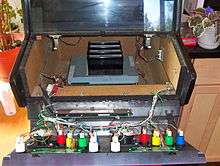
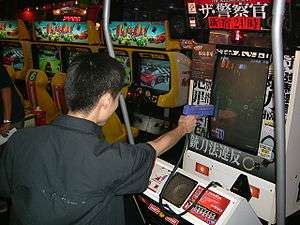
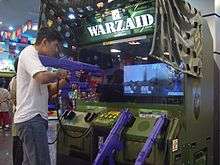
Virtually all modern arcade games (other than the very traditional Midway-type games at county fairs) make extensive use of solid state electronics, integrated circuits and cathode-ray tube screens. In the past, coin-operated arcade video games generally used custom per-game hardware often with multiple CPUs, highly specialized sound and graphics chips, and the latest in expensive computer graphics display technology. This allowed arcade system boards to produce more complex graphics and sound than what was then possible on video game consoles or personal computers, which is no longer the case in the 2010s. Arcade game hardware in the 2010s is often based on modified video game console hardware or high-end PC components. Arcade games frequently have more immersive and realistic game controls than either PC or console games, including specialized ambiance or control accessories: fully enclosed dynamic cabinets with force feedback controls, dedicated lightguns, rear-projection displays, reproductions of automobile or airplane cockpits, motorcycle or horse-shaped controllers, or highly dedicated controllers such as dancing mats and fishing rods. These accessories are usually what set modern video games apart from other games, as they are usually too bulky, expensive, and specialized to be used with typical home PCs and consoles. Currently with the advent of Virtual reality, arcade makers have begun to experiment with Virtual reality technology. Arcades have also progressed from using coin as credits to operate machines to cards that hold the virtual currency of credits.
Arcade genre
Arcade games often have short levels, simple and intuitive control schemes, and rapidly increasing difficulty. This is due to the environment of the Arcade, where the player is essentially renting the game for as long as their in-game avatar can stay alive (or until they run out of tokens). Games on consoles or PCs can be referred to as "arcade games" if they share these qualities or are direct ports of arcade titles. Many independent developers are now producing games in the arcade genre that are designed specifically for use on the Internet. These games are usually designed with Flash/Java/DHTML and run directly in web-browsers. Arcade racing games have a simplified physics engine and do not require much learning time when compared with racing simulators. Cars can turn sharply without braking or understeer, and the AI rivals are sometimes programmed so they are always near the player (rubberband effect).
Arcade flight games also use simplified physics and controls in comparison to flight simulators. These are meant to have an easy learning curve, in order to preserve their action component. Increasing numbers of console flight video games, from Crimson Skies to Ace Combat and Secret Weapons Over Normandy indicate the falling of manual-heavy flight sim popularity in favor of instant arcade flight action.[12] Other types of arcade-style games include fighting games (often played with an arcade controller), beat 'em up games (including fast-paced hack and slash games), light gun rail shooters and "bullet hell" shooters (intuitive controls and rapidly increasing difficulty), music games (particularly rhythm games), and mobile/casual games (intuitive controls and often played in short sessions).
Arcade action games
The term "arcade game" is also used to refer to an action video game that was designed to play similarly to an arcade game with frantic, addictive gameplay.[13] The focus of arcade action games is on the user's reflexes, and the games usually feature very little puzzle-solving, complex thinking, or strategy skills. Games with complex thinking are called strategy video games or puzzle video games.
Emulation
Emulators such as MAME, which can be run on modern computers and a number of other devices, aim to preserve the games of the past. Emulators enable game enthusiasts to play old video games using the actual code from the 1970s or 1980s, which is translated by a modern software system. Legitimate emulated titles started to appear on the Macintosh (1994)[14][15] with Williams floppy disks, Sony PlayStation (1996) and Sega Saturn (1997), with CD-ROM compilations such as Williams Arcade's Greatest Hits and Arcade's Greatest Hits: The Atari Collection 1, and on the PlayStation 2 and GameCube with DVD-ROM titles such as Midway Arcade Treasures. Arcade games are currently being downloaded and emulated through the Nintendo Wii Virtual Console Service starting in 2009 with Gaplus, Mappy, Space Harrier, Star Force, The Tower of Druaga, Tecmo Bowl, Altered Beast and many more. Other classic arcade games such as Asteroids, Tron, Discs of Tron, Yie Ar Kung-Fu, Pac-Man, Joust, Battlezone, Dig Dug, Robotron: 2084, and Missile Command are emulated on PlayStation Network and Xbox Live Arcade. The emulators have evolved to be used in mobile phones (APPS) or websites that function as an online emulator.
Industry
In addition to restaurants and video arcades, arcade games are also found in bowling alleys, college campuses, video rental shops, dormitories, laundromats, movie theaters, supermarkets, shopping malls, airports, ice rinks, corner shops, truck stops, bars/pubs, hotels, and even bakeries. In short, arcade games are popular in places open to the public where people are likely to have free time.[16]
Currently
Arcade machines spawned various communities and industries such as Fighting game community, and popular tournaments such as Evolution Championship Series.
The American Amusement Machine Association (AAMA) is a trade association established in 1981[17] that represents the coin-operated amusement machine industry,[18] including 120 arcade game distributors and manufacturers.[19]
Often averaging the amount paid per game based on the length of the game play, knowing people are likely to try more than one game.
List of highest-grossing games
For arcade games, success was usually judged by either the number of arcade hardware units sold to operators, or the amount of revenue generated, from the number of coins (such as quarters, dollars or 100 yen coins) inserted into machines,[20] or the hardware sales (with arcade hardware prices often ranging from US$1000 to US$4000 or more). This list only includes arcade games that have either sold more than 1000 hardware units or generated a revenue of more than US$1 million. Most of the games in this list date back to the golden age of arcade video games, though some are also from before and after the golden age.
| Game | Release year | Hardware units sold | Estimated gross revenue (US$ without inflation) |
Estimated gross revenue (US$ with 2019 inflation)[21] |
|---|---|---|---|---|
| Pac-Man | 1980 | 400,000 (up to 1982)[22] | $3.5 billion (up to 1999)[23][n 1] | $10.9 billion |
| Space Invaders | 1978 | 360,000 (up to 1980)[24] | $2.702 billion (up to 1982)[n 2] | $10.6 billion |
| Street Fighter II | 1991 | 200,000 (up to 1992) (The World Warrior: 60,000 Champion Edition: 140,000)[n 3] |
$2.312 billion (up to 1995) (The World Warrior Champion Edition)[23] |
$4.34 billion (The World Warrior Champion Edition) |
| Donkey Kong | 1981 | 132,000 (up to 1982)[n 4] | $280 million (up to 1982) (US hardware sales)[29] |
$787 million (US hardware sales) |
| Ms. Pac-Man | 1981 | 125,000 (up to 1988)[30][31] | ||
| Asteroids | 1979 | 100,000 (up to 2001)[31][32] | $800 million (up to 1991)[33][34] | $1.5 billion |
| Defender | 1981 | 60,000 (up to 2002)[35][36] | $1 billion (up to 2002)[37][38] | $1.42 billion |
| Galaxian | 1979 | 40,000 (in the US up to 1982)[39][40] | ||
| Donkey Kong Jr. | 1982 | 30,000 (in the US up to 1982)[41] | ||
| Mr. Do! | 1982 | 30,000 (in the US up to 1982)[42] | ||
| Popeye | 1982 | 20,000 (in the US up to 1982)[28] | ||
| Out Run | 1986 | 20,000 (up to 1987)[43] | ||
| Pump It Up | 1999 | 20,000 (up to 2005)[44] | ||
| NBA Jam | 1993 | 20,000 (up to 2013)[45] | $1 billion (up to 2010)[46] | $1.17 billion |
| Gun Fight | 1975 | 8,000 (up to 1976)[47][48] | ||
| Sega Network Mahjong MJ3 | 2005 | 7,608 (up to 2006)[49] | ||
| Hang-On | 1985 | 7,500 (up to 1985)[50] | ||
| Dinosaur King | 2005 | 7,000 (up to 2006)[51] | ||
| Speed Race | 1974 | 7,000 (up to 1975)[52][53] | ||
| Sega Network Mahjong MJ2 | 2003 | 5,486 (up to 2005)[56] | ||
| Donkey Kong 3 | 1983 | 5,000 (in the US up to 1982)[n 4] | ||
| Sangokushi Taisen 2 | 2006 | 4,041 (up to 2007)[n 5] | ||
| Initial D Arcade Stage 4 | 2007 | 3,904 (up to 2007)[n 6] | ||
| Mario Bros. | 1983 | 3,800 (in the US up to 1983)[59] | ||
| Dance Dance Revolution | 1998 | 3,500 (in Japan as of 1999)[60] | ||
| Zoo Keeper | 1982 | 3,000 (in the US up to 1983)[61] | ||
| Initial D Arcade Stage | 2001 | 2,534 (up to 2004)[62] | ||
| World Club Champion Football | 2002 | 2,479 (up to 2009)[n 8] | $706.014 million (up to 2012)[67] | $1 billion |
| Mortal Kombat | 1992 | 24,000 (up to 2002)[25] | $570 million (up to 2002)[25] | $810 million |
| Jungle Hunt | 1982 | 18,000 (in the US up to 1983)[61] | ||
| Scramble | 1981 | 15,136 (up to 1981)[68] | ||
| Mushiking: King of the Beetles | 2003 | 13,500 (up to 2005)[69] | $530 million (up to 2007)[n 10] | $737 million |
| Mahjong Fight Club 3 | 2004 | 13,000 (up to 2004)[70] | ||
| Super Cobra | 1981 | 12,337 (up to 1981)[68] | ||
| Oshare Majo: Love and Berry | 2004 | 10,300 (up to 2006)[71][72] | $302.68 million (up to 2007)[n 11] | $410 million |
| Centipede | 1981 | 55,988 (up to 1991)[73] | $115.65 million (up to 1991)[73] | $217 million |
| Shining Force Cross | 2009 | 2,389 (up to 2009)[74] | ||
| Pengo | 1982 | 2,000 (in the US up to 1983)[61] | ||
| Sangokushi Taisen | 2005 | 1,942 (up to 2006)[75] | ||
| World Club Champion Football: Intercontinental Clubs | 2008 | 1,689 (up to 2009)[n 7] | $150.1 million (up to 2012)[n 9] | $178 million |
| Dragon's Lair | 1983 | 16,000 (up to 1983)[77][78] | $68.8 million (up to 1983)[77][79] | $177 million |
| Mortal Kombat II | 1993 | 27,000 (up to 2002)[25] | $100 million (up to 1994)[80] | $172 million |
| Pole Position | 1982 | 21,000 (in the US up to 1983)[59] | $60.933 million (up to 1983)[59][73] (US hardware sales) |
$161 million (US hardware sales) |
| StarHorse3 Season I: A New Legend Begins | 2011 | $132.18 million (up to 2012)[n 12] | $150 million | |
| Border Break | 2009 | 2,998 (up to 2009)[74] | $107 million (up to 2012)[n 13] | $128 million |
| Dig Dug | 1982 | 22,228[73] (in the US up to 1983)[61] | $46.3 million (up to 1983)[73] (US hardware sales) |
$123 million (US hardware sales) |
| Tempest | 1981 | 29,000 (up to 1983)[59] | $62.408 million (up to 1991)[73] | $117 million |
| TV Basketball (Basketball) | 1974 | 1,400 (up to 1974)[81] | ||
| The House of the Dead 4 | 2005 | 1,008 (up to 2005)[82] | ||
| Radar Scope | 1980 | 1,000 (in the US up to 1980)[83] | ||
| Tron | 1982 | 800 (in the US up to 1982)[84] | $45 million (up to 1983)[85] | $102 million |
| Sengoku Taisen | 2010 | $94.04 million (up to 2012)[n 14] | $110 million | |
| Dragon Quest: Monster Battle Road | 2007 | $78.2 million (up to 2008)[n 15] | $96.4 million | |
| Starhorse2 | 2005 | 38,614 (up to 2009)[n 16] | $59.321 million (up to 2011) (Fifth Expansion)[n 17] |
$77.7 million (Fifth Expansion) |
| Q*bert | 1982 | 25,000 (up to 2001)[89] | ||
| Robotron: 2084 | 1982 | 23,000 (up to 1983)[59] | ||
| Samba de Amigo | 1999 | 3,000 (up to 2000)[90] | $47.11 million (up to 2000)[91] | $72.3 million |
| Asteroids Deluxe | 1981 | 22,399 (up to 1999)[92] | $46.1 million (up to 1999)[92] | $70.8 million |
| Missile Command | 1980 | 19,999 (up to 2010)[93] | $36.8 million (up to 1991)[92] | $69.1 million |
| Berzerk | 1980 | 15,780 (up to 1981)[68] | ||
| Sangokushi Taisen 3 | 2007 | $54.4 million (up to 2011)[n 18] | $67.1 million | |
| Pong | 1972 | 8,500–19,000[94][95] | $11 million (up to 1973)[96] | $63.4 million} |
| Lord of Vermilion | 2008 | $50.443 million (up to 2008)[n 19] | $59.9 million | |
| Sega Network Mahjong MJ4 | 2008 | 12,892 (up to 2009)[97] | $47 million (up to 2010)[n 20] | $55.8 million |
| Kangaroo | 1982 | 9,803[73] (up to 1983)[61] | $20.58 million (up to 1983) (US hardware sales)[73] |
$54.5 million (US hardware sales) |
| Battlezone | 1980 | 15,122 (up to 1999)[92] | $31.2 million (up to 1999)[92] | $47.9 million |
| Stargate | 1983 | 15,000 (up to 1983)[59] | ||
| Space Duel | 1982 | 12,038 (up to 1991)[73] | ||
| Big Buck Hunter Pro | 2006 | 10,000 (up to 2009)[99][100] | ||
| Snake Pit | 1983 | 9,000 (up to 1983)[101] | ||
| Bagman | 1983 | 5,000 (in the US up to 1983)[61] | ||
| Big Buck Safari | 2008 | 5,500 (up to 2009)[99] | ||
| Hard Drivin' | 1989 | 3,318 (up to 1989)[73] | $22.9 million (up to 1989)[73] | $47.2 million |
| Gauntlet | 1985 | 7,848 (up to 1985)[73] | $18.01 million (up to 1985)[73] | $42.8 million |
| Sega Network Mahjong MJ5 | 2011 | $34.87 million (up to 2012)[n 21] | $39.6 million | |
| Millipede | 1982 | 9,990 (up to 1991)[73] | $20.669 million (up to 1991)[73] | $38.8 million |
| Race Drivin' | 1990 | 3,525 (up to 1991)[73] | $20.03 million (up to 1991)[73] | $37.6 million |
| Time Traveler | 1991 | $18 million (up to 1991)[79] | $33.8 million | |
| Space Ace | 1984 | $13 million (up to 1984)[79] | $32 million | |
| Xevious | 1982 | 5,295 (in the US up to 1983)[73] | $11.1 million (up to 1983)[73] (US hardware sales) |
$29.4 million (US hardware sales) |
| Big Buck Hunter Pro: Open Season | 2009 | 3,000 (up to 2010)[103] | ||
| Silver Strike Live | 2010 | 3,000 (up to 2010)[104] | ||
| H2Overdrive | 2009 | 2,000 (up to 2010)[105] | ||
| Atari Football | 1978 | 11,306 (up to 1999)[92] | $17.266 million (up to 1999)[92] | $26.5 million |
| Final Lap | 1987 | 1,150 (in the US up to 1988)[73] | $9.5 million (up to 1988)[73] (US hardware sales) |
$21.4 million (US hardware sales) |
| Paperboy | 1984 | 3,442 (up to 1991)[73] | $8.6 million (up to 1991)[73] | $16.1 million |
| Star Wars | 1983 | 12,695 (up to 1991)[73] | $7.595 million (up to 1991)[73] | $14.3 million |
| Beatmania | 1997 | 25,000 (up to 2000)[106] | $12.4 million (up to 1998) (Japan hardware sales)[n 22] |
$19.7 million (Japan hardware sales) |
| Sprint 2 | 1976 | 8,200 (up to 1999)[92] | $12.669 million (up to 1999)[92] | $19.4 million |
| Championship Sprint | 1986 | 3,595 (up to 1991)[73] | $8.26 million (up to 1991)[73] | $15.5 million |
| Pole Position II | 1983 | 2,400 (in the US up to 1983)[73] | $7.43 million (up to 1983)[73] (US hardware sales) |
$19.1 million (US hardware sales) |
| Breakout | 1976 | 11,000 (up to 1999)[92] | $12.045 million (up to 1999)[92] | $18.5 million |
| Sea Wolf | 1976 | 10,000 (up to 2000)[107] | ||
| Lunar Lander | 1979 | 4,830 (up to 1999)[92] | $8.19 million (up to 1999)[92] | $12.6 million |
| Super Sprint | 1986 | 2,232 (up to 1999)[92] | $7.8 million (up to 1999)[92] | $12 million |
| Marble Madness | 1984 | 4,000 (up to 1985)[108] | $6.3 million (up to 1991)[73] | $11.8 million |
| Sea Wolf II | 1978 | 4,000 (up to 2000)[109] | ||
| Rolling Thunder | 1986 | 2,406 (in the US up to 1987)[73] | $4.8 million (up to 1987)[73] (US hardware sales) |
$11.2 million (US hardware sales) |
| Tetris | 1989 | 5,771 (in the US up to 1991)[73] | $5.2 million (up to 1991)[73] (US hardware sales) |
$9.76 million (US hardware sales) |
| Arabian | 1983 | 1,950 (in the US up to 1983)[61] | $3.9 million (up to 1983)[73] (US hardware sales) |
$10 million (US hardware sales) |
| Terminator Salvation | 2010 | 1,000 (up to 2010)[110] | $8 million (up to 2010)[110] | $9.38 million |
| Blasteroids | 1987 | 2,000 (up to 1991)[73] | $4.69 million (up to 1991)[73] | $8.8 million |
| Super Breakout | 1978 | 4,805 (up to 1999)[92] | $5.7 million (up to 1999)[92] | $8.75 million |
| Pac-Mania | 1987 | 1,412 (in the US up to 1987)[73] | $2.82 million (up to 1987)[73] (US hardware sales) |
$6.35 million (US hardware sales) |
| Indiana Jones and the Temple of Doom | 1985 | 2,825 (up to 1991)[73] | $3.2 million (up to 1991)[73] | $6.01 million |
| Four Trax | 1989 | 205 (in the US & EU as of 1989)[73] | $2.9 million (up to 1989)[73] (US & EU hardware sales) |
$5.98 million (US & EU hardware sales) |
| Assault | 1988 | 1,079 (in the US up to 1988)[73] | $2.5 million (up to 1988)[73] (US hardware sales) |
$5.4 million (US hardware sales) |
| Gauntlet II | 1986 | 3,520 (up to 1991)[73] | $2.4 million (up to 1991)[73] | $4.51 million |
| Guitar Hero Arcade | 2009 | 2,000 (up to 2009)[111] | ||
| Drag Race | 1977 | 1,900 (up to 1999)[92] | $2.8 million (up to 1999)[92] | $4.3 million |
| Night Driver | 1976 | 2,100 (up to 1999)[92] | $2.4675 million (up to 1999)[92] | $3.79 million |
| I, Robot | 1984 | 750-1,000[73][112] | $1.5 million (up to 1984)[73] | $3.69 million |
| R.B.I. Baseball | 1987 | 3,945 (in the US up to 1987)[73] | $1.6 million (up to 1987)[73] (US hardware sales) |
$3.6 million (US hardware sales) |
| Computer Space | 1971 | 1,500–2,000 (up to 1984)[113][114] | ||
| Death Race | 1976 | 1,000 (up to 1976)[48] | ||
| Dunk Shot | 1986 | 556 (in the US up to 1987)[73] | $1.4 million (up to 1987)[73] (US hardware sales) |
$3.27 million (US hardware sales) |
| Star Wars: Return of the Jedi | 1984 | 800 (up to 1991)[73] | $1.68 million (up to 1991)[73] | $3.15 million |
| Dragon Spirit | 1987 | 600 (in the US up to 1987)[73] | $1.2 million (up to 1987)[73] (US hardware sales) |
$2.7 million (US hardware sales) |
| Triple Hunt | 1977 | 865 (up to 1999)[92] | $1.2 million (up to 1999)[92] | $1.84 million |
Best-selling arcade video game franchises
These are the combined hardware sales of at least two or more arcade games that are part of the same franchise. This list only includes franchises that have sold at least 5,000 hardware units or grossed at least $10 million revenues.
| Franchise | Original release year | Total hardware units sold | Gross revenue (US$ without inflation) |
Gross revenue (US$ with 2019 inflation)[21] |
|---|---|---|---|---|
| Pac-Man | 1980 | 526,412 (up to 1988)[n 23] | $3.853 billion (up to 1999)[n 24] | $12 billion |
| Street Fighter | 1987 | 500,000 (up to 2002)[116][117] | $2.312 billion (up to 1993) (Street Fighter II: The World Warrior Street Fighter II′: Champion Edition)[23] |
$5.2 billion (Street Fighter II: The World Warrior Street Fighter II': Champion Edition) |
| Space Invaders | 1978 | 360,000 (up to 1980)[24] | $2.702 billion (up to 1982)[118] | $10.6 billion |
| Pac-Man clones | 1980 | 300,000 (up to 2002)[119] | ||
| Mario | 1981 | 170,800 (up to 1983)[n 25] | $280 million (up to 1982) (US hardware sales)[29] |
$787 million (US hardware sales) |
| Donkey Kong | 1981 | 167,000 (up to 1983)[n 4] | $280 million (up to 1982) (US hardware sales)[29] |
$787 million (US hardware sales) |
| Asteroids | 1979 | 136,437 (up to 1999)[n 26] | $850.79 million (up to 1999)[n 27] | $1.31 billion |
| Golden Tee Golf | 1989 | 100,000 (up to 2011)[120] | ||
| Defender | 1981 | 75,000 (up to 2002)[n 28] | $1 billion (up to 2002)[37] | $1.42 billion |
| Centipede | 1981 | 65,978 (up to 1991)[n 29] | $136.3 million (up to 1991)[n 30] | $256 million |
| Mortal Kombat | 1992 | 51,000 (up to 2002)[25] | $1 billion (up to 1995)[121] | $1.42 billion |
| Galaxian | 1979 | 40,986 (in the US up to 1988)[n 31] | ||
| Starhorse | 2000 | 38,734 (up to 2009)[n 32] | $191.501 million (up to 2012)[n 33] | $284 million |
| Big Buck | 2000 | 33,500 (up to 2010)[n 34] | ||
| Mr. Do! | 1982 | 30,000 (in the US up to 1982)[42] | ||
| Dragon Quest: Monster Battle Road | 2007 | $78.2 million (up to 2008)[n 15] | $96.4 million | |
| Lord of Vermilion | 2008 | $50.443 million (up to 2008)[n 19] | $59.9 million | |
| Bemani | 1997 | 28,500 (up to 2000)[n 35] | $12.4 million (up to 1998) (Japan hardware sales)[n 22] |
$19.7 million (Japan hardware sales) |
| Scramble | 1981 | 27,473 (up to 1981)[68] | ||
| Sega Network Mahjong | 2000 | 25,986 (up to 2006)[n 38] | $81.87 million (up to 2012)[n 39] | $122 million |
| Pole Position | 1982 | 24,550 (in the US up to 1983)[n 40] | $77.9 million (up to 1988) (US hardware sales)[n 41] |
$206 million (US hardware sales) |
| Dig Dug | 1982 | 22,228[73] (in the US up to 1983)[61] | $46.3 million (up to 1983)[73] (US hardware sales) |
$123 million (US hardware sales) |
| Pump It Up | 1999 | 20,000 (up to 2005)[44] | ||
| Breakout | 1976 | 15,805 (up to 1999)[92] | $17.745 million (up to 1999)[92] | $27.2 million |
| Star Wars | 1983 | 14,039 (up to 1991)[73] | $9.275 million (up to 1983)[73] | $17.4 million |
| Sprint | 1976 | 14,027 (up to 1999)[92] | $28.729 million (up to 1999)[92] | $44.1 million |
| Mushiking | 2003 | 13,500 (up to 2005)[69] | $530 million (up to 2007)[n 10] | $737 million |
| Sea Wolf | 1976 | 14,000 (up to 2000)[107] | ||
| Mahjong Fight Club | 2002 | 13,000 (up to 2004)[70] | ||
| Gauntlet | 1985 | 11,368 (up to 1991)[73] | $20.41 million (up to 1991)[73] | $38.3 million |
| Love and Berry | 2004 | 10,300 (up to 2006)[71] | $302.68 million (up to 2007)[n 11] | $410 million |
| Sangokushi Taisen | 2005 | 9,929 (up to 2008)[n 43] | $148.44 million (up to 2012)[n 44] | $194 million |
| Pong | 1972 | 8500–19,000[94][95] | $11 million (up to 1973)[96] | $63.4 million |
| Hang-On | 1985 | 7,500 (up to 1985)[50] | ||
| Initial D Arcade Stage | 2001 | 7,111 (up to 2005)[124] | ||
| Dinosaur King | 2005 | 7,000 (up to 2006)[51] | ||
| Hard Drivin' | 1989 | 6,843 (up to 1991)[73] | $42.93 million (up to 1991)[73] | $75.48 million |
| Xevious | 1982 | 5,295 (in the US up to 1983)[73] | ||
| Samba de Amigo | 1999 | 3,000 (up to 2000)[90] | $47.11 million (up to 2000)[n 45] | $72.3 million |
| Border Break | 2009 | 2,998 (up to 2009)[74] | $107 million (up to 2012)[n 13] | $128 million |
| World Club Champion Football | 2012 | 2,479 (up to 2015)[n 8] | $706.014 million (up to 2012)[n 46] | $1 billion |
See also
Footnotes
- Pac-Man:
- Estimated 10 billion quarters ($2.5 billion) by 1999:
- Chris Morris (10 May 2005). "Pac Man turns 25: A pizza dinner yields a cultural phenomenon – and millions of dollars in quarters". CNN. Archived from the original on 15 May 2011.
In the late 1990s, Twin Galaxies, which tracks video game world record scores, visited used game auctions and counted how many times the average Pac Man machine had been played. Based on those findings and the total number of machines that were manufactured, the organization said it believed the game had been played more than 10 billion times in the 20th century.
- Mark J. P. Wolf (2008). The video game explosion: a history from PONG to Playstation and beyond. ABC-CLIO. p. 73. ISBN 978-0-313-33868-7.
It would go on to become arguably the most famous video game of all time, with the arcade game alone taking in more than a billion dollars, and one study estimated that it had been played more than 10 billion times during the twentieth century.
- Chris Morris (10 May 2005). "Pac Man turns 25: A pizza dinner yields a cultural phenomenon – and millions of dollars in quarters". CNN. Archived from the original on 15 May 2011.
- Estimated 7 billion coins (7 billion quarters / $1.75 billion) by 1982.[22]
- $1 billion cabinet sales by 1982:
- Marlene Targ Brill (2009). America in the 1980s. Twenty-First Century Books. p. 120. ISBN 978-0-8225-7602-0.
- $1 billion revenue in 1980:
- Kline, Stephen; Nick Dyer-Witheford; Greig de Peuter (2003). Digital play: the interaction of technology, culture, and marketing (Reprint ed.). Montréal, Quebec: McGill-Queen's University Press. p. 96. ISBN 0-7735-2591-2.
The game produced one billion dollars in 1980 alone
- Kline, Stephen; Nick Dyer-Witheford; Greig de Peuter (2003). Digital play: the interaction of technology, culture, and marketing (Reprint ed.). Montréal, Quebec: McGill-Queen's University Press. p. 96. ISBN 0-7735-2591-2.
- Estimated 10 billion quarters ($2.5 billion) by 1999:
- Space Invaders:
- $2 billion (4 billion quarters) by 1982: "Making millions, 25 cents at a time". The Fifth Estate. Canadian Broadcasting Corporation. 23 November 1982.
- $1 billion (8 billion quarters) by 1981: Glinert, Ephraim P. (1990). Visual Programming Environments: Applications and Issues. IEEE Computer Society Press. p. 321. ISBN 0-8186-8974-9.
As of mid-1981, according to Steve Bloom, author of Video Invaders, more than four billion quarters had been dropped into Space Invaders games around the world
- $600 million Japan cabinet sales in 1978: "Can Asteroids Conquer Space Invaders?" (PDF). Electronic Games. 1 (1): 30–33 [31]. Winter 1981.
- $102 million US cabinet sales by 1979.[25]
- Street Fighter II:
- Street Fighter II′: Champion Edition: 140,000[26]
- Street Fighter II: The World Warrior: 60,000[27]
- Donkey Kong:
- Japan: 65,000 of Donkey Kong
- Ashcraft, Brian; Snow, Jean (2008). Arcade Mania: The Turbo-charged World of Japan's Game Centers (1st ed.). Tokyo: Kodansha. ISBN 978-4-7700-3078-8.
Jumpman hopped over barrels, climbed ladders, and jumped from suspended platform to suspended platform as he tried to rescue a damsel from his pissed-off pet gorilla. The game was a smash, and sixty-five thousand cabinets were sold in Japan, propping up the then-struggling Nintendo and laying the groundwork for Nintendo and Donkey Kong creator Shigeru Miyamoto to dominate gaming throughout the 1980s and beyond.
- United States: 67,000 of Donkey Kong
- Bienaimé, Pierre (13 January 2012). "Square Roots: Donkey Kong (NES)". Nintendojo. Archived from the original on 1 February 2012.
Donkey Kong sold some 67,000 arcade cabinets in two years, making two of its American distributors sudden millionaires thanks to paid commission. As a barometer of success, know that Pac-Man and Ms. Pac-Man are the only arcade games to have sold over 100,000 units in the United States.
- Bienaimé, Pierre (13 January 2012). "Square Roots: Donkey Kong (NES)". Nintendojo. Archived from the original on 1 February 2012.
- United States: 30,000 of Donkey Kong Jr. and 5000 of Donkey Kong 3.[28]
- Sangokushi Taisen 2:
- Initial D Arcade Stage 4:
- World Club Champion Football: Intercontinental Clubs
- World Club Champion Football series, unit sales:
- World Club Champion Football: European Clubs 2004–2005 – 514 units in fiscal year ending March 2006[49]
- World Club Champion Football: European Clubs 2004–2005 Ver. 2 – 276 units during April–September 2006 (240 satellite units during April–June 2006,[63] and 36 body units during April–September 2006)[51]
- World Club Champion Football: Intercontinental Clubs 2008–2009 – 1,689 units from June 2008 to December 2009[n 7]
- World Club Champion Football: Intercontinental Clubs
- Fiscal year ended 31 March 2010: ¥4.2 billion
- Fiscal year ended 31 March 2011: ¥3.8 billion
- Fiscal year ended 31 March 2012: ¥3.6 billion
- 1st Quarter Ended 30 June 2012: ¥0.5 billion
- Currency conversion:
- ¥4.2 billion = $51.9159 million
- ¥3.8 billion = $46.9716 million
- ¥3.6 billion = $44.8253 million
- ¥0.5 billion = $6.3784 million
- Mushiking:
- 420 million[122] 100 yen coins[123] = ¥42 billion
- Currency conversion: $530 million[66]
- Love and Berry:
- 240 million[122] 100 yen coins[123] = ¥24 billion
- Currency conversion: $302.68 million[66]
- StarHorse3 Season I: A New Legend Begins
- Fiscal year ended March 2012: ¥10.1 billion
- 1st Quarter Ended 30 June 2012: ¥0.5 billion
- Currency conversion:
- ¥10.1 billion = $125.8 million
- ¥0.5 billion = $6.3784 million
- Border Break:
- Fiscal year ended 31 March 2010: ¥3.3 billion[98]
- Fiscal year ended 31 March 2011: ¥2.5 billion[125]
- Fiscal year ended 31 March 2012: ¥2.3 billion[102][126]
- 1st Quarter Ended 30 June 2012: ¥0.5 billion[127]
- Currency conversion:[66]
- ¥3.3 billion = $40.7317 million
- ¥2.5 billion = $30.8542 million
- ¥2.3 billion = $28.6371 million
- ¥0.5 billion = $6.3784 million
- Sengoku Taisen:
- Fiscal year ended 31 March 2011: ¥6.4 billion
- Fiscal year ended 31 March 2012: ¥1.2 billion
- ¥6.4 billion = $79.1 million
- ¥1.2 billion = $14.94 million
- Dragon Quest: Monster Battle Road
- StarHorse2:
- From April 2005 to March 2007: 18,079 units
- StarHorse2: New Generation – 7,819 units from April 2005 to June 2006 (6,020 units in fiscal year ended March 2006,[49] and 1,799 units during April–June 2006)[51]
- StarHorse2: Second Fusion – 10,260 units from April 2006 to March 2007 (8,105 conversion kits during April–December 2006,[71] and 2,155 body and satellite units in fiscal year ending March 2007)[58]
- From April 2007 to March 2008: 10,275 units (756 body and satellite units of StarHorse2: Second Fusion during April–September 2007,[57] and 9,519 conversion kits in fiscal year ended March 2008)[88]
- From April 2009 to December 2009: 10,657 units of StarHorse2: Fifth Expansion[74]
- From April 2005 to March 2007: 18,079 units
- StarHorse2: Fifth Expansion:
- Fiscal year ended 31 March 2010: ¥2.8 billion
- Fiscal year ended 31 March 2011: ¥2 billion
- Currency conversion:
- ¥2.8 billion = $34.6039 million
- ¥2 billion = $24.7171 million
- Sangokushi Taisen 3:
- Fiscal year ended 31 March 2010: ¥1.8 billion
- Fiscal year ended 31 March 2011: ¥2.6 billion
- Currency conversion:
- ¥1.8 billion = $22.2401 million
- ¥2.6 billion = $32.1248 million
- Lord of Vermilion: ¥4 billion[87]
- Currency conversion: $50.443 million[66]
- Fiscal year ended 31 March 2010: ¥3.8 billion[98]
- Currency conversion: $47 million[66]
- Fiscal year ended March 2012: ¥2.8 billion[102]
- Currency conversion: $34.87 million[66]
- Beatmania:
- Pac-Man series:
- Pac-Man series:
- Mario series:
- Donkey Kong series: 167,000[n 4]
- Mario Bros.: 3,800[59]
- Asteroids series:
- Asteroids: 100,000[32]
- Asteroids sequels:[92]
- Asteroids Deluxe: 22,399
- Space Duel: 12,038
- Blasteroids: 2,000
- Asteroids series:
- Asteroids: $800 million in 1991[33]
- Asteroids sequels:
- Asteroids Deluxe: $46.1 million in 1999[92]
- Blasteroids: $4.69 million in 1991[73]
- Defender series:
- Centipede series:[59][73]
- Centipede: 55,988
- Centipede series:[73]
- Centipede: $115.65 million
- Galaxian series:
- Galaxian: 40,000 in the US[39][40]
- Galaga '88: 986 in the US[73]
- StarHorse series:
- Starhorse series, 2009–2011:
- Big Buck series:
- Big Buck Hunter series sales up until April 2007: 22,500 units, including 7,500 Big Buck Hunter Pro units.[100]
- Series sales after April 2007 until September 2009: additional 2,500 Big Buck Hunter Pro units and 5,500 Big Buck Safari units.[99]
- Big Buck Hunter Pro: Open Season sales from September 2009 to January 2010: 3,000 units[103]
- Bemani series, sales:
- Beatmania as of 2000: 25,000[106]
- Dance Dance Revolution in Japan as of May 1999: 3,500[60]
- Sega Network Mahjong MJ2:
- April 2004 to March 2005: 4,984
- April 2005 to June 2005: 502
- Sega Network Mahjong MJ4:
- Fiscal year ended March 2008: 10,427
- Fiscal year ended March 2009: 2,465
- Sega Network Mahjong MJ series:
- Sega Network Mahjong MJ series, 2009–2012:
- Pole Position series US sales:
- Pole Position: 21,000[59]
- Pole Position sequels:[73]
- Pole Position II: 2,400
- Final Lap: 1,150
- Pole Position series US sales:[59][73]
- Pole Position: $60.933 million in 1983
- Pole Position II: $7.43 million in 1983
- Final Lap: $9.5 million in 1988
- Sangokushi Taisen:
- As of March 2005: 421
- April 2005 to March 2006: 1,521
- Sangokushi Taisen series:
- Sales from January 2005 to September 2006: 5,153 units
- Sales from April 2007 to March 2008: 4,776
- Sangokushi Taisen series, 2009–2011:
- Samba de Amigo: ¥3.84 billion
- Currency conversion: $47.11 million[66]
- World Club Champion Football series, revenue:
- Series revenues up until March 2009 – $552.3 million
- 480 million player cards sold. Prices could range from ¥300 for a single card from an arcade machine to ¥1000 for a starter pack.[64] A¥1000 starter pack consists of 11 player cards, equivalent to ¥90.91 each.[65] Total revenues from player card sales thus range from ¥43.64 billion (at ¥90.91 per card) to ¥144 billion (at ¥300 per card). In US dollars, this is equivalent to a range of $552.3 million to $1.82244 billion.[66] The lowest value of $552.3 million will be assumed.
- World Club Champion Football: Intercontinental Clubs revenues from April 2009 to June 2012 – $150.1 million[n 9]
- Series revenues up until March 2009 – $552.3 million
References
- "Why Japan's arcades are its game industry's cutting-edge labs". VentureBeat. 6 December 2016. Retrieved 16 May 2019.
- Kocurek, Carly (2015). Coin-Operated Americans: Rebooting Boyhood at the Video Game Arcade. p. 91. ISBN 9780816691821.
- Kent, Steven L. (2000). The First Quarter: A 25-Year History of Video Games. BWD Press. p. 83. ISBN 0-9704755-0-0.
- June, Laura (16 January 2013). "For Amusement Only: the life and death of the American arcade". The Verge. Retrieved 13 August 2020.
- "Can Lasers Save VIdeo Arcades?". The Philadelphia Inquirer. 3 February 1984.
Last year, arcade game revenues were approximately $5 billion, compared to $8 billion in 1981 and $7 billion in 1982.
- Johnson, Tracy (3 April 1992). "Are Arcades Archaic? Business down, owners add zip and zap to lure players". The Boston Globe. p. 89.
- Shanna Compton (2004). Gamers: writers, artists & programmers on the pleasures of pixels. Soft Skull Press. p. 119. ISBN 1-932360-57-3.
- Jay Carter (July 1993). "Insert Coin Here: Getting a Fighting Chance". Electronic Games.
- "Virtua Racing – Arcade (1992)". 15 Most Influential Games of All Time. GameSpot. 14 March 2001. Archived from the original on 13 December 2011.
- Ashcraft, Brian. "Why Arcades Haven't Died in Japan". Kotaku. Retrieved 16 May 2019.
- Butts, Steve (2003). "Secret Weapon Over Normandy Review". IGN. Archived from the original on 14 February 2007.
- "Genre Definitions". Mobygames. Retrieved 7 October 2014.
- "Joust for Macintosh (1994) – MobyGames". MobyGames. Retrieved 10 December 2017.
- "Digital Eclipse Software, Inc. – MobyGames". MobyGames. Retrieved 10 December 2017.
- [Tricks of the Podcasting Masters p. 38]
- "American Amusement Machine Association". www.gamingregulation.com. Archived from the original on 25 September 2017. Retrieved 10 December 2017.
- "AAMA mission statement". AAMA. 2016.
- Kushner, David (23 September 1999). "Care for a Latte With That, Mr. Nukem?". The New York Times. ISSN 0362-4331. Retrieved 10 December 2017.
- Mark J. P. Wolf (2008). The video game explosion: a history from PONG to Playstation and beyond. ABC-CLIO. p. 275. ISBN 978-0-313-33868-7.
What are the best-selling video games? There are a number of factors to consider when attempting to answer this question. First, there are several different types of video games, which makes comparisons difficult, or perhaps unfair. Arcade games are played for a quarter a play (although some are 50 cents, or even more), while home games are bought outright, and their systems must be purchased as well.
- "CPI Inflation Calculator". Bureau of Labor Statistics. Retrieved 22 February 2012.
- Kao, John J. (1989). Entrepreneurship, creativity & organization: text, cases & readings. Englewood Cliffs, NJ: Prentice Hall. p. 45. ISBN 0-13-283011-6.
Estimates counted 7 billion coins that by 1982 had been inserted into some 400,000 Pac Man machines worldwide, equal to one game of Pac Man for every person on earth. US domestic revenues from games and licensing of the Pac Man image for T-shirts, pop songs, to wastepaper baskets, etc. exceeded $1 billion.
- Kirsh, Steven J. (2013). top-10-biggest-grossing-arcade-games-of-all-time. p. 228. ISBN 978-0-7619-2976-5.
Due to the relative ease of making illegal versions of Capcom's CP System boards, many pirated copies of the arcade game also existed, which would likely boost its revenue number considerably. But for obvious reasons, the actual sum will never be known.
-
- Jiji Gaho Sha, inc. (2003). "Asia Pacific perspectives, Japan". University of Virginia. p. 57.
At that time, a game for use in entertainment arcades was considered a hit if it sold 1000 units; sales of Space Invaders topped 300,000 units in Japan and 60,000 units overseas.
- Dale Peterson (1983). Genesis II, creation and recreation with computers. Reston Publishing. p. 175. ISBN 0-8359-2434-3.
By 1980, some 300,000 Space Invader video arcade games were in use in Japan, and an additional 60,000 in the United States.
- Kohler, Chris (2004). Power-Up: How Japanese Video Games Gave the World an Extra Life. Indianapolis, Ind.: BradyGames. p. "represented+a+significant+portion+of+the+cost" 19. ISBN 0-7440-0424-1.
Within one year of its US release, an additional 60,000 machines had been sold. One arcade owner said of Space Invaders that it was the first arcade game whose intake "represented a significant portion of the cost of [buying] the game in any one week." That is, it was the first video game that paid for itself within about a month.
- Jiji Gaho Sha, inc. (2003). "Asia Pacific perspectives, Japan". University of Virginia. p. 57.
- Horwitz, Jeremy (8 July 2002). "Technology: Mortal Apathy?". The New York Times.
- Ste Curran (2004). Game plan: great designs that changed the face of computer gaming. Rotovision. p. 38. ISBN 2-88046-696-2.
When Street Fighter II′ (pronounced street fighter two dash) was released just a short time later, it sold around 140,000 units, at ¥160.000 (c. US$1300 / £820) each. The figures were beyond massive – they were simply unheard of. Capcom's Titanic wasn't sinking. Anything but. The game was a runaway success in its territory of choice, bringing Western gamers as much joy as it had in the East.
- Steven L. Kent (2001). The Ultimate History of Video Games: The Story behind the Craze that Touched Our Lives and Changed the World. Prima. p. 446. ISBN 9780761536437.
Capcom will not release the final numbers, but some outsiders have estimated that more than 60,000 Street Fighter II arcade machines were sold worldwide.
- Steven L. Kent (2001). The Ultimate History of Video Games: The Story behind the Craze that Touched Our Lives and Changed the World. Prima. p. 352. ISBN 9780761536437.
With more than 60,000 units sold in the United States, Donkey Kong was Nintendo's biggest arcade hit. The arcade industry began its long collapse the year after Donkey Kong was released, and Nintendo's arcade fortunes eroded quickly. Nintendo released Donkey Kong Junior in 1982 and sold only 30,000 machines, 20,000 Popeye machines (also 1982), and a mere 5000 copies of Donkey Kong 3 (1983).
- Jörg Ziesak (2009). Wii Innovate – How Nintendo Created a New Market Through the Strategic Innovation Wii. GRIN Verlag. p. 50. ISBN 978-3640497744.
Donkey Kong was Nintendo's first international smash hit and the main reason behind the company's breakthrough in the Northern American market. In the first year of its publication, it earned Nintendo 180 million US dollars, continuing with a return of 100 million dollars in the second year.
- "Bally Will Quit Making Pinball, Video Machines". Toledo Blade. 11 July 1988. p. 22.
- Mark J. P. Wolf (2001). The medium of the video game. University of Texas Press. p. 44. ISBN 0-292-79150-X.
- Steve L. Kent (2001). The ultimate history of video games: from Pong to Pokémon and beyond : the story behind the craze that touched our lives and changed the world. Prima. p. 132. ISBN 0-7615-3643-4.
Atari sold more than 70,000 Asteroids machines in the United States. The game did not do as well in Europe and Asia, however. Only about 30,000 units were sold overseas.
- Gottschalk, S. (1995). "Videology: Video-Games as Postmodern Sites/Sights of Ideological Reproduction". Symbolic Interaction. 18 (1): 1–18. doi:10.1525/si.1995.18.1.1.
- "Forbes, Volume 127". Forbes: 102. 1981.
At $2000 a unit, Atari has made about $140 million from that game alone.
- Sellers, John (2001). Arcade fever: the fan's guide to the golden age of video games. Philadelphia: Running Press. p. 51. ISBN 0-7624-0937-1.
Williams sold around 60,000 units of Defender, easily the company's most successful game.
- Steven L. Kent (2001). The Ultimate History of Video Games: The Story behind the Craze that Touched Our Lives and Changed the World. Prima. p. 147. ISBN 9780761536437.
Defender was Williams Electronics' biggest seller. More than 55,000 units were placed worldwide.
- Morrison, Michael (2002). Sams teach yourself game programming in 24 hours (1. printing. ed.). Indianapolis, IN: Sams Publishing. p. 2. ISBN 0-672-32461-X.
- Mark J. P. Wolf (2008). The video game explosion: a history from PONG to Playstation and beyond. ABC-CLIO. p. 104. ISBN 978-0-313-33868-7.
- "MIDWAY MFG. CO. v. ARTIC INTERN". 10 March 1982. Archived from the original on 15 May 2012.
- Bureau of National Affairs (1983). "United States Patents Quarterly, Volume 216". United States Patents Quarterly. Associated Industry Publications.
Since February 1980, Midway has sold in excess of 40,000 Galaxian games
- Donkey Kong:
- Japan: 65,000 of Donkey Kong
- Brian Ashcraft; with Jean Snow; forewords by Kevin Williams; Crecente, Brian (2008). "sixty-five+thousand" Arcade Mania: The Turbo-charged World of Japan's Game Centers (1st ed.). Tokyo: Kodansha. ISBN 978-4-7700-3078-8.
Jumpman hopped over barrels, climbed ladders, and jumped from suspended platform to suspended platform as he tried to rescue a damsel from his pissed-off pet gorilla. The game was a smash, and sixty-five thousand cabinets were sold in Japan, propping up the then-struggling Nintendo and laying the groundwork for Nintendo and Donkey Kong creator Shigeru Miyamoto to dominate gaming throughout the 1980s and beyond.
- Brian Ashcraft; with Jean Snow; forewords by Kevin Williams; Crecente, Brian (2008). "sixty-five+thousand" Arcade Mania: The Turbo-charged World of Japan's Game Centers (1st ed.). Tokyo: Kodansha. ISBN 978-4-7700-3078-8.
- United States: 67,000 of Donkey Kong
- Bienaimé, Pierre (13 January 2012). "Square Roots: Donkey Kong (NES)". Nintendojo. Archived from the original on 1 February 2012.
Donkey Kong sold some 67,000 arcade cabinets in two years, making two of its American distributors sudden millionaires thanks to paid commission. As a barometer of success, know that Pac-Man and Ms. Pac-Man are the only arcade games to have sold over 100,000 units in the United States.
- Bienaimé, Pierre (13 January 2012). "Square Roots: Donkey Kong (NES)". Nintendojo. Archived from the original on 1 February 2012.
- United States: 30,000 of Donkey Kong Jr. and 5000 of Donkey Kong 3.[28]
- Japan: 65,000 of Donkey Kong
- Steve L. Kent (2001). The ultimate history of video games: from Pong to Pokémon and beyond : the story behind the craze that touched our lives and changed the world. Prima. p. 352. ISBN 0-7615-3643-4.
In 1982, Universal Sales made arcade history with a game called Mr Do! Instead of selling dedicated Mr Do! machines, Universal sold the game as a kit. The kit came with a customized control panel, a computer board with Mr Do! read-only memory (ROM) chips, stickers that could be placed on the side of stand-up arcade machines for art, and a plastic marquee. It was the first game ever sold as a conversion only. According to former Universal Sales western regional sales manager Joe Morici, the company sold approximately 30,000 copies of the game in the United States alone.
- Out Run: ZX Spectrum Instructions. U.S. Gold. 1987.
- "Pump It Up: Exceed drops to PS2 / Xbox". Punch Jump Crew. 8 September 2005.
- "'NBA Jam' Rigged Against The Chicago Bulls According To Pistons Fan/Lead Designer, Mark Turmell". The Huffington Post. 26 September 2013. Retrieved 8 January 2018.
- "Computerandvideogames.com". Computerandvideogames.com. Retrieved 8 January 2018.
- "Gun Fight arcade video game by Midway Mfg. (1975)". www.arcade-history.com.
- Steven L. Kent (2001). The Ultimate History of Video Games: The Story behind the Craze that Touched Our Lives and Changed the World. Prima. p. 91. ISBN 9780761536437.
According to Kauffman, Exidy sold only 1,000 Death Race machines, just a fraction of the number of Sea Wolf and Gun Fight machines Midway placed that same year, but Death Race stirred up protests and was even discussed on CBS's 60 Minutes.
- "FY Ending March 2006: Full Year Results Presentation" (PDF). Sega Sammy Holdings. 16 May 2006. p. 11.
- "Motorcycle game to Atari". NewsBytes. 1 October 1985. Archived from the original on 5 January 2009.
So far, Sega has shipped approx. 7,000 Hang-ons to the Japanese and overseas market. ATARI IRELAND gets 500 sets for the initial shipment, a report says.
- "FY 2007: Interim Results (April–September 2006)" (PDF). Sega Sammy Holdings. 10 November 2006. pp. 11–13.
- "Wheels arcade video game by Midway Mfg. (1975)". www.arcade-history.com.
- Keith Smith (30 August 2012). "Allincolorforaquarter.blogspot.co.uk". Allincolorforaquarter.blogspot.co.uk. Retrieved 8 January 2018.
- "FY2004 Financial Results (for the year ended March 31, 2005)" (PDF). Tokyo: Sega Sammy Holdings. 25 May 2005. p. 11.
- "FY2005 1Q Results: Amusement Machine Sales" (PDF). FY2005 1Q Business Results (April–June 2005). Sega Sammy Holdings. 4 August 2005. p. 6.
- Sega Network Mahjong MJ2:
- "Fiscal Year 2008: Interim Results" (PDF). Sega Sammy Holdings. 12 November 2007. p. 11.
- "Fiscal Year Ended March 2007: Full Year Results" (PDF). Sega Sammy Holdings. 14 May 2007. p. 11.
- Fujihara, Mary (2 November 1983). "Inter Office Memo". Atari.
- ("Special Feature: Music Simulation Games Rock the Market". Annual Report. Konami. 1999. p. 2. Archived from the original on 25 June 2004.)
- Fujihara, Mary (25 July 1983). "Inter Office Memo". Atari.
- "First Half Business Results (April–September 2004)" (PDF). Sega Sammy Holdings. 11 November 2004. p. 4.
- "Segment Results: Amusement Machines" (PDF). FY 2007: 1st Quarter Results (April–June 2006). Sega Sammy Holdings. 28 July 2006. p. 10.
- "AOU 2009 – Sega World Club Champion Football Intercontinental Clubs 2007–2008". AOU Amusement Expo 2009. DigInfo TV. 2 March 2009. Archived from the original on 23 August 2012.
- "Sports Gaming in Japan: World Club Champion Football". GameSpot. 22 September 2009. Archived from the original on 3 February 2013.
- "Currency Conversion". XE.com. Retrieved 13 April 2012.
- World Club Champion Football series, revenue:
- Series revenues up until March 2009 – $552.3 million
- 480 million player cards sold. Prices could range from ¥300 for a single card from an arcade machine to ¥1000 for a starter pack.[64] A¥1000 starter pack consists of 11 player cards, equivalent to ¥90.91 each.[65] Total revenues from player card sales thus range from ¥43.64 billion (at ¥90.91 per card) to ¥144 billion (at ¥300 per card). In US dollars, this is equivalent to a range of $552.3 million to $1.82244 billion.[66] The lowest value of $552.3 million will be assumed.
- World Club Champion Football: Intercontinental Clubs revenues from April 2009 to June 2012 – $150.1 million[n 9]
- Series revenues up until March 2009 – $552.3 million
- "Stern Production Numbers and More CCI Photos". 1 May 2012.
- "FY Ending March 2006: Interim Results Presentation (April–September 2005)" (PDF). Sega Sammy Holdings. 22 November 2005.
- "FY2005 Third quarter Financial Results (April–December 2004)" (PDF). Konami. 27 January 2005. p. 15. Archived from the original (PDF) on 16 January 2006.
- "Fiscal Year Ending March 2007: 3rd Quarter Results (April–December 2006)" (PDF). Sega Sammy Holdings. 7 February 2007. pp. 11–13.
- "Fiscal Year Ending March 2006: 3rd quarter Results (April–December 2005)" (PDF). Sega Sammy Holdings. 8 February 2006. p. 8.
- "Atari Production Numbers Memo". Atari Games. 4 January 2010. Archived from the original on 20 January 2013.
- "Appendix of Consolidated Financial Statements: 9 Months Ended December 31, 2009" (PDF). Sega Sammy Holdings. 5 February 2010. p. 3.
- Sangokushi Taisen:
- "Segment Results: Amusement Machine" (PDF). Fiscal Year 2009: Full Year Results (Ending March 2009). Sega Sammy Holdings. 14 May 2009. p. 15.
- Steve L. Kent (2001). The ultimate history of video games: from Pong to Pokémon and beyond : the story behind the craze that touched our lives and changed the world. Prima. p. 225. ISBN 0-7615-3643-4.
Cinematronics sold more than 16,000 Dragon's Lair machines in 1983, for an average price of $4300. Coleco purchased the home rights to the game, giving Cinematronics an additional $2 million.
- Harmetz, Aljean (13 August 1983). "Daring Dirk Perk For Arcades". Ottawa Citizen. p. 29.
- "Rick Dyer: Biography". Allgame. Retrieved 10 April 2011.
- "VIDEO ARCADES: HANGOUT CHOICE OF A NEW GENERATION". DeseretNews.com. 12 April 1994. Retrieved 10 December 2017.
- Smith, Keith (22 November 2013). "The Golden Age Arcade Historian: Video Game Firsts??". Allincolorforaquarter.blogspot.co.uk. Retrieved 8 January 2018.
- "Amusement Machine: 3Q Principle Titles" (PDF). Fiscal Year Ending March 2006: 3rd Quarter Appendix (April–December 2005). Sega Sammy Holdings. 8 February 2006. p. 4.
- Radar Scope at the Killer List of Videogames
- Harmetz, Aljean (3 July 1982). "Movie Themes Come To Video Games". Star-News.
- Jack B. Rochester; John Gantz (1983). The naked computer: a layperson's almanac of computer lore, wizardry, personalities, memorabilia, world records, mind blowers, and tomfoolery. William Morrow and Company. p. 164. ISBN 0-688-02450-5.
Although the Disney Studios expected to make over $400 million from this siliconic extravaganza, our source at Variety tells us that its North American rentals were $15 million and estimated total gross, $30 million. The arcade game Tron, made by Bally, grossed more.
- "Outline of Results Briefing" (PDF). Square Enix. 23 May 2008. p. 4.
- "Outline of Results Briefing by SQUARE ENIX HOLDINGS held on November 7, 2008" (PDF). Square-Enix.com. Retrieved 20 December 2008.
- "Segment Results: Amusement Machines" (PDF). FY 2008: Full Year Results (Ending March 2008). Sega Sammy Holdings. 15 May 2008. p. 13.
- Steve L. Kent (2001). The ultimate history of video games: from Pong to Pokémon and beyond : the story behind the craze that touched our lives and changed the world. Prima. p. 224. ISBN 0-7615-3643-4.
Gottlieb sold approximately 25,000 Q*Bert arcade machines.
- "Japanese gamers shake it, shake it!". South Africa: Independent Online (South Africa). 14 August 2000.
- Samba de Amigo: ¥3.84 billion
- Currency conversion: $47.11 million[66]
- "Production Numbers" (PDF). Atari. 1999.
- Fulton, Jeff (2010). "A short history of Missile Command". The essential guide to Flash games : building interactive entertainment with ActionScript 3.0 (New ed.). [Berkeley, Calif.]: Friends of ED. p. 138. ISBN 978-1-4302-2614-7.
While certainly not the size of Asteroids, the game was still a huge hit with almost 20,000 units sold.
- "Business 1974: Industry: Space Age Pinball, Atari's PONG". Time. 5 October 1983.
Typical of the new games is Pong, a popular version of electronic table tennis manufactured by two-year-old Atari, Inc. (estimated fiscal 1974 revenue: $14 million) of Los Gatos, Calif. Atari sold some 8,500 games to U.S. amusement parlors and other businesses last year.
- Ashley S. Lipson; Robert D. Brain (2009). Computer and Video Game Law: Cases and Materials. Carolina Academic Press. p. 9. ISBN 978-1-59460-488-1.
Atari eventually sold more than 19,000 Pong machines, giving rise to many imitations. Pong made its first appearance in 1972 at "Andy Capp's," a small bar in Sunnyvale, California, where the video game was literally "overplayed" as eager customers tried to cram quarters into an already heavily overloaded coin slot.
- Barack, Lauren (8 May 2003). "In Blast From the Past, Atari Video Games Plan a Return". New York Post. p. 34. Archived from the original on 12 May 2012.
Its first hit game, "Pong," launched in 1972, made $11 million in revenue in just one year.
- Sega Network Mahjong MJ4:
- "Big Buck Safari® Reaches Two Milestones!". Raw Thrills. 1 September 2009.
- Strang, Katie (24 April 2007). "Shootout at the local pub: Big Buck Hunter is a hit". The Arizona Republic.
- "Entering The Snakepit – A Winner". NewsBytes. 20 December 1983. Archived from the original on 25 February 2009.
- Shaggy (7 January 2010). "Big Buck Hunter Open Season pushes 3000 units in 90 days". Arcade Heroes.
- Shaggy (11 February 2010). "Silver Strike LIVE starts shipping next week". Arcade Heroes.
- "Operator bowled over by H2Overdrive". Namco Bandai Games. 5 March 2010. Archived from the original on 25 May 2013.
- Beals, Gregory (11 December 2000). "Kings of Cool". Newsweek.
Konami has sold 25,000 Beatmania machines in three years. In the arcade industry, selling 1000 units is considered a success.
- Steven L. Kent (2000). The first quarter: a 25-year history of video games. BWD Press. p. 83. ISBN 0-9704755-0-0.
Sea Wolf, which was another creation of Dave Nutting, did solid business, selling more than 10,000 machines.
- Orland, Kyle (4 March 2011). "GDC 2011: Mark Cerny Discusses Marble Madness' Turbulent Development". Gamasutra. Archived from the original on 20 March 2011.
- Steven L. Kent (2000). The first quarter: a 25-year history of video games. BWD Press. p. 83. ISBN 0-9704755-0-0.
- Shaggy (3 May 2010). "Initial sales numbers for Terminator Salvation arcade". Arcade Heroes.
- Shaggy (10 June 2009). "Betson: 2000 Guitar Hero units have been sold in three months". Arcade Heroes.
- Buchanan, Levi (28 August 2008). The Revolution of I, Robot, IGN.
- "Atari: From Starting Block To Auction Block". InfoWorld. InfoWorld Media Group. 6 (32): 52. 6 August 1984. ISSN 0199-6649.
- Modine, Austin (13 December 2008). "Before Pong, there was Computer Space". The Register.
- Ms. Pac-Man revenue: 125,000 units, $2800 each
- "Call-it Entertainment, Inc. Partners with Capcom to Launch Street Fighter Wireless Game Series". Business Wire. 16 May 2002. Archived from the original on 24 June 2002.
- Guinness World Records Gamer's Edition 2008. Guinness World Records Gamer's Edition. Guinness World Records. 2008. p. 77. ISBN 978-1-904994-21-3.
Street Fighter has sold over 25 million console games and 500,000 arcade units generating more than a billion dollars in revenue.
- Space Invaders:
- $2 billion (4 billion quarters) by 1982: "Making millions, 25 cents at a time". The Fifth Estate. Canadian Broadcasting Corporation. 23 November 1982.
- $1 billion (8 billion quarters) by 1981: Glinert, Ephraim P. (1990). Visual Programming Environments: Applications and Issues. IEEE Computer Society Press. p. 321. ISBN 0-8186-8974-9.
As of mid-1981, according to Steve Bloom, author of Video Invaders, more than four billion quarters had been dropped into Space Invaders games around the world
- $600 million Japan cabinet sales in 1978: "Can Asteroids Conquer Space Invaders?" (PDF). Electronic Games. 1 (1): 30–33 [31]. Winter 1981.
- $102 million US cabinet sales by 1979.[25]
- Leonard Herman; Jer Horwitz; Steve Kent; Skyler Miller (2002). "The History of Video Games" (PDF). GameSpot. p. 7. Archived from the original (PDF) on 25 April 2012.
- "What is Golden Tee?". Incredible Technologies. Archived from the original on 11 January 2013.
- Sickinger, Ted (6 November 1995). "The year of Mortal Kombat". The Kansas City Star. p. 1.
More than 1 billion quarters have dropped through its slots since 1992. The first two home versions sold more than 10 million copies at $50 and $60 apiece.
- Initial D series:
- Initial D Arcade Stage: 2,534 units from April 2004 to September 2004[62]
- Initial D Arcade Stage Ver. 3: 673 units from April 2004 to March 2005[54]
- Initial D Arcade Stage 4: 3,904 units from April 2006 to September 2007[n 6]
External links
| Wikimedia Commons has media related to Arcade games. |
- The Video Arcade Preservation Society
- Online collection of Automatic Age trade journals, 1925–1945
- System 16 – The Arcade Museum
- Arcade History (Coin-Op Database)
- The Museum of Soviet Arcade Games (blog article)
- Gaming Cabinet (blog article)
- Mobile Gaming Arcade (blog article)