2010 Crimean parliamentary election
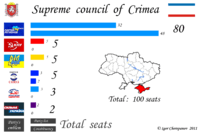
The 2010 Crimean parliamentary election were held on 31 October 2010 as a part of the general 2010 Ukrainian local elections. Unlike the previous election to the Verkhovna Rada of Crimea, they were conducted on the mixed member proportional representation system. In order to gain representation in the Parliament of the Autonomous Republic of Crimea, a party or bloc had to garner at least 3 percent of the total vote. The Party of Regions won the elections with an overwhelming majority.[1]
| |||||||||||||||||||
All 100 seats to the Verkhovna Rada of Crimea | |||||||||||||||||||
|---|---|---|---|---|---|---|---|---|---|---|---|---|---|---|---|---|---|---|---|
| |||||||||||||||||||
 | |||||||||||||||||||
| This article is part of a series on the politics and government of Crimea |
 |
|
Republic of Crimea (within Russia) since 2014
Autonomous Republic of Crimea (within Ukraine) |
| See also |
|
Political status of Crimea Politics of Russia Politics of Ukraine |
|
|
Background
Prior to 2009 amendments to the Crimean Constitution, the parliament's term was limited to four years. It has since been increased to five after Ukrainian President Viktor Yushchenko signed the amendments into law in April 2009.[2]
New elections where set for October 31, 2010 by the Supreme Council on August 4, 2010. In June 2010 the parliament had failed to fix the election date on October 31. The resolution was voted against by a number of coalition factions, including the ruling For Yanukovych! electoral bloc (that included the Party of Regions).[3] Early July 2010, the Verkhovna Rada (Ukraine's national parliament) supported by the Party of Regions’ initiative, announced local elections on the last day of October 2010.[3]
Results
| Parties | Party list votes | Party list % | Swing (party list) % | Mandates won on party list | Constituencies won | Swing (in mandates) |
|---|---|---|---|---|---|---|
| Party of Regions | 357030 | 48,93% | +19,54% | 32 | 48 | +4 |
| Communist Party of Ukraine | 54172 | 7,42% | +1,15% | 5 | -4 | |
| Qurultai-Rukh | 51253 | 7,02% | +0,47% | 5 | -3 | |
| Soyuz | 38514 | 5,28% | -1,47% | 3 | 2 | -5 |
| Russian Unity | 29343 | 4,02% | 3 | |||
| Strong Ukraine | 26515 | 3,63% | 2 | |||
| People's Party | 4563 | 0,63% | ||||
| Progressive Socialist Party of Ukraine | 12614 | 1,73% | -7 | |||
| Party of Pensioners of Ukraine | 11133 | 1,53% | ||||
| Batkivschyna | 19589 | 2,68% | -3,62 | -8 | ||
| Front for Change | 8281 | 1,13% | ||||
| Svoboda | 1361 | 0,19% | ||||
| Against all Invalid ballots | 57552 | 7.89% | ||||
| Invalid ballots | 21794 | -1.43% | ||||
| Total | 997,575 | 100% | 50 | 50 |
References
- Local government elections in Ukraine: last stage in the Party of Regions’ takeover of power Archived August 13, 2011, at the Wayback Machine, Centre for Eastern Studies (October 4, 2010)
- "Yushchenko signed a law increasing the legislative term of the Crimean parliament" (in Ukrainian). Korrespondent.net. April 5, 2009. Retrieved 2009-04-06.
- Ukraine’s Crimea to hold parliamentary elections on October 31, ITAR-TASS (August 4, 2010)
- Regions Party gets 80 of 100 seats on Crimean parliament, Interfax Ukraine (11 November 2010)
