1992 United States presidential election in Arizona
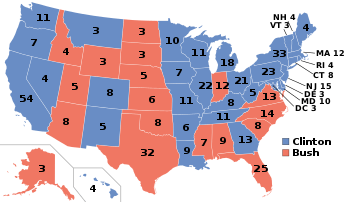
The 1992 United States presidential election in Arizona took place on November 3, 1992, as part of the 1992 United States presidential election. Voters chose eight representatives, or electors to the Electoral College, who voted for president and vice president.
| |||||||||||||||||||||||||||||||||
| |||||||||||||||||||||||||||||||||
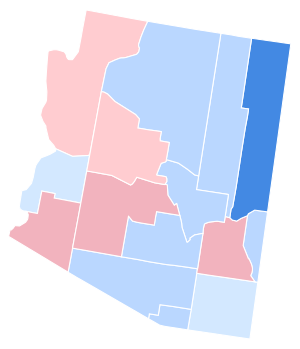
 County Results
| |||||||||||||||||||||||||||||||||
| |||||||||||||||||||||||||||||||||
| Elections in Arizona | ||||||||||
|---|---|---|---|---|---|---|---|---|---|---|
 | ||||||||||
|
||||||||||
|
||||||||||
|
||||||||||
|
|
||||||||||
Arizona was won by incumbent President George H. W. Bush (R-Texas) with 38.47% of the popular vote over Governor Bill Clinton (D-Arkansas) with 36.52%. Businessman Ross Perot (I-Texas) finished in third, with 23.79% of the popular vote.[1] Clinton ultimately won the national vote, defeating incumbent President Bush. Bush very narrowly won in Arizona by a margin of 1.95%, and Clinton went on to win the state four years later narrowly over Bob Dole.[2]
In achieving the best performance by a Democrat in Arizona since Lyndon Johnson's landslide in 1964 – when Barry Goldwater held the state by five thousand votes due to a "favorite son" vote in the Phoenix metropolitan area – Clinton broke some notable county droughts. He placed Cochise County in the Democratic camp for the first time since 1964 and last to date,[3] Pima County and Santa Cruz County also voted Democratic for the first time since 1964, whilst Flagstaff's Coconino County voted Democratic for the first time since Harry S. Truman carried it in 1948. These three counties have since stayed reliably Democratic in presidential elections.[4]
Results
| 1992 United States presidential election in Arizona[1] | |||||
|---|---|---|---|---|---|
| Party | Candidate | Votes | Percentage | Electoral votes | |
| Republican | George H. W. Bush (incumbent) | 572,086 | 38.47% | 8 | |
| Democratic | Bill Clinton | 543,050 | 36.52% | 0 | |
| Independent | Ross Perot | 353,741 | 23.79% | 0 | |
| America First | James "Bo" Gritz | 8,141 | 0.55% | 0 | |
| Libertarian | Andre Marrou | 6,759 | 0.45% | 0 | |
| Natural Law | Dr. John Hagelin | 2,277 | 0.15% | 0 | |
| New Alliance Party | Lenora Fulani | 917 | 0.06% | 0 | |
| Democrats for Economic Recovery | Lyndon LaRouche (write-in) | 8 | >0.01% | 0 | |
| Totals | 1,486,975 | 100.0% | 8 | ||
Results by county
| County | George Herbert Walker Bush Republican |
William Jefferson Clinton Democratic |
Henry Ross Perot Reform |
Andre Verne Marrou Libertarian |
Various candidates Other parties |
Margin | Total votes cast | ||||||
|---|---|---|---|---|---|---|---|---|---|---|---|---|---|
| # | % | # | % | # | % | # | % | # | % | # | % | ||
| Apache | 4,588 | 25.13% | 11,218 | 61.44% | 1,979 | 10.84% | 94 | 0.51% | 379 | 2.08% | -6,630 | -36.31% | 18,258 |
| Cochise | 12,202 | 36.81% | 12,701 | 38.31% | 7,857 | 23.70% | 149 | 0.45% | 241 | 0.73% | -499 | -1.51% | 33,150 |
| Coconino | 13,769 | 32.31% | 18,888 | 44.32% | 9,363 | 21.97% | 273 | 0.64% | 325 | 0.76% | -5,119 | -12.01% | 42,618 |
| Gila | 5,781 | 31.29% | 7,571 | 40.97% | 4,694 | 25.40% | 98 | 0.53% | 334 | 1.80% | -1,790 | -9.69% | 18,478 |
| Graham | 4,169 | 42.98% | 3,391 | 34.96% | 1,860 | 19.18% | 29 | 0.30% | 250 | 2.58% | 778 | 8.02% | 9,699 |
| Greenlee | 1,451 | 36.34% | 1,695 | 42.45% | 794 | 19.88% | 4 | 0.10% | 49 | 1.23% | -244 | -6.11% | 3,993 |
| La Paz | 1,599 | 32.23% | 1,808 | 36.44% | 1,488 | 29.99% | 31 | 0.63% | 35 | 0.71% | -209 | -4.21% | 4,961 |
| Maricopa | 360,049 | 41.06% | 285,457 | 32.56% | 221,475 | 25.26% | 3,742 | 0.43% | 6,109 | 0.70% | 74,592 | 8.51% | 876,832 |
| Mohave | 13,684 | 33.69% | 13,255 | 32.63% | 12,706 | 31.28% | 280 | 0.69% | 691 | 1.70% | 429 | 1.06% | 40,616 |
| Navajo | 7,994 | 32.45% | 10,882 | 44.17% | 4,787 | 19.43% | 139 | 0.56% | 836 | 3.39% | -2,888 | -11.72% | 24,638 |
| Pima | 97,036 | 34.47% | 128,569 | 45.68% | 53,925 | 19.16% | 1,268 | 0.45% | 686 | 0.24% | -31,533 | -11.20% | 281,484 |
| Pinal | 11,669 | 31.76% | 15,468 | 42.10% | 9,231 | 25.13% | 136 | 0.37% | 235 | 0.64% | -3,799 | -10.34% | 36,739 |
| Santa Cruz | 3,024 | 37.43% | 3,512 | 43.47% | 1,447 | 17.91% | 46 | 0.57% | 51 | 0.63% | -488 | -6.04% | 8,080 |
| Yavapai | 23,419 | 39.42% | 18,268 | 30.75% | 16,409 | 27.62% | 322 | 0.54% | 997 | 1.68% | 5,151 | 8.67% | 59,415 |
| Yuma | 11,652 | 41.55% | 10,367 | 36.97% | 5,726 | 20.42% | 148 | 0.53% | 152 | 0.54% | 1,285 | 4.58% | 28,045 |
| Totals | 572,086 | 38.47% | 543,050 | 36.52% | 353,741 | 23.79% | 6,759 | 0.45% | 11,370 | 0.76% | 29,036 | 1.95% | 1,487,006 |
References
- "State of Arizona Official Canvass - General Election - November 3, 1992" (PDF). Arizona Office of the Secretary of State. Archived from the original (PDF) on March 14, 2009. Retrieved 8 June 2012.
- "1992 Presidential General Election Results". U.S. Election Atlas. Retrieved 8 June 2012.
- Sullivan, Robert David; ‘How the Red and Blue Map Evolved Over the Past Century’; America Magazine in The National Catholic Review; June 29, 2016
- Menendez, Albert J.; The Geography of Presidential Elections in the United States, 1868-2004, p. 148 ISBN 0786422173
.jpg)


