1980 Wigan Metropolitan Borough Council election
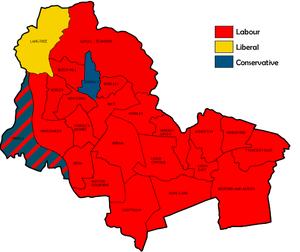
'All-out' elections to the Wigan Council were held on 1 May 1980, following extensive boundary changes and entirely new wards, yet retaining the number of 24 wards with three seats each for a total of 72 seats. The results were comparable to the 1973 election (also an election where all 72 seats were up for vote), with Labour rewarded a crushing majority in seats for approaching 60% of the vote with their main competitors, the Conservatives, falling to under 30%. The Liberals seen their highest representation yet by way of winning all three seats in Langtree.
A former Labour councillor who'd represented the just-abolished ward 19 (encompassing central/north Hindley) since the council's creation fought the Hindley ward as an Independent Labour. Overall turnout fell to the slightly higher than usual number of 36.2% from the general election turnout of 75.7% last year, with all wards recording at least one competitor - although that meant in a number of wards Labour were unopposed for one or two of the seats.[1]
Election result
| Party | Seats | Gains | Losses | Net gain/loss | Seats % | Votes % | Votes | +/− | |
|---|---|---|---|---|---|---|---|---|---|
| Labour | 64 | 0 | 0 | 0 | 88.9 | 55.7 | 48,775 | +3.5% | |
| Conservative | 5 | 0 | 0 | 0 | 6.9 | 29.0 | 23,954 | -8.9% | |
| Liberal | 3 | 0 | 0 | 0 | 4.2 | 6.8 | 5,634 | +1.8% | |
| Residents | 0 | 0 | 0 | 0 | 0.0 | 3.0 | 2,498 | +1.7% | |
| Independent Labour | 0 | 0 | 0 | 0 | 0.0 | 1.5 | 1,265 | +1.5% | |
| Communist | 0 | 0 | 0 | 0 | 0.0 | 0.2 | 159 | +0.1% | |
| Independent | 0 | 0 | 0 | 0 | 0.0 | 0.2 | 149 | +0.2% | |
This result had the following consequences for the total number of seats on the Council after the elections:
| Party | Previous council | New council | |||
|---|---|---|---|---|---|
| Labour | 56 | 64 | |||
| Conservatives | 14 | 5 | |||
| Liberals | 1 | 3 | |||
| Independent | 1 | 0 | |||
| Total | 72 | 72 | |||
| Working majority | 40 | 56 | |||
Ward results
| Party | Candidate | Votes | % | ± | |
|---|---|---|---|---|---|
| Labour | A. Bennett | 2,125 | 74.0 | N/A | |
| Labour | N. Cumberbatch | 2,028 | |||
| Labour | A. Miller | 2,002 | |||
| Conservative | M. Jones | 747 | 26.0 | N/A | |
| Majority | 1,378 | 48.0 | N/A | ||
| Turnout | 2,872 | 28.1 | N/A | ||
| Labour win (new seat) | |||||
| Labour win (new seat) | |||||
| Labour win (new seat) | |||||
| Party | Candidate | Votes | % | ± | |
|---|---|---|---|---|---|
| Labour | T. Jones | 2,054 | 69.2 | N/A | |
| Labour | J. Hilton | 2,042 | |||
| Labour | R. McEntegart | 2,008 | |||
| Conservative | W. Corless | 915 | 30.8 | N/A | |
| Conservative | M. Gambles | 855 | |||
| Majority | 1,139 | 38.4 | N/A | ||
| Turnout | 2,969 | 31.6 | N/A | ||
| Labour win (new seat) | |||||
| Labour win (new seat) | |||||
| Labour win (new seat) | |||||
| Party | Candidate | Votes | % | ± | |
|---|---|---|---|---|---|
| Labour | A. Singer | 2,188 | 47.0 | N/A | |
| Labour | W. Mason | 2,055 | |||
| Labour | A. Hitchmough | 1,934 | |||
| Conservative | J. Wild | 1,575 | 33.8 | N/A | |
| Conservative | E. Slevin | 1,390 | |||
| Conservative | J. Holland | 1,375 | |||
| Liberal | M. Rutherford | 893 | 19.2 | ||
| Liberal | J. Leeuwangh | 758 | |||
| Liberal | P. Knowles | 723 | |||
| Majority | 613 | 13.2 | N/A | ||
| Turnout | 4,656 | 46.5 | N/A | ||
| Labour win (new seat) | |||||
| Labour win (new seat) | |||||
| Labour win (new seat) | |||||
| Party | Candidate | Votes | % | ± | |
|---|---|---|---|---|---|
| Labour | J. Clarke | 2,866 | 76.9 | N/A | |
| Labour | J. Sumner | 2,791 | |||
| Labour | L. Sumner | 2,601 | |||
| Conservative | M. Sharland | 862 | 23.1 | N/A | |
| Conservative | B. France | 752 | |||
| Majority | 2,004 | 53.8 | N/A | ||
| Turnout | 3,728 | 38.8 | N/A | ||
| Labour win (new seat) | |||||
| Labour win (new seat) | |||||
| Labour win (new seat) | |||||
| Party | Candidate | Votes | % | ± | |
|---|---|---|---|---|---|
| Labour | J. Jones | 2,342 | 57.5 | N/A | |
| Labour | H. Hayes | 2,226 | |||
| Labour | J. Prytharch | 2,165 | |||
| Conservative | S. Johnson | 1,728 | 42.5 | N/A | |
| Conservative | C. Hampson | 1,539 | |||
| Conservative | S. Emerton | 1,510 | |||
| Majority | 614 | 15.1 | N/A | ||
| Turnout | 4,070 | 41.6 | N/A | ||
| Labour win (new seat) | |||||
| Labour win (new seat) | |||||
| Labour win (new seat) | |||||
| Party | Candidate | Votes | % | ± | |
|---|---|---|---|---|---|
| Labour | T. Bishop | 2,134 | 73.9 | N/A | |
| Labour | J. Maloney | 1,960 | |||
| Labour | G. Pullin | 1,955 | |||
| Conservative | A. Atherton | 754 | 26.1 | N/A | |
| Conservative | J. Lawson | 727 | |||
| Conservative | J. Wilkinson | 653 | |||
| Majority | 1,380 | 47.8 | N/A | ||
| Turnout | 2,888 | 32.3 | N/A | ||
| Labour win (new seat) | |||||
| Labour win (new seat) | |||||
| Labour win (new seat) | |||||
| Party | Candidate | Votes | % | ± | |
|---|---|---|---|---|---|
| Labour | G. Lockett | 2,028 | 74.6 | N/A | |
| Labour | A. Heckles | 1,820 | |||
| Labour | R. Lyons | 1,800 | |||
| Conservative | D. Gambles | 691 | 25.4 | N/A | |
| Conservative | C. Michaels | 635 | |||
| Majority | 1,337 | 49.2 | N/A | ||
| Turnout | 2,719 | 29.0 | N/A | ||
| Labour win (new seat) | |||||
| Labour win (new seat) | |||||
| Labour win (new seat) | |||||
| Party | Candidate | Votes | % | ± | |
|---|---|---|---|---|---|
| Labour | A. Robinson | 1,799 | 48.2 | N/A | |
| Labour | T. Isherwood | 1,725 | |||
| Labour | J. Bray | 1,382 | |||
| Independent Labour | C. Priestley | 1,265 | 33.9 | N/A | |
| Conservative | T. Sharples | 667 | 17.9 | N/A | |
| Majority | 534 | 14.3 | N/A | ||
| Turnout | 3,731 | 39.7 | N/A | ||
| Labour win (new seat) | |||||
| Labour win (new seat) | |||||
| Labour win (new seat) | |||||
| Party | Candidate | Votes | % | ± | |
|---|---|---|---|---|---|
| Labour | G. Harrison | 1,665 | 66.3 | N/A | |
| Labour | R. McAllister | 1,552 | |||
| Labour | T. Wynn | 1,474 | |||
| Residents | J. Venables | 846 | 33.7 | N/A | |
| Majority | 819 | 32.6 | N/A | ||
| Turnout | 2,511 | 23.8 | N/A | ||
| Labour win (new seat) | |||||
| Labour win (new seat) | |||||
| Labour win (new seat) | |||||
| Party | Candidate | Votes | % | ± | |
|---|---|---|---|---|---|
| Labour | M. Devlin | 2,473 | 68.7 | N/A | |
| Labour | S. Little | 2,426 | |||
| Labour | A. Wright | 2,392 | |||
| Conservative | E. Valentine | 1,128 | 31.3 | N/A | |
| Conservative | H. Davies | 1,091 | |||
| Majority | 1,345 | 37.4 | N/A | ||
| Turnout | 3,601 | 33.9 | N/A | ||
| Labour win (new seat) | |||||
| Labour win (new seat) | |||||
| Labour win (new seat) | |||||
| Party | Candidate | Votes | % | ± | |
|---|---|---|---|---|---|
| Labour | A. Roberts | 2,391 | 57.1 | N/A | |
| Labour | F. Newton | 2,378 | |||
| Labour | J. Hession | 2,239 | |||
| Conservative | B. Powell | 1,800 | 42.9 | N/A | |
| Conservative | R. Goodwin | 1,726 | |||
| Conservative | D. Powell | 1,713 | |||
| Majority | 591 | 14.1 | N/A | ||
| Turnout | 4,191 | 44.3 | N/A | ||
| Labour win (new seat) | |||||
| Labour win (new seat) | |||||
| Labour win (new seat) | |||||
| Party | Candidate | Votes | % | ± | |
|---|---|---|---|---|---|
| Labour | A. Banks | 1,651 | 78.0 | N/A | |
| Labour | R. Taylor | 1,439 | |||
| Labour | A. Rowlandson | 1,437 | |||
| Conservative | C. Jones | 466 | 22.0 | N/A | |
| Majority | 1,185 | 56.0 | N/A | ||
| Turnout | 2,117 | 25.7 | N/A | ||
| Labour win (new seat) | |||||
| Labour win (new seat) | |||||
| Labour win (new seat) | |||||
| Party | Candidate | Votes | % | ± | |
|---|---|---|---|---|---|
| Liberal | J. Pigott | 2,348 | 46.7 | N/A | |
| Liberal | E. Hill | 1,786 | |||
| Liberal | P. Davies | 1,722 | |||
| Labour | J. Hardy | 1,516 | 30.1 | N/A | |
| Labour | T. Morris | 1,336 | |||
| Labour | D. Standring | 1,202 | |||
| Conservative | M. Frost | 1,169 | 23.2 | N/A | |
| Majority | 832 | 16.5 | N/A | ||
| Turnout | 5,033 | 49.8 | N/A | ||
| Liberal win (new seat) | |||||
| Liberal win (new seat) | |||||
| Liberal win (new seat) | |||||
| Party | Candidate | Votes | % | ± | |
|---|---|---|---|---|---|
| Labour | G. Macdonald | 2,309 | 72.7 | N/A | |
| Labour | P. Hull | 2,204 | |||
| Labour | P. Smith | 2,112 | |||
| Conservative | M. Stott | 706 | 22.2 | N/A | |
| Conservative | G. Byrne | 701 | |||
| Communist | H. Kedward | 159 | 5.0 | N/A | |
| Majority | 1,603 | 50.5 | N/A | ||
| Turnout | 3,174 | 35.2 | N/A | ||
| Labour win (new seat) | |||||
| Labour win (new seat) | |||||
| Labour win (new seat) | |||||
| Party | Candidate | Votes | % | ± | |
|---|---|---|---|---|---|
| Labour | J. Riley | 1,987 | 55.5 | N/A | |
| Labour | D. Caley | 1,874 | |||
| Labour | T. Harper | 1,869 | |||
| Conservative | M. Wood | 1,591 | 44.5 | N/A | |
| Conservative | H. Yates | 1,501 | |||
| Conservative | K. Price | 1,477 | |||
| Majority | 396 | 11.1 | N/A | ||
| Turnout | 3,578 | 36.1 | N/A | ||
| Labour win (new seat) | |||||
| Labour win (new seat) | |||||
| Labour win (new seat) | |||||
| Party | Candidate | Votes | % | ± | |
|---|---|---|---|---|---|
| Labour | N. Holt | 2,541 | 66.7 | N/A | |
| Labour | B. Strett | 2,538 | |||
| Labour | B. Strett | 2,511 | |||
| Conservative | T. Thompson | 1,268 | 33.3 | N/A | |
| Conservative | A. Emmett | 1,248 | |||
| Conservative | J. Harrison | 1,189 | |||
| Majority | 1,273 | 33.4 | N/A | ||
| Turnout | 3,809 | 49.9 | N/A | ||
| Labour win (new seat) | |||||
| Labour win (new seat) | |||||
| Labour win (new seat) | |||||
| Party | Candidate | Votes | % | ± | |
|---|---|---|---|---|---|
| Labour | A. Peet | 2,017 | 77.9 | N/A | |
| Labour | M. Milligan | 2,004 | |||
| Labour | J. Bridge | 1,956 | |||
| Conservative | D. Hill | 571 | 22.1 | N/A | |
| Majority | 1,446 | 55.9 | N/A | ||
| Turnout | 2,588 | 27.5 | N/A | ||
| Labour win (new seat) | |||||
| Labour win (new seat) | |||||
| Labour win (new seat) | |||||
| Party | Candidate | Votes | % | ± | |
|---|---|---|---|---|---|
| Labour | E. Maddocks | 2,237 | 81.6 | N/A | |
| Labour | J. Smith | 2,129 | |||
| Labour | N. Turner | 2,070 | |||
| Conservative | M. Hill | 279 | 10.2 | N/A | |
| Liberal | G. Foster | 226 | 8.2 | N/A | |
| Liberal | P. Gibbons | 184 | |||
| Majority | 1,958 | 71.4 | N/A | ||
| Turnout | 2,742 | 31.5 | N/A | ||
| Labour win (new seat) | |||||
| Labour win (new seat) | |||||
| Labour win (new seat) | |||||
| Party | Candidate | Votes | % | ± | |
|---|---|---|---|---|---|
| Conservative | F. Fairbairn | 1,809 | 38.5 | N/A | |
| Labour | R. Capstick | 1,674 | 35.6 | N/A | |
| Conservative | J. Hitchen | 1,552 | |||
| Conservative | M. Fox | 1,546 | |||
| Labour | E. Nickeas | 1,517 | |||
| Labour | J. Roberts | 1,377 | |||
| Residents | R. Kemp | 978 | 20.8 | N/A | |
| Liberal | K. Mason | 242 | 5.1 | N/A | |
| Majority | 35 | 2.9 | N/A | ||
| Turnout | 47,03 | 47.7 | N/A | ||
| Conservative win (new seat) | |||||
| Labour win (new seat) | |||||
| Conservative win (new seat) | |||||
| Party | Candidate | Votes | % | ± | |
|---|---|---|---|---|---|
| Conservative | W. France | 1,739 | 54.5 | N/A | |
| Conservative | G. Lewthwaite | 1,698 | |||
| Conservative | C. Giles | 1,633 | |||
| Labour | M. Pendleton | 827 | 25.9 | N/A | |
| Labour | K. Green | 818 | |||
| Labour | H. Antill | 797 | |||
| Liberal | B. Barber | 627 | 19.6 | N/A | |
| Liberal | A. Robinson | 507 | |||
| Liberal | J. Grayson | 463 | |||
| Majority | 912 | 28.6 | N/A | ||
| Turnout | 3,193 | 34.7 | N/A | ||
| Conservative win (new seat) | |||||
| Conservative win (new seat) | |||||
| Conservative win (new seat) | |||||
| Party | Candidate | Votes | % | ± | |
|---|---|---|---|---|---|
| Labour | G. Woodcock | 2,200 | 57.8 | N/A | |
| Labour | F. Walker | 2,154 | |||
| Labour | J. Burke | 2,099 | |||
| Conservative | K. Hampson | 980 | 25.7 | N/A | |
| Conservative | J. Davies | 929 | |||
| Liberal | G. Pickthall | 626 | 16.4 | N/A | |
| Liberal | L. Seal | 615 | |||
| Liberal | J. Seal | 609 | |||
| Majority | 1,220 | 32.1 | N/A | ||
| Turnout | 3,806 | 41.3 | N/A | ||
| Labour win (new seat) | |||||
| Labour win (new seat) | |||||
| Labour win (new seat) | |||||
| Party | Candidate | Votes | % | ± | |
|---|---|---|---|---|---|
| Labour | A. Coyle | 2,069 | 74.6 | N/A | |
| Labour | M. Pratt | 2,026 | |||
| Labour | W. Pendleton | 2,012 | |||
| Conservative | G. Whittle | 703 | 25.4 | N/A | |
| Conservative | D. Fitton | 681 | |||
| Majority | 1,366 | 49.3 | N/A | ||
| Turnout | 2,772 | 31.4 | N/A | ||
| Labour win (new seat) | |||||
| Labour win (new seat) | |||||
| Labour win (new seat) | |||||
| Party | Candidate | Votes | % | ± | |
|---|---|---|---|---|---|
| Labour | J. Whittle | 1,582 | 37.5 | N/A | |
| Labour | G. Taberner | 1,528 | |||
| Labour | E. Naylor | 1,487 | |||
| Conservative | A. Foster | 1,144 | 27.1 | N/A | |
| Conservative | J. Michaels | 1,068 | |||
| Conservative | E. Bell | 1,067 | |||
| Residents | C. Hughes | 674 | 16.0 | N/A | |
| Liberal | K. Higham | 672 | 15.9 | N/A | |
| Liberal | J. Fitzpatrick | 657 | |||
| Independent | G. Barlow | 149 | 3.5 | N/A | |
| Majority | 438 | 10.4 | N/A | ||
| Turnout | 4,221 | 40.8 | N/A | ||
| Labour win (new seat) | |||||
| Labour win (new seat) | |||||
| Labour win (new seat) | |||||
| Party | Candidate | Votes | % | ± | |
|---|---|---|---|---|---|
| Labour | W. Brogan | 2,100 | 76.0 | N/A | |
| Labour | J. Baldwin | 2,017 | |||
| Labour | H. Milligan | 1,946 | |||
| Conservative | A. Edwards | 662 | 24.0 | N/A | |
| Conservative | R. Rogers | 641 | |||
| Conservative | J. Unsworth | 565 | |||
| Majority | 1,438 | 52.1 | N/A | ||
| Turnout | 2,762 | 28.3 | N/A | ||
| Labour win (new seat) | |||||
| Labour win (new seat) | |||||
| Labour win (new seat) | |||||
References
- "Wigan Council results from 1973 to 2008" (PDF). wigan.gov.uk. Archived from the original (PDF) on 20 November 2011. Retrieved 30 January 2012.
| Metropolitan boroughs |
|
|---|---|
| District councils (England) |
|
| District councils (Scotland) |
|
| Mayor | |
|---|---|
| Bolton | |
| Bury | |
| Manchester | |
| Oldham | |
| Rochdale | |
| Salford | |
| Stockport | |
| Tameside | |
| Trafford | |
| Wigan | |
| County Council | |
| |