2008 Wigan Metropolitan Borough Council election
Elections to Wigan Council were held on 1 May 2008. One-third of the council was up for election.[1][2][3]
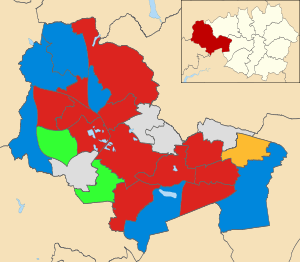
Map of the results of the 2008 Wigan council election. Labour in red, Conservatives in blue, independent in grey, Community Action Party in green and Liberal Democrats in yellow.
Election result
| Party | Seats | Gains | Losses | Net gain/loss | Seats % | Votes % | Votes | +/− | |
|---|---|---|---|---|---|---|---|---|---|
| Labour | 12 | 1 | 5 | -4 | 48.0 | 37.3 | 26,353 | -5.9% | |
| Conservative | 6 | 4 | 0 | +4 | 24.0 | 26.0 | 18,360 | +5.0% | |
| Independent | 4 | 2 | 0 | +2 | 16.0 | 8.9 | 6,260 | +5.7% | |
| Community Action | 2 | 0 | 2 | -2 | 8.0 | 13.9 | 9,830 | -1.9% | |
| Liberal Democrats | 1 | 0 | 0 | 0 | 4.0 | 8.6 | 6,054 | -1.5% | |
| BNP | 0 | 0 | 0 | 0 | 0 | 3.3 | 2,352 | -0.3% | |
| UKIP | 0 | 0 | 0 | 0 | 0 | 1.3 | 912 | +0.8% | |
| Respect | 0 | 0 | 0 | 0 | 0.0 | 0.3 | 222 | +0.3% | |
This result had the following consequences for the total number of seats on the Council after the elections:
| Party | Previous council | New council | |||
|---|---|---|---|---|---|
| Labour | 46 | 42 | |||
| Conservative | 10 | 14 | |||
| Community Action | 10 | 8 | |||
| Independent | 5 | 7 | |||
| Liberal Democrat | 4 | 4 | |||
| BNP | 0 | 0 | |||
| UKIP | 0 | 0 | |||
| Respect | 0 | 0 | |||
| Total | 75 | 75 | |||
| Working majority | 17 | 9 | |||
Ward results
Abram
| Party | Candidate | Votes | % | ± | |
|---|---|---|---|---|---|
| Labour | Eddie Russon | 1,226 | 47.8 | -7.3 | |
| Community Action | John Shale | 934 | 36.7 | +14.5 | |
| Conservative | Marion Green | 386 | 15.0 | +4.7 | |
| Rejected ballots | 11 | 0.4 | +0.2 | ||
| Majority | 283 | 11.0 | -21.8 | ||
| Turnout | 2,566 | 25.2 | +0.4 | ||
| Labour hold | Swing | -10.9 | |||
Ashton
| Party | Candidate | Votes | % | ± | |
|---|---|---|---|---|---|
| Community Action | Paul Tushingham | 1,766 | 53.4 | +8.0 | |
| Labour | Ann Rampling | 1,111 | 33.6 | -6.5 | |
| Conservative | Marie Winstanley | 248 | 7.5 | -0.7 | |
| BNP | Adrian Jones | 178 | 5.4 | -0.8 | |
| Rejected ballots | 7 | 0.2 | +0.1 | ||
| Majority | 655 | 19.8 | +14.5 | ||
| Turnout | 3,310 | 36.9 | +2.5 | ||
| Community Action hold | Swing | +7.2 | |||
Aspull New Springs Whelley
| Party | Candidate | Votes | % | ± | |
|---|---|---|---|---|---|
| Labour | John Hilton | 1,443 | 43.0 | -10.1 | |
| Liberal Democrats | Alan Robinson | 1,254 | 37.4 | +8.8 | |
| Conservative | Anthony Hind | 640 | 19.1 | +6.1 | |
| Rejected ballots | 17 | 0.5 | +0.1 | ||
| Majority | 189 | 5.6 | -18.9 | ||
| Turnout | 3,354 | 34.4 | -1.2 | ||
| Labour hold | Swing | -9.4 | |||
Astley Mosley Common
| Party | Candidate | Votes | % | ± | |
|---|---|---|---|---|---|
| Conservative | Sean Ell | 1,207 | 42.0 | +12.3 | |
| Labour | Brian Wilson | 1,014 | 35.3 | -2.6 | |
| Liberal Democrats | Gavin Clements | 684 | 22.1 | -2.0 | |
| Rejected ballots | 18 | 0.6 | +0.1 | ||
| Majority | 193 | 6.7 | -1.5 | ||
| Turnout | 2,873 | 30.9 | +2.3 | ||
| Conservative gain from Labour | Swing | +7.4 | |||
Atherleigh
| Party | Candidate | Votes | % | ± | |
|---|---|---|---|---|---|
| Labour | Susan Loudon | 1,246 | 58.7 | +6.6 | |
| Conservative | Abigail Solomon | 858 | 40.4 | +23.1 | |
| Rejected ballots | 20 | 0.9 | +0.5 | ||
| Majority | 388 | 18.3 | -3.6 | ||
| Turnout | 2,124 | 26.4 | -0.4 | ||
| Labour hold | Swing | -8.2 | |||
Atherton
| Party | Candidate | Votes | % | ± | |
|---|---|---|---|---|---|
| Independent | Bob Splaine | 976 | 29.5 | +29.5 | |
| Labour | Elnur Yusifzade | 858 | 25.8 | -19.5 | |
| Liberal Democrats | David Higginbottom | 821 | 24.8 | -12.9 | |
| Conservative | Michael Nicholls | 416 | 12.9 | +1.9 | |
| Respect | Stephen Hall | 221 | 6.7 | +6.7 | |
| Rejected ballots | 13 | 0.4 | +0.1 | ||
| Majority | 120 | 3.6 | -4.0 | ||
| Turnout | 3,314 | 31.4 | +1.9 | ||
| Independent hold | Swing | +24.5 | |||
Bryn
| Party | Candidate | Votes | % | ± | |
|---|---|---|---|---|---|
| Independent | Don Hodgkinson | 1,606 | 49.2 | -3.1 | |
| Labour | Helen Ash | 765 | 23.4 | -8.9 | |
| Community Action | Clive Charles | 384 | 12.1 | +12.1 | |
| BNP | Ken Haslam | 284 | 8.7 | -0.9 | |
| Conservative | Malcolm Childs | 204 | 6.2 | +0.6 | |
| Rejected ballots | 13 | 0.4 | +0.2 | ||
| Majority | 841 | 25.8 | +5.8 | ||
| Turnout | 3,266 | 36.2 | +1.9 | ||
| Independent hold | Swing | +2.9 | |||
Douglas
| Party | Candidate | Votes | % | ± | |
|---|---|---|---|---|---|
| Labour | Joy Birch | 1,170 | 51.4 | -6.6 | |
| Community Action | Anthony Unsworth | 745 | 32.7 | +7.3 | |
| Conservative | Stephen Holt | 350 | 15.4 | -0.8 | |
| Rejected ballots | 12 | 0.5 | +0.1 | ||
| Majority | 425 | 18.7 | -13.9 | ||
| Turnout | 2,277 | 24.6 | +0.2 | ||
| Labour hold | Swing | -6.9 | |||
Golborne Lowton West
| Party | Candidate | Votes | % | ± | |
|---|---|---|---|---|---|
| Labour | Yvonne Klieve | 1,186 | 41.0 | -15.4 | |
| Community Action | Peter Franzen | 1,110 | 38.4 | +9.6 | |
| Conservative | John Oxley | 282 | 9.8 | -4.6 | |
| BNP | Steven McEllenborough | 178 | 6.2 | +6.2 | |
| Independent | Frank Davies | 129 | 4.5 | +4.5 | |
| Rejected ballots | 7 | 0.2 | -0.2 | ||
| Majority | 76 | 2.6 | -25.0 | ||
| Turnout | 2,892 | 32.9 | +2.5 | ||
| Labour gain from Community Action | Swing | -12.5 | |||
Hindley
| Party | Candidate | Votes | % | ± | |
|---|---|---|---|---|---|
| Independent | Jim Ellis | 1,347 | 47.4 | +47.4 | |
| Labour | Marcia Dooley | 694 | 24.5 | -20.8 | |
| Independent | David Culshaw | 515 | 18.1 | +18.1 | |
| Conservative | Margaret Winstanley | 277 | 9.7 | -1.2 | |
| Rejected ballots | 7 | 0.2 | -0.1 | ||
| Majority | 1,166 | 41.0 | +39.1 | ||
| Turnout | 2,842 | 29.1 | +2.4 | ||
| Independent gain from Labour | Swing | +34.1 | |||
Hindley Green
| Party | Candidate | Votes | % | ± | |
|---|---|---|---|---|---|
| Independent | Bob Brierley | 1,105 | 44.7 | +44.7 | |
| Labour | Martin Long | 981 | 26.5 | -3.6 | |
| Conservative | Stuart Foy | 353 | 14.3 | +3.9 | |
| Community Action | Rachel Fagan | 351 | 14.2 | -17.2 | |
| Rejected ballots | 10 | 0.4 | +0.1 | ||
| Majority | 450 | 18.2 | +16.9 | ||
| Turnout | 2,474 | 28.9 | +2.4 | ||
| Independent gain from Labour | Swing | +24.1 | |||
Ince
| Party | Candidate | Votes | % | ± | |
|---|---|---|---|---|---|
| Labour | David Molyneux | 1,180 | 60.5 | -5.9 | |
| Community Action | Syd Hall | 479 | 24.6 | +2.0 | |
| Conservative | Raymond Whittingham | 275 | 14.1 | +3.8 | |
| Rejected ballots | 15 | 0.8 | +0.2 | ||
| Majority | 701 | 36 | -7.9 | ||
| Turnout | 1,949 | 23.0 | -0.6 | ||
| Labour hold | Swing | -3.9 | |||
Leigh East
| Party | Candidate | Votes | % | ± | |
|---|---|---|---|---|---|
| Labour | Keith Cunliffe | 981 | 43.8 | -4.3 | |
| Conservative | Dorothy Angell | 649 | 29.0 | +9.0 | |
| Liberal Democrats | Gordon Jackson | 597 | 26.4 | -4.7 | |
| Rejected ballots | 17 | 0.8 | +0.0 | ||
| Majority | 332 | 14.8 | -2.2 | ||
| Turnout | 2,238 | 24.8 | -2.2 | ||
| Labour hold | Swing | -6.6 | |||
Leigh South
| Party | Candidate | Votes | % | ± | |
|---|---|---|---|---|---|
| Labour | Kevin Anderson | 1,372 | 41.2 | -2.1 | |
| Conservative | Andrew Oxley | 1,000 | 30.1 | +6.6 | |
| Community Action | Ian Franzen | 476 | 14.3 | -9.5 | |
| BNP | Gary Chadwick | 470 | 14.1 | +5.1 | |
| Rejected ballots | 9 | 0.3 | -0.2 | ||
| Majority | 372 | 11.2 | -8.3 | ||
| Turnout | 3,327 | 32.6 | +1.5 | ||
| Labour hold | Swing | -4.3 | |||
Leigh West
| Party | Candidate | Votes | % | ± | |
|---|---|---|---|---|---|
| Labour | Susan Greensmith | 1,543 | 64.3 | +10.3 | |
| Conservative | Denise Young | 817 | 34.0 | +22.7 | |
| Rejected ballots | 40 | 1.7 | +1.3 | ||
| Majority | 726 | 30.3 | -0.2 | ||
| Turnout | 2,400 | 22.9 | -0.9 | ||
| Labour hold | Swing | -6.2 | |||
Lowton East
| Party | Candidate | Votes | % | ± | |
|---|---|---|---|---|---|
| Conservative | James Grundy | 1,972 | 53.6 | +29.9 | |
| Community Action | Ian Franzen | 943 | 25.6 | -17.4 | |
| Labour | James Cowley | 758 | 20.6 | -12.3 | |
| Rejected ballots | 8 | 0.2 | -0.2 | ||
| Majority | 1,029 | 28.0 | +17.9 | ||
| Turnout | 3,681 | 37.9 | +4.3 | ||
| Conservative gain from Community Action | Swing | +23.6 | |||
Orrell
| Party | Candidate | Votes | % | ± | |
|---|---|---|---|---|---|
| Conservative | Richard Clayton | 1,608 | 46.5 | +1.3 | |
| Labour | Mike Barnes | 969 | 28.0 | -7.6 | |
| BNP | Charles Mather | 548 | 15.8 | +1.5 | |
| Independent | Richard Clayton | 321 | 9.3 | +9.3 | |
| Rejected ballots | 12 | 0.3 | +0.0 | ||
| Majority | 639 | 18.5 | +8.9 | ||
| Turnout | 3,458 | 37.9 | -2.4 | ||
| Conservative hold | Swing | +4.4 | |||
Pemberton
| Party | Candidate | Votes | % | ± | |
|---|---|---|---|---|---|
| Labour | Jeanette Prescott | 1,387 | 55.7 | -1.9 | |
| Community Action | Mike Leyland | 406 | 16.3 | -0.3 | |
| Conservative | Benjamin Gray | 350 | 14.1 | +2.1 | |
| BNP | Chris Hilton | 334 | 13.4 | -0.1 | |
| Rejected ballots | 14 | 0.6 | +0.2 | ||
| Majority | 981 | 39.4 | -1.6 | ||
| Turnout | 2,491 | 25.9 | +1.0 | ||
| Labour hold | Swing | -0.8 | |||
Shevington with Lower Ground
| Party | Candidate | Votes | % | ± | |
|---|---|---|---|---|---|
| Conservative | Paul Liptrot | 1,531 | 48.4 | +6.5 | |
| Labour | Mike Crosby | 971 | 30.7 | -7.3 | |
| Liberal Democrats | Martin Sutton | 251 | 7.9 | -1.5 | |
| UKIP | John Atherton | 251 | 7.9 | -2.3 | |
| Independent | Andy Sumner | 157 | 5.0 | +5.0 | |
| Rejected ballots | 2 | 0.1 | -0.3 | ||
| Majority | 560 | 17.7 | +13.8 | ||
| Turnout | 3,163 | 34.2 | -0.7 | ||
| Conservative gain from Labour | Swing | +6.9 | |||
Standish with Langtree
| Party | Candidate | Votes | % | ± | |
|---|---|---|---|---|---|
| Conservative | Judith Atherton | 1,710 | 50.8 | -7.1 | |
| Labour | George Davies | 1,039 | 30.9 | +2.3 | |
| UKIP | Alan Freeman | 283 | 8.4 | +8.4 | |
| Liberal Democrats | June Garner | 214 | 6.4 | -6.6 | |
| Community Action | Ronnie Barnes | 116 | 3.4 | +3.4 | |
| Rejected ballots | 5 | 0.1 | -0.4 | ||
| Majority | 671 | 19.9 | -9.4 | ||
| Turnout | 3,367 | 35.6 | -0.9 | ||
| Conservative gain from Labour | Swing | -4.7 | |||
Tyldesley
| Party | Candidate | Votes | % | ± | |
|---|---|---|---|---|---|
| Liberal Democrats | Robert Bleakley | 1,827 | 65.7 | +2.7 | |
| Labour | Barry Taylor | 621 | 22.0 | +6.7 | |
| Conservative | Hilary Hayden | 313 | 11.3 | -1.4 | |
| Rejected ballots | 29 | 1.0 | +0.9 | ||
| Majority | 1,215 | 43.7 | -4.0 | ||
| Turnout | 2,781 | 27.8 | -0.8 | ||
| Liberal Democrats hold | Swing | -2.0 | |||
Wigan Central
| Party | Candidate | Votes | % | ± | |
|---|---|---|---|---|---|
| Conservative | Henry Cadman | 1,562 | 50.3 | +6.1 | |
| Labour | Mathew Bullen | 940 | 30.2 | -2.8 | |
| UKIP | Keith Jones | 378 | 12.2 | +12.2 | |
| Community Action | Leanne Brotherton | 213 | 6.9 | +0.0 | |
| Rejected ballots | 15 | 0.5 | +0.2 | ||
| Majority | 622 | 20.0 | +8.8 | ||
| Turnout | 3,108 | 34.3 | -0.3 | ||
| Conservative hold | Swing | +4.4 | |||
Wigan West
| Party | Candidate | Votes | % | ± | |
|---|---|---|---|---|---|
| Labour | Terence Halliwell | 1,089 | 43.7 | -3.7 | |
| Conservative | Steven Surples | 471 | 18.9 | -0.3 | |
| Liberal Democrats | Darren Atherton | 462 | 18.6 | +18.6 | |
| BNP | Susan Mather | 360 | 14.5 | +0.7 | |
| Independent | Mick Dahl | 104 | 4.2 | +4.2 | |
| Rejected ballots | 4 | 0.2 | -0.2 | ||
| Majority | 618 | 24.8 | -3.4 | ||
| Turnout | 2,490 | 25.0 | -3.6 | ||
| Labour hold | Swing | -1.7 | |||
Winstanley
| Party | Candidate | Votes | % | ± | |
|---|---|---|---|---|---|
| Community Action | Stanley Barnes | 1,226 | 46.9 | +7.7 | |
| Labour | Phil Kelly | 869 | 33.4 | -10.0 | |
| Conservative | Paula Thompson | 508 | 19.5 | +2.4 | |
| Rejected ballots | 9 | 0.3 | +0.0 | ||
| Majority | 357 | 13.7 | +9.6 | ||
| Turnout | 2,612 | 29.8 | -2.2 | ||
| Community Action hold | Swing | +8.8 | |||
Worsley Mesnes
| Party | Candidate | Votes | % | ± | |
|---|---|---|---|---|---|
| Labour | Brian Baldwin | 1,275 | 55.1 | -0.2 | |
| Community Action | Hannah Leyland | 662 | 28.6 | +3.0 | |
| Conservative | Jonathan Cartwright | 363 | 15.7 | +4.2 | |
| Rejected ballots | 16 | 0.7 | +0.3 | ||
| Majority | 613 | 26.5 | -3.2 | ||
| Turnout | 2,316 | 26.4 | -1.3 | ||
| Labour hold | Swing | -1.6 | |||
By-elections between 2008 and 2010
| Party | Candidate | Votes | % | ± | |
|---|---|---|---|---|---|
| Labour | Steve Dawber | 817 | 38.3 | -5.4 | |
| Conservative | Jonathan Cartwright | 528 | 24.8 | +5.9 | |
| Liberal Democrats | Trevor Beswick | 344 | 16.1 | -2.5 | |
| BNP | Christopher Hilton | 200 | 9.4 | -5.1 | |
| UKIP | Keith Jones | 124 | 5.8 | +5.8 | |
| Independent | Sandy Franzen | 118 | 5.5 | +1.3 | |
| Majority | 289 | 13.5 | -11.3 | ||
| Turnout | 2,131 | 21.0 | -4.0 | ||
| Labour hold | Swing | -5.6 | |||
gollark: https://en.wikipedia.org/wiki/Milgram_experiment
gollark: There was the milgram obedience experiment or whatever it is. Humans love our conformity.
gollark: Some humans.
gollark: Although to some extent that's humans anyway.
gollark: Perhaps you would end up with the AIs learning to distinguish training scenarios from not training scenarios, and being awful all the time when not monitored.
References
- "Local elections: Wigan". BBC News Online. Retrieved 4 July 2012.
- "Local Election Results 01 May 2008". wiganmbc.gov.uk. Retrieved 28 June 2012.
- "Local Elections Archive Project: 2008 - Wigan". andrewteale.me.uk. Retrieved 28 June 2012.
- "Wigan West By-Election Result – 10 July 2008". Wigan Council. Archived from the original on 21 November 2008. Retrieved 20 July 2008.
- "Local Authority Byelection Results". gwydir.demon.co.uk. Retrieved 13 June 2012.
| Mayor | |
|---|---|
| Bolton | |
| Bury | |
| Manchester | |
| Oldham | |
| Rochdale | |
| Salford | |
| Stockport | |
| Tameside | |
| Trafford | |
| Wigan | |
| County Council | |
| |
This article is issued from Wikipedia. The text is licensed under Creative Commons - Attribution - Sharealike. Additional terms may apply for the media files.