1978 Wigan Metropolitan Borough Council election
Elections to Wigan Council were held on 4 May 1878, with one third of the council up for election as well as vacancies in Ward 2 and 17. Previous to the election, a Labour councillor in Ward 9 defected to become an Independent Labour, reducing Labour's majority to 38. This seat was up for vote and became the only Labour gain of the night, as they suffered five losses to the Conservatives, and their majority reduced to 30 - half of what it was in 1973. The election seen a first of all wards being contested, with turnout rising marginally to 34.7%.[1]
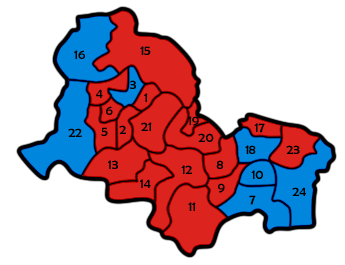
Map of the results for the 1978 Wigan council election. Labour in red and Conservatives in blue.
Election result
| Party | Seats | Gains | Losses | Net gain/loss | Seats % | Votes % | Votes | +/− | |
|---|---|---|---|---|---|---|---|---|---|
| Labour | 19 | 1 | 5 | -4 | 73.1 | 54.3 | 42,687 | +3.0% | |
| Conservative | 7 | 5 | 0 | +5 | 26.9 | 43.6 | 34,337 | +2.8% | |
| Liberal | 0 | 0 | 0 | 0 | 0.0 | 1.7 | 1,331 | -2.2% | |
| Communist | 0 | 0 | 0 | 0 | 0.0 | 0.2 | 147 | -0.2% | |
| Independent Labour | 0 | 0 | 1 | -1 | 0.0 | 0.2 | 146 | +0.2% | |
This result had the following consequences for the total number of seats on the Council after the elections:
| Party | Previous council | New council | |||
|---|---|---|---|---|---|
| Labour | 55 | 51 | |||
| Conservatives | 14 | 19 | |||
| Liberals | 1 | 1 | |||
| Independent | 1 | 1 | |||
| Independent Labour | 1 | 0 | |||
| Total | 72 | 72 | |||
| Working majority | 38 | 30 | |||
Ward results
| Party | Candidate | Votes | % | ± | |
|---|---|---|---|---|---|
| Labour | W. Pendleton | 1,980 | 62.9 | -0.2 | |
| Conservative | C. Giles | 1,170 | 37.1 | +0.2 | |
| Majority | 810 | 25.7 | -0.5 | ||
| Turnout | 3,150 | 34.3 | +1.2 | ||
| Labour hold | Swing | -0.2 | |||
| Party | Candidate | Votes | % | ± | |
|---|---|---|---|---|---|
| Labour | W. Brogan | 1,744 | 66.8 | +4.3 | |
| Labour | H. Antill | 1,587 | |||
| Conservative | C. Rogers | 866 | 33.2 | +9.5 | |
| Conservative | R. Rogers | 837 | |||
| Majority | 878 | 33.6 | -5.3 | ||
| Turnout | 2,610 | 29.2 | +4.5 | ||
| Labour hold | Swing | ||||
| Labour hold | Swing | -2.6 | |||
| Party | Candidate | Votes | % | ± | |
|---|---|---|---|---|---|
| Conservative | H. Dowling | 2,731 | 70.5 | +1.3 | |
| Labour | M. Pendleton | 1,143 | 29.5 | -1.3 | |
| Majority | 1,588 | 41.0 | +2.6 | ||
| Turnout | 3,874 | 34.2 | +0.8 | ||
| Conservative hold | Swing | +1.3 | |||
| Party | Candidate | Votes | % | ± | |
|---|---|---|---|---|---|
| Labour | E. Naylor | 1,892 | 68.5 | N/A | |
| Conservative | A. Atherton | 869 | 31.5 | N/A | |
| Majority | 1,023 | 37.1 | N/A | ||
| Turnout | 2,761 | 29.4 | N/A | ||
| Labour hold | Swing | N/A | |||
| Party | Candidate | Votes | % | ± | |
|---|---|---|---|---|---|
| Labour | G. Barlow | 1,553 | 52.4 | -1.0 | |
| Conservative | A. Foster | 1,412 | 47.6 | +1.0 | |
| Majority | 141 | 4.8 | -2.0 | ||
| Turnout | 2,965 | 26.1 | -0.3 | ||
| Labour hold | Swing | -1.0 | |||
| Party | Candidate | Votes | % | ± | |
|---|---|---|---|---|---|
| Labour | A. Peet | 1,591 | 66.5 | +4.5 | |
| Conservative | J. Lawson | 801 | 33.5 | +5.5 | |
| Majority | 790 | 33.0 | -0.9 | ||
| Turnout | 2,392 | 27.6 | +0.2 | ||
| Labour hold | Swing | -0.5 | |||
| Party | Candidate | Votes | % | ± | |
|---|---|---|---|---|---|
| Conservative | R. Goodwin | 1,711 | 56.2 | -0.0 | |
| Labour | A. Roberts | 1,334 | 43.8 | +0.0 | |
| Majority | 377 | 12.4 | -0.1 | ||
| Turnout | 3,045 | 43.3 | -1.6 | ||
| Conservative gain from Labour | Swing | -0.0 | |||
| Party | Candidate | Votes | % | ± | |
|---|---|---|---|---|---|
| Labour | G. Macdonald | 1,542 | 62.6 | +3.8 | |
| Conservative | W. Lackenby | 830 | 33.7 | -3.4 | |
| Communist | H. Kedward | 90 | 3.7 | -0.4 | |
| Majority | 712 | 28.9 | +7.1 | ||
| Turnout | 2,462 | 27.2 | +1.4 | ||
| Labour hold | Swing | +3.6 | |||
| Party | Candidate | Votes | % | ± | |
|---|---|---|---|---|---|
| Labour | P. Smith | 1,386 | 46.6 | -4.9 | |
| Conservative | H. Davies | 1,385 | 46.6 | +1.1 | |
| Independent Labour | E. Moore | 146 | 4.9 | +4.9 | |
| Communist | K. James | 57 | 1.9 | -1.0 | |
| Majority | 1 | 0.0 | -6.0 | ||
| Turnout | 2,974 | 33.0 | -2.3 | ||
| Labour gain from Independent Labour | Swing | -3.0 | |||
| Party | Candidate | Votes | % | ± | |
|---|---|---|---|---|---|
| Conservative | G. Wyatt | 2,042 | 57.2 | +4.6 | |
| Labour | H. Smith | 1,528 | 42.8 | -1.2 | |
| Majority | 514 | 14.4 | +5.8 | ||
| Turnout | 3,570 | 40.3 | +0.2 | ||
| Conservative gain from Labour | Swing | +2.9 | |||
| Party | Candidate | Votes | % | ± | |
|---|---|---|---|---|---|
| Labour | N. Holt | 2,468 | 58.2 | -0.5 | |
| Conservative | T. Thompson | 1,776 | 41.8 | +0.5 | |
| Majority | 692 | 16.3 | -1.0 | ||
| Turnout | 4,244 | 40.7 | +1.0 | ||
| Labour hold | Swing | -0.5 | |||
| Party | Candidate | Votes | % | ± | |
|---|---|---|---|---|---|
| Labour | J. Hilton | 2,116 | 64.9 | -5.4 | |
| Conservative | J. Harrison | 1,146 | 35.1 | +5.4 | |
| Majority | 970 | 29.7 | -10.7 | ||
| Turnout | 3,262 | 36.7 | -1.2 | ||
| Labour hold | Swing | -5.4 | |||
| Party | Candidate | Votes | % | ± | |
|---|---|---|---|---|---|
| Labour | A. Heckles | 1,695 | 62.8 | -4.8 | |
| Conservative | B. Smith | 1,003 | 37.2 | +37.2 | |
| Majority | 692 | 25.6 | -9.6 | ||
| Turnout | 2,698 | 35.5 | +3.5 | ||
| Labour hold | Swing | -21.0 | |||
| Party | Candidate | Votes | % | ± | |
|---|---|---|---|---|---|
| Labour | S. Lea | 1,645 | 56.7 | +4.2 | |
| Conservative | M. Ball | 1,257 | 43.3 | +14.3 | |
| Majority | 388 | 13.4 | -10.1 | ||
| Turnout | 2,902 | 32.5 | -5.4 | ||
| Labour hold | Swing | -5.0 | |||
| Party | Candidate | Votes | % | ± | |
|---|---|---|---|---|---|
| Labour | G. Pullin | 1,981 | 39.8 | +4.4 | |
| Conservative | E. Howard | 1,911 | 38.4 | +9.7 | |
| Liberal | J. Pigot | 1,089 | 21.9 | +21.9 | |
| Majority | 70 | 1.4 | +0.8 | ||
| Turnout | 4,981 | +42.2 | +3.4 | ||
| Labour hold | Swing | -2.6 | |||
| Party | Candidate | Votes | % | ± | |
|---|---|---|---|---|---|
| Conservative | J. Wild | 1,942 | 48.0 | +0.8 | |
| Labour | A. Singer | 1,860 | 46.0 | +6.3 | |
| Liberal | K. Mason | 242 | 6.0 | -7.1 | |
| Majority | 82 | 2.0 | -1.4 | ||
| Turnout | 4,044 | 41.7 | +7.5 | ||
| Conservative gain from Labour | Swing | -2.7 | |||
| Party | Candidate | Votes | % | ± | |
|---|---|---|---|---|---|
| Labour | J. Clarke | 2,590 | 72.1 | +5.6 | |
| Labour | W. Murphy | 2,115 | |||
| Conservative | M. Sharland | 1,001 | 27.9 | -5.6 | |
| Conservative | B. France | 895 | |||
| Majority | 1,589 | 44.2 | +11.2 | ||
| Turnout | 3,591 | 34.1 | +0.6 | ||
| Labour hold | Swing | ||||
| Labour hold | Swing | +5.6 | |||
| Party | Candidate | Votes | % | ± | |
|---|---|---|---|---|---|
| Conservative | D. Williams | 1,435 | 52.5 | -6.8 | |
| Labour | J. Sumner | 1,296 | 47.5 | +6.8 | |
| Majority | 139 | 5.1 | -13.6 | ||
| Turnout | 2,731 | 42.1 | +4.4 | ||
| Conservative gain from Labour | Swing | -6.8 | |||
| Party | Candidate | Votes | % | ± | |
|---|---|---|---|---|---|
| Labour | C. Priestley | 1,558 | 68.5 | +1.8 | |
| Conservative | L. McGreal | 716 | 31.5 | -1.8 | |
| Majority | 842 | 37.0 | +3.6 | ||
| Turnout | 2,274 | 30.9 | +2.8 | ||
| Labour hold | Swing | +1.8 | |||
| Party | Candidate | Votes | % | ± | |
|---|---|---|---|---|---|
| Labour | G. Harrison | 1,720 | 55.8 | +6.0 | |
| Conservative | T. Whitfield | 1,361 | 44.2 | +5.2 | |
| Majority | 359 | 11.7 | +0.8 | ||
| Turnout | 3,081 | 28.3 | -1.7 | ||
| Labour hold | Swing | +0.4 | |||
| Party | Candidate | Votes | % | ± | |
|---|---|---|---|---|---|
| Labour | R. Taylor | 2,553 | 71.7 | N/A | |
| Conservative | M. Jones | 1,006 | 28.3 | N/A | |
| Majority | 1,547 | 43.5 | N/A | ||
| Turnout | 3,559 | 31.8 | N/A | ||
| Labour hold | Swing | N/A | |||
| Party | Candidate | Votes | % | ± | |
|---|---|---|---|---|---|
| Conservative | J. Hitchen | 2,723 | 55.3 | +11.2 | |
| Labour | J. Whittle | 2,201 | 44.7 | +9.6 | |
| Majority | 522 | 10.6 | +1.5 | ||
| Turnout | 4,924 | 35.7 | +3.2 | ||
| Conservative gain from Labour | Swing | +0.8 | |||
| Party | Candidate | Votes | % | ± | |
|---|---|---|---|---|---|
| Labour | S. Little | 1,744 | 51.9 | -1.8 | |
| Conservative | L. Knowles | 1,614 | 48.1 | +1.8 | |
| Majority | 130 | 3.9 | -3.6 | ||
| Turnout | 3,358 | 37.5 | -1.0 | ||
| Labour hold | Swing | -1.8 | |||
| Party | Candidate | Votes | % | ± | |
|---|---|---|---|---|---|
| Conservative | S. Emerton | 1,629 | 51.0 | -4.5 | |
| Labour | R. Rawson | 1,567 | 49.0 | +4.5 | |
| Majority | 62 | 1.9 | -8.9 | ||
| Turnout | 3,196 | 41.4 | -1.2 | ||
| Conservative gain from Labour | Swing | -4.5 | |||
gollark: Fascinating.
gollark: Four dots? Wow.
gollark: Even if you reverse-engineer where it gets the hashes from and how it operates, by the nature of the thing you couldn't work out what was being detected without already having samples of it in the first place.
gollark: Anyway, the generality of this solution and the fact that they'll probably keep the exact details private for "security"-through-obscurity reasons also means that, as I have written here (https://osmarks.net/osbill/) in a blog post tangentially mentioning it, someone could just feed it hashes for, say, anti-government memes and find out who is saving those.
gollark: Although I suppose that *someone* probably keeps the originals around in case they have to change the hashing algorithm.
References
- "Wigan Council results from 1973 to 2008" (PDF). wigan.gov.uk. Archived from the original (PDF) on 20 November 2011. Retrieved 29 January 2012.
| London boroughs |
|
|---|---|
| Metropolitan boroughs |
|
| District councils (England) |
|
| Regional councils (Scotland) |
|
| Mayor | |
|---|---|
| Bolton | |
| Bury | |
| Manchester | |
| Oldham | |
| Rochdale | |
| Salford | |
| Stockport | |
| Tameside | |
| Trafford | |
| Wigan | |
| County Council | |
| |
This article is issued from Wikipedia. The text is licensed under Creative Commons - Attribution - Sharealike. Additional terms may apply for the media files.