1924 Prussian state election
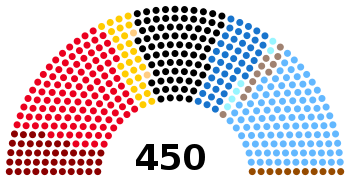
State elections were held in the Free State of Prussia on 7 December 1924 to elect all 450 members of the Landtag of Prussia.[1] The governing coalition of the Social Democratic Party, Centre Party, and German Democratic Party made minimal gains or losses, with most change happening amongst the opposition. The German National People's Party made significant gains, nearly surpassing the SPD as the largest party, while the Independent Social Democratic Party collapsed. The German People's Party also lost a portion of the gains it had made in the previous election. The National Socialist Freedom Party, a branch of the Nazi Party formed after the Beer Hall Putsch, won 2.5% of the vote and 11 seats.
| |||||||||||||||||||||||||||||||||||||||||||||||||||||||||||||||||||||||||||||||||||||||||||||||||||||||||
All 450 seats in the Landtag of Prussia 226 seats needed for a majority | |||||||||||||||||||||||||||||||||||||||||||||||||||||||||||||||||||||||||||||||||||||||||||||||||||||||||
|---|---|---|---|---|---|---|---|---|---|---|---|---|---|---|---|---|---|---|---|---|---|---|---|---|---|---|---|---|---|---|---|---|---|---|---|---|---|---|---|---|---|---|---|---|---|---|---|---|---|---|---|---|---|---|---|---|---|---|---|---|---|---|---|---|---|---|---|---|---|---|---|---|---|---|---|---|---|---|---|---|---|---|---|---|---|---|---|---|---|---|---|---|---|---|---|---|---|---|---|---|---|---|---|---|---|
| Turnout | 18,380,285 (78.58%) | ||||||||||||||||||||||||||||||||||||||||||||||||||||||||||||||||||||||||||||||||||||||||||||||||||||||||
| |||||||||||||||||||||||||||||||||||||||||||||||||||||||||||||||||||||||||||||||||||||||||||||||||||||||||
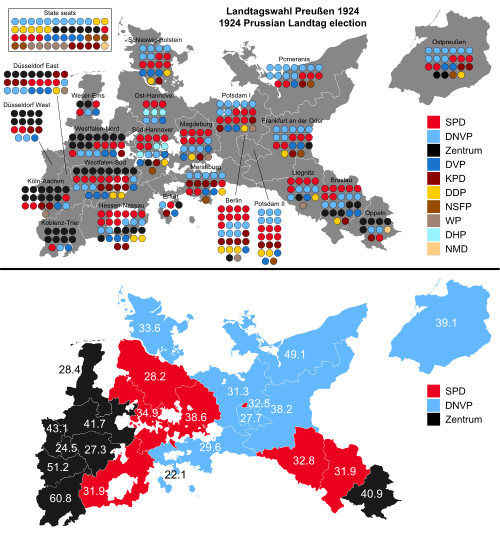 Top: results by constituency. Bottom: winning party in each constituency. | |||||||||||||||||||||||||||||||||||||||||||||||||||||||||||||||||||||||||||||||||||||||||||||||||||||||||
| |||||||||||||||||||||||||||||||||||||||||||||||||||||||||||||||||||||||||||||||||||||||||||||||||||||||||
Results
 | ||||||
| Party | Votes | % | Swing | Seats | +/– | |
|---|---|---|---|---|---|---|
| Social Democratic Party (SPD) | 4,575,645 | 24.89 | –1.37 | 114 | 0 | |
| German National People's Party (DNVP) | 4,355,674 | 23.70 | +5.62 | 109 | +34 | |
| Centre Party (Zentrum) | 3,229,740 | 17.57 | +0.33 | 81 | 0 | |
| German People's Party (DVP) | 1,797,589 | 9.78 | –4.40 | 45 | –13 | |
| List of Communists (KPD) | 1,767,932 | 9.62 | +2.21 | 44 | +13 | |
| German Democratic Party (DDP) | 1,083,523 | 5.90 | –0.07 | 27 | +1 | |
| National Socialist Freedom Party (NSFP) | 454,886 | 2.47 | New | 11 | New | |
| Economic Party of the German Middle Classes (WP) Economic Party of the German Middle Classes (WP) Farmers and Creative Professions |
454,409 440,212 14,674 |
2.47 2.40 0.08 |
+1.29 +1.22 New |
11 11 0 |
+7 +7 New | |
| German-Hanoverian Party German-Hanoverian Party (DHP) Greater German-Hessian League |
259,506 258,198 1,308 |
1.41 1.40 0.01 |
–1.27 –1.11 New |
6 6 0 |
–5 –5 New | |
| German Social Party and Reichsbund for Revaluation | 111,939 | 0.61 | New | 0 | New | |
| National Minorities of Germany (NMD) Poland Party Schleswiger Association Wendish Party Masurian Association |
87,891 80,751 5,404 1,255 481 |
0.48 0.44 0.03 0.01 0.00 |
+0.38 +0.37 0.00 New New |
2 2 0 0 0 |
+2 +2 0 New New | |
| Independent Social Democratic Party (USPD) | 67,871[lower-alpha 1] | 0.37 | –6.21 | 0 | –28 | |
| German Revaluation and Construction Party | 41,280 | 0.22 | New | 0 | New | |
| Christian Social National Community of Germany | 37,679 | 0.20 | New | 0 | New | |
| Party for People's Welfare (Tenant Protection and Land Rights) | 27,582 | 0.15 | New | 0 | New | |
| Revaluation and Reconstruction Party | 13,616 | 0.07 | New | 0 | New | |
| Free Economic Union F.F.F. (Freiland-Freigeld) | 13,523 | 0.07 | New | 0 | New | |
| Invalid/blank votes | 337,562 | 1.80 | – | – | – | |
| Total | 18,380,285 | 100 | – | 450 | +22 | |
| Registered voters/turnout | 23,819,471 | 78.58 | +1.18 | – | – | |
| Gonschior.de | ||||||
Results by constituency
| Constituency | SPD | DNVP | Z | DVP | KPD | DDP | NSFP | WP | DHP | NMD |
|---|---|---|---|---|---|---|---|---|---|---|
| 1. East Prussia | 20.8 | 39.1 | 8.0 | 9.0 | 8.1 | 4.0 | 6.2 | 1.0 | – | 0.6 |
| 2. Berlin | 32.5 | 21.9 | 4.1 | 4.9 | 19.3 | 10.1 | 1.6 | 3.4 | – | 0.3 |
| 3. Potsdam II | 26.7 | 27.7 | 3.5 | 8.5 | 11.6 | 12.5 | 2.9 | 3.8 | – | 0.1 |
| 4. Potsdam I | 30.4 | 31.3 | 2.5 | 7.8 | 12.2 | 6.2 | 2.8 | 5.1 | – | 0.1 |
| 5. Frankfurt an der Oder | 27.9 | 38.2 | 6.3 | 10.9 | 4.4 | 4.7 | 3.2 | 2.2 | – | 0.7 |
| 6. Pomerania | 24.6 | 49.1 | 1.0 | 6.5 | 5.8 | 3.8 | 4.2 | 3.9 | – | 0.1 |
| 7. Breslau | 31.9 | 28.8 | 19.2 | 7.7 | 3.1 | 4.6 | 1.4 | 1.4 | – | 0.1 |
| 8. Liegnitz | 32.8 | 28.9 | 9.0 | 8.3 | 3.3 | 8.0 | 1.4 | 5.0 | – | 0.3 |
| 9. Oppeln | 6.7 | 21.7 | 40.9 | 2.8 | 12.1 | 2.3 | 1.5 | 3.0 | – | 7.8 |
| 10. Magdeburg | 38.6 | 25.1 | 2.1 | 13.4 | 5.2 | 7.2 | 3.1 | 4.8 | – | 0.0 |
| 11. Merseburg | 18.7 | 29.6 | 1.4 | 12.1 | 22.9 | 6.9 | 4.4 | 3.5 | – | – |
| 12. Erfurt | 21.7 | 22.1 | 13.9 | 12.3 | 13.4 | 5.2 | 5.2 | 6.3 | – | – |
| 13. Schleswig-Holstein | 30.5 | 33.6 | – | 15.1 | 6.9 | 9.0 | 2.7 | 0.6 | – | 0.7 |
| 14. Weser-Ems | 30.5 | 16.4 | 28.4 | 14.5 | 3.0 | 6.2 | 4.7 | – | 4.4 | – |
| 15. Hanover East | 28.2 | 20.9 | 1.4 | 11.5 | 4.5 | 4.2 | 4.3 | – | 24.7 | 0.1 |
| 16. Hanover South | 34.9 | 15.9 | 6.6 | 13.4 | 4.7 | 4.7 | 3.0 | – | 16.4 | 0.1 |
| 17. Westphalia North | 20.3 | 15.3 | 41.7 | 8.8 | 6.7 | 3.0 | 1.1 | 1.0 | – | 0.4 |
| 18. Westphalia South | 24.6 | 12.5 | 27.3 | 12.1 | 12.2 | 6.0 | 1.1 | 1.7 | – | 0.7 |
| 19. Hesse-Nassau | 31.9 | 18.6 | 17.5 | 12.6 | 5.6 | 8.5 | 2.4 | 2.3 | – | – |
| 20. Köln-Aachen | 15.4 | 7.1 | 51.2 | 7.9 | 8.8 | 3.6 | 0.6 | 4.9 | – | 0.0 |
| 21. Koblenz-Trier | 10.6 | 9.9 | 60.8 | 7.7 | 4.2 | 3.3 | 0.5 | 3.0 | – | – |
| 22. Düsseldorf East | 15.4 | 15.3 | 24.5 | 11.6 | 20.9 | 4.5 | 1.6 | 4.3 | – | 0.2 |
| 23. Düsseldorf West | 13.9 | 11.3 | 43.1 | 9.5 | 12.5 | 3.4 | 0.9 | 3.9 | – | 0.5 |
gollark: Testbot2, servers.
gollark: Testbot1, servers.
gollark: Testbot3, servers.
gollark: Testbot, servers.
gollark: 34 days? Wow.
Notes
- The list "Independent Social Democratic Party of Germany" in constituency 13 (Schleswig-Holstein) won 3,655 votes, but was not affiliated with the state party list.
References
- Dieter Nohlen & Philip Stöver (2010) Elections in Europe: A data handbook, p762 ISBN 978-3-8329-5609-7
This article is issued from Wikipedia. The text is licensed under Creative Commons - Attribution - Sharealike. Additional terms may apply for the media files.