Šekovići
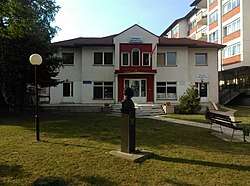
Šekovići (Serbian Cyrillic: Шековићи) is a town and municipality located in northeastern Republika Srpska, an entity of Bosnia and Herzegovina. As of 2013, it has a population of 6,761 inhabitants, while the town of Šekovići has a population of 1,519 inhabitants.
Šekovići Шековићи | |
|---|---|
Town and municipality | |
 | |
.svg.png) Coat of arms | |
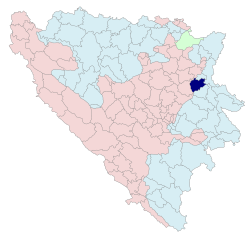
 Location of Šekovići within Bosnia and Herzegovina | |
| Coordinates: 44°18′N 18°51′E | |
| Country | Bosnia and Herzegovina |
| Entity | Republika Srpska |
| Government | |
| • Mayor | Momir Ristić (SNSD) |
| Area | |
| • Total | 237.2 km2 (91.6 sq mi) |
| Population (2013 census) | |
| • Total | 6,761 |
| • Density | 29/km2 (74/sq mi) |
| Time zone | UTC+1 (CET) |
| • Summer (DST) | UTC+2 (CEST) |
| Area code(s) | 56 |
| Website | www |
History
From the Roman period to the present day major roads were cutting through the Šekovići region. These roads connected regions East of Drina River with Central Bosnia. Šekovići got its name by one portion of its inhabitants from Šekovina in Herzegovina, who immigrated to this region at the end of the 17th century. Until the end of the 17th century Sekovici was a well-inhabited area, till army invasions and different diseases decreased the population of Šekovići and almost wiped out the first people living there. Soon after that the new inhabitants from Herzegovina settled in Šekovići and they make up most of today’s populations. One of the first settlers beginning XVII left Šekovići, Ilija Birčanin, Hadži Milentije and Prote Matije Nenadović. Because of the family and other ties through the monastery this region had strong military cooperation with Serbia during the First Serbian Uprising. Ivan Groznog's mother Jelica Jakšić Glinska is from Šekovići and because of the Monastery Papraća and Russian Czar Palace had a good relationship. Monastery Lovnica and Papraca in the past were significant cultural and freedom centers. From the 16th century these two monasteries had ties with Russia, and monasteries in Serbia, Poland and Vlachs. Šekovići have special places in NOB (Serbian: Narodno Oslobodilacka Borba, English:Peoples Freedom Fight), they belong to one of the first uprising regions in Yugoslavia. In Šekovići were formed the Prva Bircanslka Brigada (First Birac Brigate), Sesta Istocnobosanska Brigada (Sixst Estern Bosnian Brigate) and Prva Pionirska Divizija ( First Pionir Division). In 1943, Sekovici was the military, political and cultural center for eastern Bosnia, according to author Rudi Petovara. Inside of it was the highest military and political leadership for Eastern Bosnia.
Demographics
Population
| Population of settlement – Šekovići municipality | |||||
|---|---|---|---|---|---|
| Settlement | 1071. | 1981. | 1991. | 2013. | |
| Total | 10,570 | 10,356 | 9,639 | 6,761 | |
| 1 | Ašćerići | 226 | 228 | ||
| 2 | Džanojevići | 351 | 225 | ||
| 3 | Šekovići | 541 | 1,230 | 1,735 | 1,519 |
| 4 | Stupari | 368 | 299 | ||
| 5 | Sučani | 562 | 626 | ||
| 6 | Tepen | 193 | 353 | ||
| 7 | Udbina | 781 | 694 | ||
| 8 | Velika Njiva | 512 | 293 | ||
Ethnic composition
| Ethnic composition – Šekovići town | |||||||
|---|---|---|---|---|---|---|---|
| 2013. | 1991. | 1981. | 1971. | ||||
| Total | 1,519 (100,0%) | 1,735 (100,0%) | 1,230 (100,0%) | 541 (100,0%) | |||
| Serbs | 1,606 (92,56%) | 1,059 (86,10%) | 520 (96,12%) | ||||
| Yugoslavs | 80 (4,611%) | 90 (7,317%) | |||||
| Others | 27 (1,556%) | 1 (0,081%) | |||||
| Bosniaks | 17 (0,980%) | 32 (2,602%) | 10 (1,848%) | ||||
| Croats | 5 (0,288%) | 12 (0,976%) | 5 (0,924%) | ||||
| Montenegrins | 22 (1,789%) | 3 (0,555%) | |||||
| Albanians | 12 (0,976%) | 2 (0,370%) | |||||
| Macedonians | 1 (0,081%) | ||||||
| Hungarians | 1 (0,081%) | 1 (0,185%) | |||||
| Ethnic composition – Šekovići municipality | |||||||
|---|---|---|---|---|---|---|---|
| 2013. | 1991. | 1981. | 1971. | ||||
| Total | 6 761 (100,0%) | 9 629 (100,0%) | 10 356 (100,0%) | 10 570 (100,0%) | |||
| Serbs | 6 618 (97,88%) | 9 030 (93,78%) | 9 753 (94,18%) | 10 241 (96,89%) | |||
| Bosniaks | 107 (1,583%) | 326 (3,386%) | 304 (2,935%) | 286 (2,706%) | |||
| Others | 28 (0,414%) | 134 (1,392%) | 31 (0,299%) | 25 (0,237%) | |||
| Croats | 8 (0,118%) | 10 (0,104%) | 15 (0,145%) | 6 (0,057%) | |||
| Yugoslavs | 129 (1,340%) | 208 (2,008%) | 2 (0,019%) | ||||
| Montenegrins | 30 (0,290%) | 5 (0,047%) | |||||
| Albanians | 13 (0,126%) | 3 (0,028%) | |||||
| Macedonians | 1 (0,010%) | 1 (0,009%) | |||||
| Hungarians | 1 (0,010%) | 1 (0,009%) | |||||
Economy
The following table gives a preview of total number of registered people employed in legal entities per their core activity (as of 2018):[1]
| Activity | Total |
|---|---|
| Agriculture, forestry and fishing | 50 |
| Mining and quarrying | - |
| Manufacturing | 302 |
| Electricity, gas, steam and air conditioning supply | 20 |
| Water supply; sewerage, waste management and remediation activities | 12 |
| Construction | 3 |
| Wholesale and retail trade, repair of motor vehicles and motorcycles | 79 |
| Transportation and storage | 24 |
| Accommodation and food services | 36 |
| Information and communication | 2 |
| Financial and insurance activities | 5 |
| Real estate activities | - |
| Professional, scientific and technical activities | 7 |
| Administrative and support service activities | 2 |
| Public administration and defense; compulsory social security | 97 |
| Education | 120 |
| Human health and social work activities | 38 |
| Arts, entertainment and recreation | 9 |
| Other service activities | 6 |
| Total | 812 |
See also
References
- "Cities and Municipalities of Republika Srpska" (PDF). rzs.rs.ba. Republika Srspka Institute of Statistics. 25 December 2019. Retrieved 31 December 2019.