Powder River County, Montana
Powder River County is a county in the U.S. state of Montana. As of the 2010 United States Census, the population was 1,743.[2] Its county seat is Broadus.[3]
Powder River County | |
|---|---|
 Powder River Courthouse in Broadus | |
 Location within the U.S. state of Montana | |
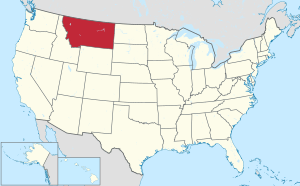 Montana's location within the U.S. | |
| Coordinates: 45°23′N 105°38′W | |
| Country | |
| State | |
| Founded | March 17, 1919[1] |
| Named for | Powder River |
| Seat | Broadus |
| Largest town | Broadus |
| Area | |
| • Total | 3,298 sq mi (8,540 km2) |
| • Land | 3,297 sq mi (8,540 km2) |
| • Water | 0.6 sq mi (2 km2) 0.02% |
| Population (2010) | |
| • Total | 1,743 |
| • Estimate (2018) | 1,716 |
| • Density | 0.53/sq mi (0.20/km2) |
| Time zone | UTC−7 (Mountain) |
| • Summer (DST) | UTC−6 (MDT) |
| Congressional district | At-large |
| Website | www |
| |
History
Powder River County's area was probably first entered by Europeans when French trappers worked its streams in the early 1800s. In 1865 the federal government sent soldiers (Powder River Expedition) to the Powder River country to combat Native Americans from the Cheyenne, Lakota Sioux, and Arapaho tribes. September 1865 saw several skirmishes (Powder River Battles) near present-day Broadus.[4] On March 17, 1876, the Battle of Powder River occurred in the south-central part of the county, about 34 miles (55 km) southwest of Broadus.[5]
Powderville was the area's first established settlement; it began operating on November 1, 1878 as the Powder River Telegraph Station on a line connecting Fort Keogh to Deadwood, South Dakota.[6] On April 5, 1879, the Mizpah Creek Incidents began near the Powderville telegraph station.
Custer County was organized in early 1877, consisting of most of SE Montana Territory. In February 1900, the Broadus Post Office opened. In October 1918 the first edition of the area's first newspaper[7] appeared. On March 17, 1919, Powder River County was formed from southern Custer County. In a 1920 election, Broadus was chosen as the county seat.
Geography
According to the US Census Bureau, the county has a total area of 3,298 square miles (8,540 km2), of which 3,297 square miles (8,540 km2) is land and 0.6 square miles (1.6 km2) (0.02%) is water.[8]
Major highways


Adjacent counties
- Custer County - north
- Carter County - east
- Crook County, Wyoming - southeast
- Campbell County, Wyoming - south
- Sheridan County, Wyoming - southwest
- Big Horn County - west
- Rosebud County - northwest
National protected area
- Custer National Forest (part)
Demographics
| Historical population | |||
|---|---|---|---|
| Census | Pop. | %± | |
| 1920 | 3,357 | — | |
| 1930 | 3,909 | 16.4% | |
| 1940 | 3,159 | −19.2% | |
| 1950 | 2,693 | −14.8% | |
| 1960 | 2,485 | −7.7% | |
| 1970 | 2,862 | 15.2% | |
| 1980 | 2,520 | −11.9% | |
| 1990 | 2,090 | −17.1% | |
| 2000 | 1,858 | −11.1% | |
| 2010 | 1,743 | −6.2% | |
| Est. 2018 | 1,716 | [9] | −1.5% |
| US Decennial Census[10] 1790-1960[11] 1900-1990[12] 1990-2000[13] 2010-2018[2] | |||
2000 census
As of the 2000 United States Census,[14] there were 1,858 people, 737 households, and 524 families in the county. The population density was <1/km² (<1/sq mi). There were 1,007 housing units at an average density of <1/km² (<1/sq mi). The racial makeup of the county was 97.42% White, 1.78% Native American, 0.11% Asian, 0.22% from other races, and 0.48% from two or more races. 0.59% of the population were Hispanic or Latino of any race. 33.2% were of German, 13.8% English, 10.7% Irish and 5.9% Norwegian ancestry.
There were 737 households out of which 30.70% had children under the age of 18 living with them, 64.90% were married couples living together, 4.10% had a female householder with no husband present, and 28.80% were non-families. 24.80% of all households were made up of individuals and 9.90% had someone living alone who was 65 years of age or older. The average household size was 2.48 and the average family size was 2.99.
The county population contained 26.60% under the age of 18, 4.80% from 18 to 24, 23.30% from 25 to 44, 26.80% from 45 to 64, and 18.50% who were 65 years of age or older. The median age was 42 years. For every 100 females there were 97.20 males. For every 100 females age 18 and over, there were 95.40 males.
The median income for a household in the county was $28,398, and the median income for a family was $34,671. Males had a median income of $23,971 versus $17,411 for females. The per capita income for the county was $15,351. About 9.90% of families and 12.90% of the population were below the poverty line, including 12.70% of those under age 18 and 16.30% of those age 65 or over.
2010 census
In the 2010 United States Census, there were 1,743 people, 755 households, and 505 families in the county.[15] The population density was 0.5 inhabitants per square mile (0.19/km2). There were 1,022 housing units at an average density of 0.3 per square mile (0.12/km2).[16] The racial makeup of the county was 95.0% white, 1.5% American Indian, 0.2% Asian, 0.1% black or African American, 1.1% from other races, and 2.1% from two or more races. Those of Hispanic or Latino origin made up 1.4% of the population.[15] In terms of ancestry, 34.6% were German, 31.0% were American, 15.1% were English, 14.0% were Irish, and 8.6% were Norwegian.[17]
Of the 755 households, 26.5% had children under the age of 18 living with them, 58.1% were married couples living together, 5.0% had a female householder with no husband present, 33.1% were non-families, and 28.3% of all households were made up of individuals. The average household size was 2.26 and the average family size was 2.76. The median age was 49.3 years.[15]
The median income for a household in the county was $37,685 and the median income for a family was $50,156. Males had a median income of $27,721 versus $26,250 for females. The per capita income for the county was $21,543. About 11.6% of families and 14.1% of the population were below the poverty line, including 15.7% of those under age 18 and 11.7% of those age 65 or over.<ref">"Selected Economic Characteristics – 2006-2010 American Community Survey 5-Year Estimates". US Census Bureau. Archived from the original on February 13, 2020. Retrieved January 10, 2016.</ref>
Politics
Powder River County is heavily Republican; it has voted Republican in every presidential election since 1940.
| Year | Republican | Democratic | Third parties |
|---|---|---|---|
| 2016 | 84.0% 884 | 12.1% 127 | 4.0% 42 |
| 2012 | 81.1% 833 | 16.6% 170 | 2.3% 24 |
| 2008 | 77.3% 802 | 20.0% 208 | 2.7% 28 |
| 2004 | 83.2% 856 | 15.0% 154 | 1.9% 19 |
| 2000 | 85.3% 860 | 11.4% 115 | 3.3% 33 |
| 1996 | 63.4% 663 | 22.6% 236 | 14.0% 146 |
| 1992 | 47.3% 547 | 22.3% 258 | 30.4% 351 |
| 1988 | 66.2% 815 | 32.1% 395 | 1.8% 22 |
| 1984 | 74.6% 1,066 | 24.2% 346 | 1.2% 17 |
| 1980 | 68.3% 985 | 23.3% 336 | 8.5% 122 |
| 1976 | 55.3% 683 | 34.7% 429 | 10.0% 123 |
| 1972 | 69.4% 844 | 21.9% 267 | 8.7% 106 |
| 1968 | 65.0% 699 | 24.0% 258 | 11.1% 119 |
| 1964 | 59.1% 649 | 40.9% 449 | 0.1% 1 |
| 1960 | 60.2% 665 | 39.6% 438 | 0.2% 2 |
| 1956 | 60.6% 700 | 39.5% 456 | 0.0% 0 |
| 1952 | 72.7% 888 | 26.8% 327 | 0.6% 7 |
| 1948 | 60.2% 784 | 36.8% 480 | 3.0% 39 |
| 1944 | 57.2% 650 | 41.9% 476 | 1.0% 11 |
| 1940 | 52.2% 633 | 46.3% 561 | 1.5% 18 |
| 1936 | 40.4% 545 | 56.2% 758 | 3.4% 46 |
| 1932 | 35.5% 515 | 60.3% 875 | 4.1% 60 |
| 1928 | 65.1% 780 | 34.2% 410 | 0.8% 9 |
| 1924 | 48.7% 480 | 12.5% 123 | 38.8% 383 |
| 1920 | 71.3% 955 | 24.6% 330 | 4.1% 55 |
Communities
Town
- Broadus (county seat)
Census-designated place
Unincorporated communities
- Bay Horse[19]
- Belle Creek
- Cameron Crossing[20]
- Coalwood
- Elkhorn Crossing
- Epsie
- Moorhead
- Olive
- Otter
- Powderville
- Sayle[21]
- Sonnette
- Willow Crossing[22]
Notable residents
- Lee Randall, Republican member of the Montana House of Representatives (2009–2017)
- Jess Lockwood, 2017 and 2019 PBR World champion
- Ronnie Rossen, World Champion PRCA Bull rider (1961, 1966)
- Jason Evans, 6-time National Steer Roping Finals qualifier
See also
- Fort Howes
- List of lakes in Powder River County, Montana
- List of mountains in Powder River County, Montana
- National Register of Historic Places listings in Powder River County MT
References
- "Powder River County, Montana". www.prco.mt.gov. Archived from the original on June 14, 2018. Retrieved April 3, 2018.
- "State & County QuickFacts". US Census Bureau. Archived from the original on December 22, 2015. Retrieved September 16, 2013.
- "Find a County". National Association of Counties. Retrieved June 7, 2011.
- Wagner, David E. (2009). Powder River Odyssey: Nelson Cole's Western Campaign of 1865, The Journals of Lyman G. Bennett and Other Eyewitness Accounts. Arthur H. Clark Co.
- Vaughn, J.W. (1961). The Reynolds Campaign on Powder River. University of Oklahoma Press.
- Powderville: A Personal History.
- The Broadus Independent, now called Powder River Examiner.
- "2010 Census Gazetteer Files". US Census Bureau. August 22, 2012. Archived from the original on December 5, 2014. Retrieved November 29, 2014.
- "Population and Housing Unit Estimates". Retrieved August 6, 2019.
- "US Decennial Census". US Census Bureau. Retrieved November 29, 2014.
- "Historical Census Browser". University of Virginia Library. Retrieved November 29, 2014.
- "Population of Counties by Decennial Census: 1900 to 1990". US Census Bureau. Retrieved November 29, 2014.
- "Census 2000 PHC-T-4. Ranking Tables for Counties: 1990 and 2000" (PDF). US Census Bureau. Retrieved November 29, 2014.
- "U.S. Census website". US Census Bureau. Retrieved January 31, 2008.
- "Profile of General Population and Housing Characteristics: 2010 Demographic Profile Data". US Census Bureau. Archived from the original on February 13, 2020. Retrieved January 10, 2016.
- "Population, Housing Units, Area, and Density: 2010 - County". US Census Bureau. Archived from the original on February 13, 2020. Retrieved January 10, 2016.
- "Selected Social Characteristics in the US – 2006-2010 American Community Survey 5-Year Estimates". US Census Bureau. Archived from the original on February 13, 2020. Retrieved January 10, 2016.
- Leip, David. "Atlas of US Presidential Elections". uselectionatlas.org. Retrieved April 3, 2018.
- Bay Horse MT Google Maps (accessed 4 January 2019)
- Cameron Crossing MT Google Maps (accessed 4 January 2019)
- Sayle MT Google Maps (accessed 4 January 2019)
- Willow Crossing MT Google Maps (accessed 4 January 2019)
Places adjacent to Powder River County, Montana | ||||||||||
|---|---|---|---|---|---|---|---|---|---|---|
| ||||||||||
Municipalities and communities of Powder River County, Montana, United States | ||
|---|---|---|
| Town | Powder River County map | |
| CDP | ||
| Other unincorporated communities | ||
| Authority control |
|
|---|