New York's 18th congressional district
The 18th congressional district of New York is a congressional district for the United States House of Representatives in the northern suburbs and exurbs of New York City. It is currently represented by Democrat Sean Patrick Maloney.
| New York's 18th congressional district | |||
|---|---|---|---|
.tif.png) New York's 18th congressional district since January 3, 2013 | |||
| Representative |
| ||
| Distribution |
| ||
| Population (2018 ACS est.) | 722,226 | ||
| Median income | $86,211[1] | ||
| Cook PVI | R+1[2] | ||
The 18th district includes all of Orange County and Putnam County, as well as parts of southern Dutchess County and northeastern Westchester County. The district includes Newburgh, Beacon and Poughkeepsie.[3]
From 2002-2013, the 18th district included most of Westchester County and part of Rockland County. It included Larchmont, Mamaroneck, New Rochelle, Ossining, the Town of Pelham, Scarsdale, Tarrytown, White Plains as well as most of New City and Yonkers.
The redrawn district is composed of the following percentages of voters of the 2003-2013 congressional districts: 1 percent from the 18th congressional district; 76 percent from the 19th congressional district; 2 percent from the 20th congressional district; and 21 percent from the 22nd congressional district.[4]
Recent election results from statewide races
| Year | Office | Results |
|---|---|---|
| 1992 | President | Clinton 50 - 40% |
| 1996 | President | Clinton 58 - 35% |
| 2000 | President | Gore 58 - 39% |
| 2004 | President | Kerry 58 - 42% |
| 2008 | President | Obama 62 - 38% |
| 2012 | President | Obama 51.4 - 47.1% |
| 2016 | President | Trump 49.0 - 47.1% |
Components: past and present
The 18th District was created in 1813. For many years it was the upper Manhattan district. It was the east side Manhattan seat in the 1970s and then a Bronx district in the 1980s, Following the 1992 remap it became a Westchester-based district with narrow corridor through the Bronx and a large portion of central Queens. The 2002 remap gave those Queens areas to the 5th District and the 18th absorbed some Rockland areas due to the deconstruction of the old Orange-Rockland 20th District. In 2012, population lost in New York pushed the district further north, into the mid-Hudson Valley suburbs.
2013–Present: (map)
- All of Orange and Putnam
- Parts of Dutchess and Westchester
2003–2013:
- Parts of Rockland, Westchester
1993–2003:
- Parts of Bronx, Queens, Westchester
1983–1993:
- Parts of Bronx
1913–1983:
- Parts of Manhattan
1853–1873:
List of members representing the district
| Representative | Party | Years | Cong ress |
Electoral history | Location |
|---|---|---|---|---|---|
| District created | March 4, 1813 | ||||
 Moss Kent |
Federalist | March 4, 1813 – March 3, 1817 |
13th 14th |
Elected in 1812. Re-elected in 1814. [data unknown/missing] |
1813–1823 St. Lawrence, Jefferson and Lewis counties |
 David A. Ogden |
Federalist | March 4, 1817 – March 3, 1819 |
15th | Elected in 1816. Lost re-election. | |
| William Donnison Ford | Democratic-Republican | March 4, 1819 – March 3, 1821 |
16th | Elected in 1818. [data unknown/missing] | |
| Vacant | March 4, 1821 – December 3, 1821 |
17th | Elections were held in April 1821. It is unclear when results were announced or credentials issued. | ||
| Micah Sterling | Federalist | December 3, 1821 – March 3, 1823 |
Elected in 1821. [data unknown/missing] | ||
| Henry C. Martindale | Adams-Clay Democratic-Republican | March 4, 1823 – March 3, 1825 |
18th 19th 20th 21st |
Elected in 1822. [data unknown/missing] |
1823–1833 Washington County |
| Anti-Jacksonian | March 4, 1825 – March 3, 1831 | ||||
| Nathaniel Pitcher | Jacksonian | March 4, 1831 – March 3, 1833 |
22nd | [data unknown/missing] | |
.jpg) Daniel Wardwell |
Jacksonian | March 4, 1833 – March 3, 1837 |
23rd 24th |
Redistricted from the 20th district and re-elected in 1832. [data unknown/missing] |
1833–1843 [data unknown/missing] |
| Isaac H. Bronson | Democratic | March 4, 1837 – March 3, 1839 |
25th | [data unknown/missing] | |
| Thomas C. Chittenden | Whig | March 4, 1839 – March 3, 1843 |
26th 27th |
[data unknown/missing] | |
 Preston King |
Democratic | March 4, 1843 – March 3, 1847 |
28th 29th |
[data unknown/missing] | 1843–1853 [data unknown/missing] |
.jpg) William Collins |
Democratic | March 4, 1847 – March 3, 1849 |
30th | [data unknown/missing] | |
Preston King |
Free Soil | March 4, 1849 – March 3, 1853 |
31st 32nd |
[data unknown/missing] | |
.jpg) Peter Rowe |
Democratic | March 4, 1853 – March 3, 1855 |
33rd | [data unknown/missing] | 1853–1863 [data unknown/missing] |
| Thomas R. Horton | Opposition | March 4, 1855 – March 3, 1857 |
34th | [data unknown/missing] | |
 Clark B. Cochrane |
Republican | March 4, 1857 – March 3, 1861 |
35th 36th |
[data unknown/missing] | |
 Chauncey Vibbard |
Democratic | March 4, 1861 – March 3, 1863 |
37th | [data unknown/missing] | |
 James M. Marvin |
Republican | March 4, 1863 – March 3, 1869 |
38th 39th 40th |
[data unknown/missing] | 1863–1873 [data unknown/missing] |
.jpg) Stephen Sanford |
Republican | March 4, 1869 – March 3, 1871 |
41st | [data unknown/missing] | |
 John M. Carroll |
Democratic | March 4, 1871 – March 3, 1873 |
42nd | [data unknown/missing] | |
 William A. Wheeler |
Republican | March 4, 1873 – March 3, 1875 |
43rd | [data unknown/missing] Redistricted to the 19th district. |
1873–1883 [data unknown/missing] |
.jpg) Andrew Williams |
Republican | March 4, 1875 – March 3, 1879 |
44th 45th |
[data unknown/missing] | |
_2.jpg) John Hammond |
Republican | March 4, 1879 – March 3, 1883 |
46th 47th |
[data unknown/missing] | |
| Frederick A. Johnson | Republican | March 4, 1883 – March 3, 1885 |
48th | [data unknown/missing] Redistricted to the 21st district. |
1883–1893 [data unknown/missing] |
 Henry G. Burleigh |
Republican | March 4, 1885 – March 3, 1887 |
49th | Redistricted from the 17th district and re-elected in 1884. [data unknown/missing] | |
| Edward W. Greenman | Democratic | March 4, 1887 – March 3, 1889 |
50th | [data unknown/missing] | |
| John A. Quackenbush | Republican | March 4, 1889 – March 3, 1893 |
51st 52nd |
[data unknown/missing] | |
 Jacob LeFever |
Republican | March 4, 1893 – March 3, 1897 |
53rd 54th |
[data unknown/missing] | 1893–1903 [data unknown/missing] |
 John H. Ketcham |
Republican | March 4, 1897 – March 3, 1903 |
55th 56th 57th |
[data unknown/missing] Redistricted to the 21st district. | |
 Joseph A. Goulden |
Democratic | March 4, 1903 – March 3, 1911 |
58th 59th 60th 61st |
[data unknown/missing] | 1903–1913 [data unknown/missing] |
 Stephen B. Ayres |
Independent Democrat | March 4, 1911 – March 3, 1913 |
62nd | [data unknown/missing] | |
 Thomas G. Patten |
Democratic | March 4, 1913 – March 3, 1917 |
63rd 64th |
Redistricted from the 15th district and re-elected in 1912. [data unknown/missing] |
1913–1933 [data unknown/missing] |
| George B. Francis | Republican | March 4, 1917 – March 3, 1919 |
65th | [data unknown/missing] | |
 John F. Carew |
Democratic | March 4, 1919 – December 28, 1929 |
66th 67th 68th 69th 70th 71st |
Redistricted from the 17th district and re-elected in 1918. Resigned to become justice in Supreme Court of New York | |
| Vacant | December 28, 1929 – April 11, 1930 |
71st | |||
 Martin J. Kennedy |
Democratic | April 11, 1930 – January 3, 1945 |
71st 72nd 73rd 74th 75th 76th 77th 78th |
Elected to finish Carew's term. [data unknown/missing] | |
| 1933–1943 [data unknown/missing] | |||||
| 1943–1953 [data unknown/missing] | |||||
_2.jpg) Vito Marcantonio |
American Labor | January 3, 1945 – January 3, 1951 |
79th 80th 81st |
Redistricted from the 20th district and re-elected in 1944. [data unknown/missing] | |
 James G. Donovan |
Democratic | January 3, 1951 – January 3, 1957 |
82nd 83rd 84th |
[data unknown/missing] | |
| 1953–1963 [data unknown/missing] | |||||
 Alfred E. Santangelo |
Democratic | January 3, 1957 – January 3, 1963 |
85th 86th 87th |
[data unknown/missing] | |
 Adam Clayton Powell Jr. |
Democratic | January 3, 1963 – January 3, 1971 |
88th 89th 90th 91st |
Redistricted from the 16th district and re-elected in 1962. Lost re-nomination. |
1963–1973 [data unknown/missing] |
 Charles Rangel |
Democratic | January 3, 1971 – January 3, 1973 |
92nd | [data unknown/missing] Redistricted to the 19th district. | |
 Ed Koch |
Democratic | January 3, 1973 – December 31, 1977 |
93rd 94th 95th |
Redistricted from the 17th district and re-elected in 1972. Resigned to become Mayor of New York City. |
1973–1983 [data unknown/missing] |
| Vacant | January 1, 1978 – February 13, 1978 |
95th | |||
 Bill Green |
Republican | February 14, 1978 – January 3, 1983 |
95th 96th 97th |
Elected to finish Koch's term. Redistricted to the 15th district. | |
 Robert Garcia |
Democratic | January 3, 1983 – January 7, 1990 |
98th 99th 100th 101st |
Redistricted from the 21st district and re-elected in 1982. Resigned. |
1983–1993 [data unknown/missing] |
| Vacant | January 8, 1990 – March 19, 1990 |
101st | |||
 José E. Serrano |
Democratic | March 20, 1990 – January 3, 1993 |
101st 102nd |
Elected to finish Garcia's term. Redistricted to the 16th district. | |
 Nita Lowey |
Democratic | January 3, 1993 – January 3, 2013 |
103rd 104th 105th 106th 107th 108th 109th 110th 111th 112th 113th |
Redistricted from the 20th district and re-elected in 1992. Redistricted to the 17th district. |
1993–2003 [data unknown/missing] |
2003–2013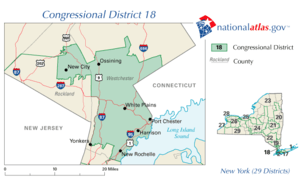 | |||||
 Sean Patrick Maloney |
Democratic | January 3, 2013 – Present |
113th 114th 115th 116th |
Elected in 2012. Re-elected in 2014. Re-elected in 2016. Re-elected in 2018. |
2013–present.tif.png) |
Recent election results
Note that in New York State electoral politics there are numerous minor parties at various points on the political spectrum. Certain parties will invariably endorse either the Republican or Democratic candidate for every office, hence the state electoral results contain both the party votes, and the final candidate votes (Listed as "Recap").
| Party | Candidate | Votes | % | ± | |
|---|---|---|---|---|---|
| Democratic | Nita Lowey (Incumbent) | 118,194 | 63.6% | ||
| Republican | Kerry J. Katsorhis | 59,487 | 32.0% | ||
| Independence | Concetta M. Ferrara | 4,283 | 2.3% | ||
| Right to Life | Florence T. O'Grady | 3,758 | 2.0% | ||
| Majority | 58,707 | 31.6% | |||
| Turnout | 185,722 | 100% | |||
| Party | Candidate | Votes | % | ± | |
|---|---|---|---|---|---|
| Democratic | Nita Lowey (Incumbent) | 91,623 | 82.8% | +19.2% | |
| Conservative | Daniel McMahon | 12,594 | 11.4% | +11.4% | |
| Independence | Giulio A. Cavallo | 3,251 | 2.9% | +0.6% | |
| Right to Life | Marion M. Conner | 3,234 | 2.9% | +0.9% | |
| Majority | 79,029 | 71.4% | +39.8% | ||
| Turnout | 110,702 | 100% | -40.4% | ||
| Party | Candidate | Votes | % | ± | |
|---|---|---|---|---|---|
| Democratic | Nita Lowey (Incumbent) | 126,878 | 67.3% | -15.5% | |
| Republican | John G. Vonglis | 58,022 | 30.8% | +30.8% | |
| Right to Life | Florence T. O'Grady | 3,747 | 2.0% | -0.9% | |
| Majority | 68,856 | 36.5% | +34.9% | ||
| Turnout | 188,647 | 100% | +70.4% | ||
| Party | Candidate | Votes | % | ± | |
|---|---|---|---|---|---|
| Democratic | Nita Lowey (Incumbent) | 98,957 | 92.0% | +24.7% | |
| Right to Life | Michael J. Reynolds | 8,558 | 8.0% | +6.0% | |
| Majority | 90,399 | 84.1% | +47.6% | ||
| Turnout | 107,515 | 100% | -43.0% | ||
| Party | Candidate | Votes | % | ± | |
|---|---|---|---|---|---|
| Democratic | Nita Lowey (Incumbent) | 170,715 | 69.8% | -22.2% | |
| Republican | Richard A. Hoffman | 73,975 | 30.2% | +30.2% | |
| Majority | 96,740 | 39.5% | -44.6% | ||
| Turnout | 244,690 | 100% | +127.6% | ||
| Party | Candidate | Votes | % | ± | |
|---|---|---|---|---|---|
| Democratic | Nita Lowey (Incumbent) | 124,256 | 70.7% | +0.9% | |
| Republican | Richard A. Hoffman | 51,450 | 29.3% | -0.9% | |
| Majority | 72,806 | 41.4% | +1.9% | ||
| Turnout | 175,706 | 100% | -28.2% | ||
| Party | Candidate | Votes | % | ± | |
|---|---|---|---|---|---|
| Democratic | Nita Lowey (Incumbent) | 174,791 | 68.5% | -2.2% | |
| Republican | Jim Russell | 80,498 | 29.3% | -0.9% | |
| Majority | 94,293 | 41.4% | +29.5% | ||
| Turnout | 255,289 | 100% | +45.3% | ||
| Party | Candidate | Votes | % | ± | |
|---|---|---|---|---|---|
| Democratic | Nita Lowey (Incumbent) | 114,810 | 58.2% | -10.3% | |
| Republican | Jim Russell | 70,015 | 35.5% | +6.2% | |
| Majority | 44,795 | 22.7% | -18.7% | ||
| Turnout | 197,212 | 100% | -23.8% | ||
| Party | Candidate | Votes | % | ± | ||
|---|---|---|---|---|---|---|
| Democratic | Sean Patrick Maloney | 130,462 | 51.7% | -6.5 | ||
| Republican | Nan Hayworth (Incumbent) | 121,911 | 48.3% | +12.8 | ||
| Majority | 8,551 | 3.5% | -19.2 | |||
| Turnout | 252,373 | 100% | +21.9 | |||
| Democratic gain from Republican | ||||||
| Party | Candidate | Votes | % | ± | |
|---|---|---|---|---|---|
| Democratic | Sean Patrick Maloney (Incumbent) | 84,415 | 47.6% | -4.1 | |
| Republican | Nan Hayworth | 81,625 | 46.0% | -2.3 | |
| style="background-color: Template:Send Mr. Smith (US)/meta/color; width: 5px;" | | Template:Send Mr. Smith (US)/meta/shortname | Scott Smith | 4,924 | 2.3% | |
| Majority | 2,790 | 1.6% | -1.9 | ||
| Turnout | 177,424 | 100% | -29.7 | ||
| Party | Candidate | Votes | % | ± | |
|---|---|---|---|---|---|
| Democratic | Sean Patrick Maloney (Incumbent) | 162,060 | 55.6% | +8.0 | |
| Republican | Phil Oliva | 129,369 | 44.0% | -1.6 | |
| Majority | 32,691 | 11.6% | +10.0 | ||
| Turnout | 291,429 | 100% | +64.4 | ||
| Party | Candidate | Votes | % | ± | |
|---|---|---|---|---|---|
| Democratic | Sean Patrick Maloney (Incumbent) | 139,564 | 55.5% | -0.1 | |
| Republican | James O'Donnell | 112,035 | 44.5% | +0.5 | |
| Majority | 27,529 | 11.0% | -0.6 | ||
| Turnout | 251,599 | 100% | -13.8 | ||
See also
Notes
- https://www.census.gov/mycd/?st=36&cd=18
- "Partisan Voting Index – Districts of the 115th Congress" (PDF). The Cook Political Report. April 7, 2017. Retrieved April 7, 2017.
- , Detailed Map of Congressional District 18
- "Congressional District Comparison"
- "NYS Board of Elections Rep. in Congress Election Returns Nov. 8, 2016" (PDF). New York Board of Elections. State of New York. Retrieved 4 September 2019.
- "Certified Results from the November 6, 2018 General Election for U.S. Congress" (PDF). New York Board of Elections. State of New York. Retrieved 4 September 2019.
External links
References
- Martis, Kenneth C. (1989). The Historical Atlas of Political Parties in the United States Congress. New York: Macmillan Publishing Company.
- Martis, Kenneth C. (1982). The Historical Atlas of United States Congressional Districts. New York: Macmillan Publishing Company.
- Congressional Biographical Directory of the United States 1774–present
- 2004 House election data Clerk of the House of Representatives
- 2002 House election data "
- 2000 House election data "
- 1998 House election data "
- 1996 House election data "