Miramichi (electoral district)
Northumberland (later known as Northumberland-Miramichi) was a federal electoral district in New Brunswick, Canada, that was represented in the Canadian House of Commons from 1867 to 1988. It was replaced by Miramichi riding, which has been represented in the House of Commons since 1988. Its population in 2006 was 53,844.
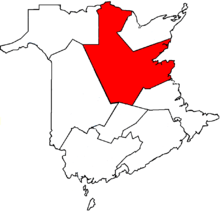 Miramichi in relation to other New Brunswick federal electoral districts | |
| Coordinates: | 47.08°N 65.730°W |
| Defunct federal electoral district | |
| Legislature | House of Commons |
| District created | 1867 |
| District abolished | 2013 |
| First contested | 1867 |
| Last contested | 2011 |
| District webpage | profile, map |
| Demographics | |
| Population (2011)[1] | 51,996 |
| Electors (2011) | 44,113 |
| Area (km²)[2] | 14,237.62 |
| Census divisions | Kent, Northumberland, Restigouche |
| Census subdivisions | Miramichi, Alnwick, Hardwicke, Northesk, Blackville |
Miramichi is named for the river and city of the same name.
Geography
The riding currently contains the entirety of Northumberland County, plus the Belledune area, several bedroom communities for Bathurst, and the area around Kouchibouguac National Park. The riding is mostly anglophone with a significant francophone minority.
The neighbouring ridings are Fredericton, Beauséjour, Acadie—Bathurst, Gaspésie—Îles-de-la-Madeleine, Madawaska—Restigouche, and Tobique—Mactaquac.
| Year | Pop. | ±% |
|---|---|---|
| 2001 | 63,001 | — |
| 2006 | 53,844 | −14.5% |
| 2011 | 51,996 | −3.4% |
Northumberland/Northumberland—Miramichi
The riding was created in 1867 as "Northumberland" riding, but in 1914 the same name was given to a riding in Ontario. In 1955 this inconvenience was relieved by renaming the New Brunswick riding to "Northumberland—Miramichi".[3] Until 1966, Northumberland—Miramichi consisted solely of Northumberland County, but due to declining populations, parts of northern Kent County, near present-day Kouchibouguac National Park, were added. In 1987, Northumberland—Miramichi was abolished when it was redistributed into Miramichi and Beauséjour ridings.
Miramichi
Miramichi riding was created in 1987 primarily from Northumberland—Miramichi riding, and incorporating parts of Acadie—Bathurst, Madawaska—Restigouche and York—Sunbury ridings.
Between 1987 and 1996, Miramichi also included a small part of York County, and in 2003, a large area to the north, including Allardville and Belledune, was added to the riding.
In 2004, there were legal problems regarding the 2003 boundaries. The following is from the Elections Canada website:
- In May 2004, the Federal Court of Canada made its decision in Raîche v. Canada (Attorney General), concerning a portion of the electoral boundary between the ridings of Miramichi and Acadie—Bathurst. The Court held that in transferring certain parts of parishes from the riding of Acadie–Bathurst to Miramichi, the Federal Electoral Boundaries Commission for New Brunswick erred in its application of the rules governing the preparation of its recommendations. The new boundaries commission was created under Part I of the Inquiries Act in response to this court decision.
The current boundaries reverted to the ones used in the 1996 representation after the 2006 election. As per the 2012 federal electoral redistribution, this riding will be dissolved, with most of its territory going to the new riding of Miramichi—Grand Lake, with some parts going to Acadie—Bathurst and Madawaska—Restigouche.
Federal riding associations
Riding associations are the local branches of the national political parties:
| Party | Association Name | CEO | HQ Address | HQ City | |
| Green | Miramichi Federal Green Party Association | Ronald Mazerolle | 223 Old Station Road | Miramichi | |
| Conservative Party of Canada | Miramichi Conservative Association | Thomas Jennings | 77 Travis Street | Miramichi | |
| Liberal Party of Canada | Miramichi Federal Liberal Association | Robert Hutchison | 2 Bridget Street | Miramichi | |
| New Democratic Party | Miramichi Federal NDP Riding Association | Oscar Doucet | 5064 Route 480 | Acadieville | |
Members of Parliament
This riding elected the following Members of Parliament:
Election results
Miramichi, 2003 Representation Order
| 2011 Canadian federal election | ||||||||
|---|---|---|---|---|---|---|---|---|
| Party | Candidate | Votes | % | ±% | Expenditures | |||
| Conservative | Tilly O'Neill-Gordon | 16,112 | 52.36 | +10.29 | $65,248.98 | |||
| New Democratic | Patrick Colford | 7,097 | 23.06 | +5.95 | $3,027.50 | |||
| Liberal | Keith Vickers | 6,800 | 22.10 | -14.85 | $42,704.81 | |||
| Green | Ron Mazerolle | 735 | 2.39 | -1.46 | $1,101.75 | |||
| Total valid votes/Expense limit | 30,774 | 100.0 | $80,868.15 | |||||
| Total rejected, unmarked and declined ballots | 348 | 1.12 | -0.12 | |||||
| Turnout | 31,092 | 71.40 | +5.62 | |||||
| Eligible voters | 43,547 | |||||||
| Conservative hold | Swing | +2.17 | ||||||
| Sources:[4][5] | ||||||||
| 2008 Canadian federal election | ||||||||
|---|---|---|---|---|---|---|---|---|
| Party | Candidate | Votes | % | ±% | Expenditures | |||
| Conservative | Tilly O'Neill-Gordon | 12,058 | 42.07 | +8.00 | $43,226.70 | |||
| Liberal | Charles Hubbard | 10,590 | 36.95 | -5.32 | $29,196.67 | |||
| New Democratic | Donald A. Doucet | 4,904 | 17.11 | +0.19 | $4,709.46 | |||
| Green | Todd Smith | 1,105 | 3.85 | +2.07 | none listed | |||
| Total valid votes/Expense limit | 28,657 | 100.0 | $78,462 | |||||
| Total rejected, unmarked and declined ballots | 360 | 1.24 | +0.17 | |||||
| Turnout | 29,017 | 65.78 | -7.94 | |||||
| Eligible voters | 44,113 | |||||||
| Conservative gain from Liberal | Swing | +6.66 | ||||||
| 2006 Canadian federal election | ||||||||
|---|---|---|---|---|---|---|---|---|
| Party | Candidate | Votes | % | ±% | Expenditures | |||
| Liberal | Charles Hubbard | 13,960 | 42.27 | -5.81 | $33,385.25 | |||
| Conservative | Michael Morrison | 11,250 | 34.07 | +5.04 | $62,777.69 | |||
| New Democratic | Jeannette Manuel-Allain | 5,587 | 16.92 | -1.46 | $4,683.49 | |||
| Independent | Danny Gay | 1,640 | 4.97 | – | $6,252.33 | |||
| Green | John Bethell | 587 | 1.78 | -2.73 | none listed | |||
| Total valid votes/Expense limit | 33,024 | 100.0 | $73,328 | |||||
| Total rejected, unmarked and declined ballots | 359 | 1.07 | -1.45 | |||||
| Turnout | 33,383 | 73.72 | ||||||
| Eligible voters | 45,284 | |||||||
| Liberal hold | Swing | +5.42 | ||||||
| 2004 Canadian federal election | ||||||||
|---|---|---|---|---|---|---|---|---|
| Party | Candidate | Votes | % | ±% | Expenditures | |||
| Liberal | Charles Hubbard | 15,647 | 48.08 | -1.19 | $30,788.14 | |||
| Conservative | Michael Morrison | 9,448 | 29.03 | -9.81 | $36,154.69 | |||
| New Democratic | Hilaire Rousselle | 5,980 | 18.38 | +6,49 | $251.16 | |||
| Green | Garry Sanipass | 1,468 | 4.51 | – | $2,119.41 | |||
| Total valid votes/Expense limit | 32,543 | 100.0 | $73,799 | |||||
| Total rejected, unmarked and declined ballots | 841 | 2.52 | ||||||
| Turnout | 33,384 | 65.42 | -3.27 | |||||
| Eligible voters | 51,027 | |||||||
| Liberal notional hold | Swing | +4.31 | ||||||
| Changes from 2000 are based on redistributed results. Change for the Conservative Party is based on the combined results of its predecessors, the Progressive Conservatives and the Canadian Alliance. | ||||||||
| 2000 federal election redistributed results | |||
|---|---|---|---|
| Party | Vote | % | |
| Liberal | 17,109 | 49.27 | |
| Progressive Conservative | 8,000 | 23.04 | |
| Alliance | 5,487 | 15.80 | |
| New Democratic | 4,130 | 11.89 | |
Miramichi, previous elections
| 2000 Canadian federal election | ||||||||
|---|---|---|---|---|---|---|---|---|
| Party | Candidate | Votes | % | ±% | ||||
| Liberal | Charles Hubbard | 17,047 | 51.44 | +10.99 | ||||
| Progressive Conservative | David Kelly | 8,341 | 25.17 | -5.53 | ||||
| Alliance | Ken Clark | 5,298 | 15.99 | +2.43 | ||||
| New Democratic | Allan Goodfellow | 2,453 | 7.40 | -7.89 | ||||
| Total valid votes | 33,139 | 100.00 | ||||||
Change for the Canadian Alliance from 1997 are based on the results of its predecessor, the Reform Party.
| 1997 Canadian federal election | ||||||||
|---|---|---|---|---|---|---|---|---|
| Party | Candidate | Votes | % | ±% | ||||
| Liberal | Charles Hubbard | 13,924 | 40.45 | -20.54 | ||||
| Progressive Conservative | Fernand Gibbs | 10,570 | 30.70 | +7.80 | ||||
| New Democratic | Allan Goodfellow | 5,263 | 15.29 | +10.18 | ||||
| Reform | Paul Doyle | 4,668 | 13.56 | +3.58 | ||||
| Total valid votes | 34,425 | 100.00 | ||||||
| 1993 Canadian federal election | ||||||||
|---|---|---|---|---|---|---|---|---|
| Party | Candidate | Votes | % | ±% | ||||
| Liberal | Charles Hubbard | 18,733 | 60.99 | +10.18 | ||||
| Progressive Conservative | Peter Murphy | 7,035 | 22.90 | -9.53 | ||||
| Reform | Paul Doyle | 3,064 | 9.98 | Ø | ||||
| New Democratic | Gordon Alliston | 1,570 | 5.11 | -0.98 | ||||
| Canada Party | Wilmot Ross | 314 | 1.02 | Ø | ||||
| Total valid votes | 30,716 | 100.00 | ||||||
Northumberland—Miramichi, 1957–1988
| 1988 Canadian federal election | ||||||||
|---|---|---|---|---|---|---|---|---|
| Party | Candidate | Votes | % | ±% | ||||
| Liberal | Maurice Dionne | 14,073 | 50.81 | +13.12 | ||||
| Progressive Conservative | Bud Jardine | 8,983 | 32.43 | -21.51 | ||||
| Confederation of Regions | Arch Pafford | 2,954 | 10.67 | Ø | ||||
| New Democratic | Frank Clancy | 1,686 | 6.09 | -2.28 | ||||
| Total valid votes | 27,696 | 100.00 | ||||||
| 1984 Canadian federal election | ||||||||
|---|---|---|---|---|---|---|---|---|
| Party | Candidate | Votes | % | ±% | ||||
| Progressive Conservative | Bud Jardine | 17,134 | 53.94 | +26.11 | ||||
| Liberal | Maurice Dionne | 11,971 | 37.69 | -17.10 | ||||
| New Democratic | Jerry Dunnett | 2,660 | 8.37 | -9.01 | ||||
| Total valid votes | 31,765 | 100.00 | ||||||
| 1980 Canadian federal election | ||||||||
|---|---|---|---|---|---|---|---|---|
| Party | Candidate | Votes | % | ±% | ||||
| Liberal | Maurice Dionne | 14,799 | 54.79 | +7.06 | ||||
| Progressive Conservative | Robert McAllister | 7,517 | 27.83 | -7.22 | ||||
| New Democratic | Jerry Dunnett | 4,694 | 17.38 | +0.15 | ||||
| Total valid votes | 27,010 | |||||||
| 1979 Canadian federal election | ||||||||
|---|---|---|---|---|---|---|---|---|
| Party | Candidate | Votes | % | ±% | ||||
| Liberal | Maurice Dionne | 12,893 | 47.73 | -4.95 | ||||
| Progressive Conservative | John Trevors | 9,467 | 35.05 | -1.02 | ||||
| New Democratic | Jerry Dunnett | 4,653 | 17.23 | +7.66 | ||||
| Total valid votes | 27,013 | 100.00 | ||||||
| 1974 Canadian federal election | ||||||||
|---|---|---|---|---|---|---|---|---|
| Party | Candidate | Votes | % | ±% | ||||
| Liberal | Maurice Dionne | 12,648 | 52.68 | +5.43 | ||||
| Progressive Conservative | John Trevors | 8,661 | 36.07 | -2.90 | ||||
| New Democratic | Ray LeBreton | 2,297 | 9.57 | -0.90 | ||||
| Social Credit | Fernand Sonier | 405 | 1.69 | -1.62 | ||||
| Total valid votes | 24,011 | 100.00 | ||||||
| 1972 Canadian federal election | ||||||||
|---|---|---|---|---|---|---|---|---|
| Party | Candidate | Votes | % | ±% | ||||
| Liberal | Percy Smith | 10,922 | 47.25 | -5.71 | ||||
| Progressive Conservative | Robert McAllister | 9,007 | 38.97 | -1.44 | ||||
| New Democratic | Ray LeBreton | 2,419 | 10.47 | +3.83 | ||||
| Social Credit | Joseph Goguen | 765 | 3.31 | Ø | ||||
| Total valid votes | 23,113 | 100.00 | ||||||
| 1968 Canadian federal election | ||||||||
|---|---|---|---|---|---|---|---|---|
| Party | Candidate | Votes | % | ±% | ||||
| Liberal | Percy Smith | 10,292 | 52.96 | +1.31 | ||||
| Progressive Conservative | Bernard Flam | 7,853 | 40.41 | +5.15 | ||||
| New Democratic | Edward Quinn | 1,290 | 6.64 | -6.45 | ||||
| Total valid votes | 19,435 | 100.00 | ||||||
| 1965 Canadian federal election | ||||||||
|---|---|---|---|---|---|---|---|---|
| Party | Candidate | Votes | % | ±% | ||||
| Liberal | George Roy McWilliam | 9,564 | 51.65 | -4.91 | ||||
| Progressive Conservative | Wilson Weldon | 6,529 | 35.26 | +0.12 | ||||
| New Democratic | Ronald Kelly | 2424 | 13.09 | +8.39 | ||||
| Total valid votes | 18,517 | 100.00 | ||||||
| 1963 Canadian federal election | ||||||||
|---|---|---|---|---|---|---|---|---|
| Party | Candidate | Votes | % | ±% | ||||
| Liberal | George Roy McWilliam | 10,148 | 56.56 | +3.96 | ||||
| Progressive Conservative | Adé Theriault | 6,305 | 35.14 | -2.16 | ||||
| New Democratic | John Currie | 844 | 4.70 | -1.41 | ||||
| Social Credit | Fidèle Bourque | 646 | 3.60 | -0.39 | ||||
| Total valid votes | 17,943 | 100.00 | ||||||
| 1962 Canadian federal election | ||||||||
|---|---|---|---|---|---|---|---|---|
| Party | Candidate | Votes | % | ±% | ||||
| Liberal | George Roy McWilliam | 9,899 | 52.60 | +0.16 | ||||
| Progressive Conservative | Edward Leggatt | 7,020 | 37.30 | -10.26 | ||||
| New Democratic | John Currie | 1,150 | 6.11 | Ø | ||||
| Social Credit | Wilton Newell | 750 | 3.99 | Ø | ||||
| Total valid votes | 18,819 | 100.00 | ||||||
| 1958 Canadian federal election | ||||||||
|---|---|---|---|---|---|---|---|---|
| Party | Candidate | Votes | % | ±% | ||||
| Liberal | George Roy McWilliam | 10,206 | 52.44 | -1.11 | ||||
| Progressive Conservative | John Leroy Betts | 9,257 | 47.56 | +6.16 | ||||
| Total valid votes | 19,463 | 100.00 | ||||||
Northumberland, 1867–1957
| 1957 Canadian federal election | ||||||||
|---|---|---|---|---|---|---|---|---|
| Party | Candidate | Votes | % | ±% | ||||
| Liberal | George Roy McWilliam | 8,582 | 53.55 | -10.78 | ||||
| Progressive Conservative | Joseph Ryan | 6,635 | 41.40 | +10.60 | ||||
| Co-operative Commonwealth | Paul Lordon | 808 | 5.04 | +0.17 | ||||
| Total valid votes | 16,025 | 100.00 | ||||||
| 1953 Canadian federal election | ||||||||
|---|---|---|---|---|---|---|---|---|
| Party | Candidate | Votes | % | ±% | ||||
| Liberal | George Roy McWilliam | 10,666 | 64.33 | +8.70 | ||||
| Progressive Conservative | George Somers | 5,107 | 30.80 | -8.66 | ||||
| Co-operative Commonwealth | Paul Lordon | 808 | 4.87 | +2.97 | ||||
| Total valid votes | 16,581 | 100.00 | ||||||
| 1949 Canadian federal election | ||||||||
|---|---|---|---|---|---|---|---|---|
| Party | Candidate | Votes | % | ±% | ||||
| Liberal | George Roy McWilliam | 9,840 | 55.63 | -6.66 | ||||
| Progressive Conservative | Benjamin Cleland | 6,980 | 39.46 | +1.75 | ||||
| Independent | Elmer MacKinnon | 533 | 3.01 | Ø | ||||
| Co-operative Commonwealth | Paul Hansen | 336 | 1.90 | Ø | ||||
| Total valid votes | 17,689 | 100.00 | ||||||
| 1945 Canadian federal election | ||||||||
|---|---|---|---|---|---|---|---|---|
| Party | Candidate | Votes | % | ±% | ||||
| Liberal | John William Maloney | 8,507 | 62.29 | +22.97 | ||||
| Progressive Conservative | Joseph Leonard O'Brien | 5,149 | 37.71 | -2.20 | ||||
| Total valid votes | 13,656 | 100.00 | ||||||
| 1940 Canadian federal election | ||||||||
|---|---|---|---|---|---|---|---|---|
| Party | Candidate | Votes | % | ±% | ||||
| Conservative | Joseph Leonard O'Brien | 5,149 | 39.91 | +16.01 | ||||
| Liberal | John William Maloney | 5,072 | 39.32 | -16.67 | ||||
| Independent Liberal | John Patrick Barry | 2,679 | 20.77 | -35.52 | ||||
| Total valid votes | 12,900 | 100.00 | ||||||
| 1935 Canadian federal election | ||||||||
|---|---|---|---|---|---|---|---|---|
| Party | Candidate | Votes | % | ±% | ||||
| Liberal | John Patrick Barry | 7,662 | 56.29 | +15.24 | ||||
| Conservative | John Creaghan | 3,253 | 23.90 | -35.05 | ||||
| Reconstruction | Frances Fish | 2,697 | 19.81 | Ø | ||||
| Total valid votes | 13,612 | 100.00 | ||||||
| 1930 Canadian federal election | ||||||||
|---|---|---|---|---|---|---|---|---|
| Party | Candidate | Votes | % | ±% | ||||
| Conservative | George Manning McDade | 8,095 | 58.95 | +11.11 | ||||
| Liberal | George Burchill | 5,637 | 41.05 | -11.11 | ||||
| Total valid votes | 13,732 | 100.00 | ||||||
| 1926 Canadian federal election | ||||||||
|---|---|---|---|---|---|---|---|---|
| Party | Candidate | Votes | % | ±% | ||||
| Liberal | Charles Joseph Morrissy | 6,201 | 52.16 | +10.68 | ||||
| Conservative | Charles Elijah Fish | 5,687 | 47.84 | -10.68 | ||||
| Total valid votes | 11,888 | 100.00 | ||||||
| 1925 Canadian federal election | ||||||||
|---|---|---|---|---|---|---|---|---|
| Party | Candidate | Votes | % | ±% | ||||
| Conservative | Charles Elijah Fish | 5,331 | 58.52 | +11.23 | ||||
| Liberal | Frederick Tweedie | 3,779 | 41.48 | -11.23 | ||||
| Total valid votes | 9,110 | 100.00 | ||||||
| Canadian federal by-election, 7 October 1924 | ||||||||
|---|---|---|---|---|---|---|---|---|
| Party | Candidate | Votes | % | ±% | ||||
| On John Morrissy's death, 31 July 1924 | ||||||||
| Liberal | William Bunting Snowball | 6,222 | 52.71 | -3.22 | ||||
| Conservative | Clifford Patrick Hickey | 5,583 | 47.29 | +3.22 | ||||
| Total valid votes | 11,805 | 100.00 | ||||||
| 1921 Canadian federal election | ||||||||
|---|---|---|---|---|---|---|---|---|
| Party | Candidate | Votes | % | ±% | ||||
| Liberal | John Morrissy | 6,706 | 55.93 | +12.28 | ||||
| Conservative | Edward McCurdy | 5,285 | 44.07 | -12.28 | ||||
| Total valid votes | 11,991 | 100.00 | ||||||
| 1917 Canadian federal election | ||||||||
|---|---|---|---|---|---|---|---|---|
| Party | Candidate | Votes | % | ±% | ||||
| Government (Unionist) | William Stewart Loggie | 4,648 | 56.35 | +9.69 | ||||
| Opposition (Laurier Liberals) | John Morrissy | 3,601 | 43.65 | -9.69 | ||||
| Total valid votes | 8,249 | 100.00 | ||||||
Unionist candidate W.S. Loggie's change from 1911 is based on the Conservative Party's results. He personally had no change in vote percentage.
| 1911 Canadian federal election | ||||||||
|---|---|---|---|---|---|---|---|---|
| Party | Candidate | Votes | % | ±% | ||||
| Liberal | William Stewart Loggie | 3,128 | 53.34 | -4.97 | ||||
| Conservative | Donald Morrison | 2,736 | 46.66 | +4.97 | ||||
| Total valid votes | 5,864 | 100.00 | ||||||
| 1908 Canadian federal election | ||||||||
|---|---|---|---|---|---|---|---|---|
| Party | Candidate | Votes | % | ±% | ||||
| Liberal | William Stewart Loggie | 3,223 | 58.31 | +5.40 | ||||
| Conservative | Donald Morrison | 2,304 | 41.69 | -5.40 | ||||
| Total valid votes | 5,527 | 100.00 | ||||||
| 1904 Canadian federal election | ||||||||
|---|---|---|---|---|---|---|---|---|
| Party | Candidate | Votes | % | ±% | ||||
| Liberal | William Stewart Loggie | 2,589 | 52.91 | +6.78 | ||||
| Conservative | James Robinson | 2,304 | 47.09 | -6.78 | ||||
| Total valid votes | 4,893 | 100.00 | ||||||
| 1900 Canadian federal election | ||||||||
|---|---|---|---|---|---|---|---|---|
| Party | Candidate | Votes | % | ±% | ||||
| Conservative | James Robinson | 2225 | 53.87 | +5.53 | ||||
| Liberal | John Morrissy | 1905 | 46.13 | +8.81 | ||||
| Total valid votes | 4130 | 100.00 | ||||||
Change for Liberal candidate John Morrissy are based on the 1896 Liberal Party's results. His personal vote increased by 31.79% over his 1896 result running as an independent candidate.
| 1896 Canadian federal election | ||||||||
|---|---|---|---|---|---|---|---|---|
| Party | Candidate | Votes | % | ±% | ||||
| Conservative | James Robinson | 2,225 | 48.34 | -7.71 | ||||
| Liberal | Peter Mitchell | 1,718 | 37.32 | -6.63 | ||||
| Independent | John Morrissy | 660 | 14.34 | Ø | ||||
| Total valid votes | 4,603 | 100.00 | ||||||
| Canadian federal by-election, 6 February 1896 | ||||||||
|---|---|---|---|---|---|---|---|---|
| Party | Candidate | Votes | % | ±% | ||||
| On Mr. Adams being called to the Senate, 7-1-1896 | ||||||||
| Conservative | James Robinson | acclaimed | NA | NA | ||||
| 1891 Canadian federal election | ||||||||
|---|---|---|---|---|---|---|---|---|
| Party | Candidate | Votes | % | ±% | ||||
| Conservative | Michael Adams | 2,192 | 56.05 | +15.88 | ||||
| Independent Liberal | Peter Mitchell | 1,719 | 43.95 | -15.88 | ||||
| Total valid votes | 3,911 | 100.00 | ||||||
| 1887 Canadian federal election | ||||||||
|---|---|---|---|---|---|---|---|---|
| Party | Candidate | Votes | % | ±% | ||||
| Independent Liberal | Peter Mitchell | 2,271 | 59.83 | n/a | ||||
| Conservative | Michael Adams | 1,525 | 40.17 | Ø | ||||
| Total valid votes | 3796 | 100.00 | ||||||
| Canadian federal by-election, 5 February 1878 | ||||||||
|---|---|---|---|---|---|---|---|---|
| Party | Candidate | Votes | % | ±% | ||||
| Mitchell resigned his seat and re-offered after being accused of violating the Independence of Parliament Act by leasing a building to the government while he was a senator. | ||||||||
| Independent | Peter Mitchell | acclaimed | n/a | n/a | ||||
| 1882 Canadian federal election | ||||||||
|---|---|---|---|---|---|---|---|---|
| Party | Candidate | Votes | % | ±% | ||||
| Independent | Peter Mitchell | acclaimed | n/a | n/a | ||||
| 1878 Canadian federal election | ||||||||
|---|---|---|---|---|---|---|---|---|
| Party | Candidate | Votes | % | ±% | ||||
| Liberal | Jabez Bunting Snowball | 1,585 | 53.38 | +14.92 | ||||
| Independent | Peter Mitchell | 1,384 | 46.62 | -14.92 | ||||
| Total valid votes | 2,969 | 100.00 | ||||||
| 1874 Canadian federal election | ||||||||
|---|---|---|---|---|---|---|---|---|
| Party | Candidate | Votes | % | ±% | ||||
| Independent | Peter Mitchell | 1,312 | 61.54 | n/a | ||||
| Unknown | Jabez Bunting Snowball | 820 | 38.46 | Ø | ||||
| Total valid votes | 2,132 | 100.00 | ||||||
| 1872 Canadian federal election | ||||||||
|---|---|---|---|---|---|---|---|---|
| Party | Candidate | Votes | % | ±% | ||||
| Independent | Peter Mitchell | acclaimed | n/a | n/a | ||||
| Canadian federal by-election, 24 December 1868 | ||||||||
|---|---|---|---|---|---|---|---|---|
| Party | Candidate | Votes | % | ±% | ||||
| On the death of John Mercer Johnson, 11 August 1868 | ||||||||
| Liberal | Richard Hutchison | 1,133 | 55.90 | -5.93 | ||||
| Unknown | ? Gough | 894 | 44.10 | Ø | ||||
| Total valid votes | 2,027 | 100.00 | ||||||
| 1867 Canadian federal election | ||||||||
|---|---|---|---|---|---|---|---|---|
| Party | Candidate | Votes | % | |||||
| Liberal | John Mercer Johnson | 1,226 | 61.83 | |||||
| Unknown | Thomas F. Gillespie | 757 | 38.17 | |||||
| Total valid votes | 1,983 | 100.00 | ||||||
See also
- List of Canadian federal electoral districts
- Past Canadian electoral districts
References
- "(Code 13006) Census Profile". 2011 census. Statistics Canada. 2012. Retrieved 3 March 2011.
- Campaign expense data from Elections Canada
- Map of Miramichi riding archived by Elections Canada
Riding history from the Library of Parliament:
Notes
- Statistics Canada: 2012
- Statistics Canada: 2012
- "N.B. Constituency Gets New Name To Cut Confusion". Globe and Mail. 6 May 1957. p. 3.
- Elections Canada – Official voting results, Forty-first general election, 2011
- Elections Canada – Candidate's electoral campaign return, 41st general election