Acadie—Bathurst
Acadie—Bathurst (formerly Gloucester) is a federal electoral district in New Brunswick, Canada, that has been represented in the House of Commons of Canada since 1867.
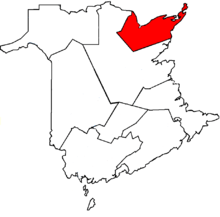 Acadie—Bathurst in relation to other New Brunswick ridings (2005 boundaries) | |||
| Coordinates: | 47.573°N 65.506°W | ||
| Federal electoral district | |||
| Legislature | House of Commons | ||
| MP |
Liberal | ||
| District created | 1867 | ||
| First contested | 1867 | ||
| Last contested | 2019 | ||
| District webpage | profile, map | ||
| Demographics | |||
| Population (2016)[1] | 77,791 | ||
| Electors (2015) | 66,594 | ||
| Area (km²)[2] | 5,063.17 | ||
| Pop. density (per km²) | 15.4 | ||
| Census divisions | Gloucester, Restigouche | ||
| Census subdivisions | Cities: Bathurst Towns: Beresford Caraquet Lamèque Shippagan Tracadie–Sheila Villages: Bas-Caraquet, Belledune, Bertrand, Grande-Anse, Le Goulet, Maisonnette, New Bandon-Salmon Beach, Nigadoo, Paquetville, Petit-Rocher, Pointe-Verte, Saint-Isidore, Saint-Léolin, Ste-Marie-St-Raphaël Parishes: Allardville, Bathurst, Beresford, Caraquet, Colborne, Durham, Inkerman, New Bandon, Paquetville, Saint-Isidore, Saumarez, Shippagan First Nations reserves: Pabineau 11, Pokemouche 13 | ||
Until 1997, the riding was largely held by the Liberal Party thanks to strong support from the francophone Acadian population. There is also a notable Red Tory tendency in the riding that enabled the former Progressive Conservative Party to win on occasion. In the 1997 federal election, the New Democratic Party's Yvon Godin won an unexpected victory over powerful Liberal cabinet minister Doug Young, mostly due to his Union connections and EI recipients' reaction to Liberal cuts to Employment Insurance. Godin held the riding until his retirement as of the 2015 federal election, at which point the Liberals reclaimed the riding as part of their sweep of Atlantic Canada.
| Year | Pop. | ±% |
|---|---|---|
| 2001 | 76,392 | — |
| 2006 | 78,948 | +3.3% |
| 2011 (2005 rep.) | 77,792 | −1.5% |
| 2011 (2013 rep.) | 79,340 | +2.0% |
Geography
The district includes eastern Gloucester County, and the communities along Nepisiguit Bay. The neighbouring ridings are Miramichi (electoral district) and Gaspésie—Îles-de-la-Madeleine.
History
The electoral district was created at confederation in 1867, and was known as "Gloucester" until its name was changed in 1990.
In 2004, there were some legal problems regarding the 2003 boundaries. The following is from the Elections Canada website:
- "In May 2004, the Federal Court of Canada made its decision in Raîche v. Canada (Attorney General), concerning a portion of the electoral boundary between the ridings of Miramichi and Acadie–Bathurst. The Court held that, in transferring certain parts of parishes from the riding of Acadie–Bathurst to Miramichi, the Federal Electoral Boundaries Commission for New Brunswick erred in its application of the rules governing the preparation of its recommendations. The new boundaries commission was created under Part I of the Inquiries Act in response to this court decision."
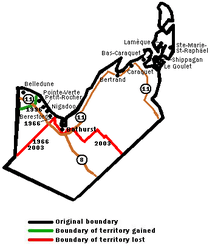
The current boundaries reverted to the ones used in the 1996 representation after the 2006 election. As per the 2012 federal electoral redistribution, this riding gained a small territory from what was part of Miramichi.
MP Yvon Godin's personal popularity ensured dominance throughout the riding for the NDP in the 2011 election. His long-time experience as a Union organizer possibly helped since he was otherwise not well known in Bathurst before the election, having moved in from the Acadian Peninsula where he was from. The Conservatives won just two polls in the Bathurst area and while the Liberals won most of the mobile polls, they won just one non-mobile poll, in Inkerman.[3]
Members of Parliament
This riding has elected the following Members of Parliament:
| Parliament | Years | Member | Party | |
|---|---|---|---|---|
| Gloucester | ||||
| 1st | 1867–1872 | Timothy Anglin | Liberal | |
| 2nd | 1872–1874 | |||
| 3rd | 1874–1877 | |||
| 1877–1878 | ||||
| 4th | 1878–1882 | |||
| 5th | 1882–1887 | Kennedy Francis Burns | Conservative | |
| 6th | 1887–1891 | |||
| 7th | 1891–1894 | |||
| 1894–1896 | Théotime Blanchard | |||
| 8th | 1896–1900 | |||
| 9th | 1900–1904 | Onésiphore Turgeon | Liberal | |
| 10th | 1904–1908 | |||
| 11th | 1908–1911 | |||
| 12th | 1911–1917 | |||
| 13th | 1917–1921 | |||
| 14th | 1921–1922 | |||
| 1922–1925 | Jean George Robichaud | |||
| 15th | 1925–1926 | |||
| 16th | 1926–1926 | Peter Veniot | ||
| 1926–1930 | ||||
| 17th | 1930–1935 | |||
| 18th | 1935–1936 | |||
| 1936–1940 | Clarence Joseph Veniot | |||
| 19th | 1940–1945 | |||
| 20th | 1945–1949 | Clovis-Thomas Richard | ||
| 21st | 1949–1952 | |||
| 1952–1953 | Albany Robichaud | Progressive Conservative | ||
| 22nd | 1953–1957 | Hédard Robichaud | Liberal | |
| 23rd | 1957–1958 | |||
| 24th | 1958–1962 | |||
| 25th | 1962–1963 | |||
| 26th | 1963–1965 | |||
| 27th | 1965–1966 | |||
| 28th | 1968–1972 | Herb Breau | ||
| 29th | 1972–1974 | |||
| 30th | 1974–1979 | |||
| 31st | 1979–1980 | |||
| 32nd | 1980–1984 | |||
| 33rd | 1984–1988 | Roger Clinch | Progressive Conservative | |
| 34th | 1988–1993 | Doug Young | Liberal | |
| Acadie—Bathurst | ||||
| 35th | 1993–1997 | Doug Young | Liberal | |
| 36th | 1997–2000 | Yvon Godin | New Democratic | |
| 37th | 2000–2004 | |||
| 38th | 2004–2006 | |||
| 39th | 2006–2008 | |||
| 40th | 2008–2011 | |||
| 41st | 2011–2015 | |||
| 42nd | 2015–2019 | Serge Cormier | Liberal | |
| 43rd | 2019–present | |||
Election results
Acadie—Bathurst
2019 general election
| 2019 Canadian federal election | ||||||||
|---|---|---|---|---|---|---|---|---|
| Party | Candidate | Votes | % | ±% | Expenditures | |||
| Liberal | Serge Cormier | 26,547 | 55.14 | +4.43 | ||||
| Conservative | Martine Savoie | 10,352 | 21.50 | +13.94 | ||||
| New Democratic | Daniel Thériault | 6,967 | 14.47 | −24.93 | ||||
| Green | Robert Kryszko | 4,277 | 8.88 | +6.55 | ||||
| Total valid votes/Expense limit | 48,143 | 100.0 | $100,608.92 | |||||
| Total rejected ballots | 924 | 1.88 | +1.23 | |||||
| Turnout | 49,067 | 73.54 | −3.25 | |||||
| Eligible voters | 66,718 | |||||||
| Liberal hold | Swing | −4.76 | ||||||
| Source: Elections Canada[4] | ||||||||
2015 general election
| 2015 Canadian federal election | ||||||||
|---|---|---|---|---|---|---|---|---|
| Party | Candidate | Votes | % | ±% | Expenditures | |||
| Liberal | Serge Cormier | 25,845 | 50.71 | +36.40 | $55,485.34 | |||
| New Democratic | Jason Godin | 20,079 | 39.40 | -29.68 | $116,542.41 | |||
| Conservative | Riba Girouard-Riordon | 3,852 | 7.56 | -8.98 | – | |||
| Green | Dominique Breau | 1,187 | 2.33 | +2.26 | – | |||
| Total valid votes/Expense limit | 50,963 | 99.35 | $200,964.43 | |||||
| Total rejected ballots | 336 | 0.65 | ||||||
| Turnout | 51,299 | 77.03 | ||||||
| Eligible voters | 66,594 | |||||||
| Liberal gain from New Democratic | Swing | +33.04 | ||||||
| Source: Elections Canada[5][6] | ||||||||
| 2011 federal election redistributed results[7] | |||
|---|---|---|---|
| Party | Vote | % | |
| New Democratic | 32,361 | 69.08 | |
| Conservative | 7,749 | 16.54 | |
| Liberal | 6,705 | 14.31 | |
| Green | 31 | 0.07 | |
2011 general election
| 2011 Canadian federal election | ||||||||
|---|---|---|---|---|---|---|---|---|
| Party | Candidate | Votes | % | ±% | Expenditures | |||
| New Democratic | Yvon Godin | 32,067 | 69.69 | +12.27 | $59,706.29 | |||
| Conservative | Louis Robichaud | 7,456 | 16.20 | -2.39 | $30,447.79 | |||
| Liberal | Jean Marie Gionet | 6,491 | 14.11 | -7.86 | $50,735.74 | |||
| Total valid votes/Expense limit | 46,014 | 100.0 | $82,556.86 | |||||
| Total rejected, unmarked and declined ballots | 595 | 1.33 | +0.21 | |||||
| Turnout | 46,609 | 70.30 | +1.98 | |||||
| Eligible voters | 66,298 | |||||||
| New Democratic hold | Swing | +7.33 | ||||||
| Sources:[8][9] | ||||||||
2008 general election
| 2008 Canadian federal election | ||||||||
|---|---|---|---|---|---|---|---|---|
| Party | Candidate | Votes | % | ±% | Expenditures | |||
| New Democratic | Yvon Godin | 25,849 | 57.53 | +7.63 | $57,376.65 | |||
| Liberal | Odette Robichaud | 9,850 | 21.92 | -8.79 | $32,225.33 | |||
| Conservative | Jean-Guy Dubé | 8,331 | 18.54 | +1.68 | $67,790.01 | |||
| Green | Michelle Aubin | 904 | 2.01 | +0.63 | none listed | |||
| Total valid votes/Expense limit | 44,934 | 100.0 | $80,066 | |||||
| Total rejected, unmarked and declined ballots | 507 | 1.12 | +0.09 | |||||
| Turnout | 45,441 | 68.32 | -7.14 | |||||
| Eligible voters | 66,509 | |||||||
| New Democratic hold | Swing | +8.21 | ||||||
2006 general election
| 2006 Canadian federal election | ||||||||
|---|---|---|---|---|---|---|---|---|
| Party | Candidate | Votes | % | ±% | Expenditures | |||
| New Democratic | Yvon Godin | 25,195 | 49.90 | -4.03 | $69,502.02 | |||
| Liberal | Marcelle Mersereau | 15,504 | 30.71 | -1.96 | $65,035.20 | |||
| Conservative | Serge Savoie | 8,513 | 16.86 | +5.92 | $54,729.58 | |||
| Green | Philippe Rouselle | 699 | 1.38 | -1.07 | $774.79 | |||
| Independent | Eric Landry | 362 | 0.72 | – | $2,613.63 | |||
| Independent | Ulric Degrâce | 219 | 0.43 | – | none listed | |||
| Total valid votes/Expense limit | 50,492 | 100.0 | $74,710 | |||||
| Total rejected, unmarked and declined ballots | 523 | 1.03 | -0.15 | |||||
| Turnout | 51,015 | 75.46 | +5.08 | |||||
| Eligible voters | 67,608 | |||||||
| New Democratic hold | Swing | -1.04 | ||||||
2004 general election
| 2004 Canadian federal election | ||||||||
|---|---|---|---|---|---|---|---|---|
| Party | Candidate | Votes | % | ±% | Expenditures | |||
| New Democratic | Yvon Godin | 23,857 | 53.93 | +7.26 | $61,745.98 | |||
| Liberal | Serge Rousselle | 14,452 | 32.67 | -7.75 | $60,252.15 | |||
| Conservative | Joel Bernard | 4,841 | 10.94 | -1.97 | $51,943.73 | |||
| Green | Mario Lanteigne | 1,085 | 2.45 | – | $7,040.66 | |||
| Total valid votes/Expense limit | 44,235 | 100.0 | $71,582 | |||||
| Total rejected, unmarked and declined ballots | 527 | 1.18 | -0.04 | |||||
| Turnout | 44,762 | 70.38 | -4.99 | |||||
| Eligible voters | 63,603 | |||||||
| New Democratic notional hold | Swing | +7.50 | ||||||
| Changes from 2000 are based on redistributed results. Conservative Party change is based on the combination of Canadian Alliance and Progressive Conservative Party totals. | ||||||||
| 2000 federal election redistributed results | |||
|---|---|---|---|
| Party | Vote | % | |
| New Democratic | 21,490 | 46.67 | |
| Liberal | 18,613 | 40.42 | |
| Progressive Conservative | 3,923 | 8.52 | |
| Alliance | 2,021 | 4.39 | |
2000 general election
| 2000 Canadian federal election | ||||||||
|---|---|---|---|---|---|---|---|---|
| Party | Candidate | Votes | % | ±% | Expenditures | |||
| New Democratic | Yvon Godin | 23,568 | 46.61 | +6.08 | $57,177 | |||
| Liberal | Bernard Thériault | 20,362 | 40.27 | +4.91 | $58,623 | |||
| Progressive Conservative | Alcide Leger | 4,321 | 8.55 | -15.56 | $36,600 | |||
| Alliance | Jean Gauvin | 2,314 | 4.58 | – | $45,973 | |||
| Total valid votes/Expense limit | 50,565 | 100.00 | $63,209 | |||||
| Total rejected ballots | 624 | 1.22 | -1.25 | |||||
| Turnout | 51,189 | 75.37 | -3.28 | |||||
| Electors on the lists | 67,918 | – | – | |||||
| NDP hold | Swing | +0.59 | ||||||
1997 general election
| 1997 Canadian federal election | ||||||||
|---|---|---|---|---|---|---|---|---|
| Party | Candidate | Votes | % | ±% | Expenditures | |||
| New Democratic | Yvon Godin | 21,113 | 40.53 | +34.57 | $56,390 | |||
| Liberal | Doug Young | 18,421 | 35.36 | -30.99 | $53,440 | |||
| Progressive Conservative | Norma Landry | 12,560 | 24.11 | -3.58 | $51,562 | |||
| Total valid votes/Expense limit | 52,094 | 100.00 | $60,877 | |||||
| Total rejected ballots | 1,318 | 2.47 | – | |||||
| Turnout | 53,412 | 78.65 | – | |||||
| Electors on the lists | 67,912 | – | – | |||||
| NDP gain from Liberal | Swing | +32.8 | ||||||
1993 general election
| 1993 Canadian federal election | ||||||||
|---|---|---|---|---|---|---|---|---|
| Party | Candidate | Votes | % | ±% | Expenditures | |||
| Liberal | Doug Young | 26,782 | 66.35 | +14.60 | $45,888 | |||
| Progressive Conservative | Luce-Andrée Gauthier | 11,175 | 27.69 | -15.04 | $53,402 | |||
| New Democratic | Kim Gallant | 2,406 | 5.96 | +0.43 | $1,508 | |||
| Total valid votes/Expense limit | 40,363 | 100.00 | $53,496 | |||||
| Liberal hold | Swing | +14.8 | ||||||
Gloucester, 1867–1993
| 1988 Canadian federal election | ||||||||
|---|---|---|---|---|---|---|---|---|
| Party | Candidate | Votes | % | ±% | ||||
| Liberal | Doug Young | 20,251 | 51.75 | +13.37 | ||||
| Progressive Conservative | Jean Gauvin | 16,721 | 42.73 | -12.39 | ||||
| New Democratic | Serge Robichaud | 2,163 | 5.53 | +0.40 | ||||
| Total valid votes | 39,135 | 100.00 | ||||||
| Liberal gain from Progressive Conservative. | Swing | +12.88 | ||||||
| 1984 Canadian federal election | ||||||||
|---|---|---|---|---|---|---|---|---|
| Party | Candidate | Votes | % | ±% | ||||
| Progressive Conservative | Roger Clinch | 23,524 | 55.12 | +35.51 | ||||
| Liberal | Herb Breau | 16,378 | 38.38 | -25.29 | ||||
| New Democratic | Valentine Ward | 2,188 | 5.13 | -7.71 | ||||
| Independent | Fernand Losier | 584 | 1.37 | |||||
| Total valid votes | 42,674 | 100.00 | ||||||
| Progressive Conservative gain from Liberal | Swing | +30.40 | ||||||
| 1980 Canadian federal election | ||||||||
|---|---|---|---|---|---|---|---|---|
| Party | Candidate | Votes | % | ±% | ||||
| Liberal | Herb Breau | 22,229 | 63.67 | +12.06 | ||||
| Progressive Conservative | Arthur Savoie | 6,846 | 19.61 | -19.33 | ||||
| New Democratic | Kevin O'Connell | 4,484 | 12.84 | +3.39 | ||||
| Rhinoceros | Jules César Boudreau | 736 | 2.11 | |||||
| Rhinoceros | Amédé "le Terrible" Boucher | 362 | 1.04 | |||||
| Independent | Rose-Hélène Aubé | 197 | 0.56 | |||||
| Marxist–Leninist | Gary Zatzman | 59 | 0.17 | |||||
| Total valid votes | 34,913 | 100.00 | ||||||
| Liberal hold | Swing | +15.7% | ||||||
| 1979 Canadian federal election | ||||||||
|---|---|---|---|---|---|---|---|---|
| Party | Candidate | Votes | % | ±% | ||||
| Liberal | Herb Breau | 18,387 | 51.61 | -5.44 | ||||
| Progressive Conservative | Gastien Godin | 13,872 | 38.94 | +15.79 | ||||
| New Democratic | Kevin O'Connell | 3,366 | 9.45 | +3.51 | ||||
| Total valid votes | 35,625 | 100.00 | ||||||
| 1974 Canadian federal election | ||||||||
|---|---|---|---|---|---|---|---|---|
| Party | Candidate | Votes | % | ±% | ||||
| Liberal | Herb Breau | 16,195 | 57.05 | +6.44 | ||||
| Progressive Conservative | Gérard Arseneau | 6,571 | 23.15 | -1.47 | ||||
| Social Credit | Lomer Basque | 3,935 | 13.86 | -2.12 | ||||
| New Democratic | Yvon Guignard | 1,685 | 5.94 | +4.08 | ||||
| Total valid votes | 28,386 | 100.00 | ||||||
| 1972 Canadian federal election | ||||||||
|---|---|---|---|---|---|---|---|---|
| Party | Candidate | Votes | % | ±% | ||||
| Liberal | Herb Breau | 14,212 | 50.61 | -4.42 | ||||
| Progressive Conservative | Paul Duval | 6,914 | 24.62 | -15.81 | ||||
| Social Credit | Lomer Basque | 4,487 | 15.98 | Ø | ||||
| Independent | Percy W. Cormier | 1,109 | 3.95 | |||||
| Independent | Mathilda Blanchard | 839 | 2.99 | |||||
| New Democratic | Joe Corbin | 521 | 1.86 | -2.68 | ||||
| Total valid votes | 28,082 | 100.00 | ||||||
| 1968 Canadian federal election | ||||||||
|---|---|---|---|---|---|---|---|---|
| Party | Candidate | Votes | % | ±% | ||||
| Liberal | Herb Breau | 12,196 | 55.03 | -5.58 | ||||
| Progressive Conservative | Frédéric Arsenault | ,8960 | 40.43 | +13.17 | ||||
| New Democratic | Florian Robichaud | 1,007 | 4.54 | -7.59 | ||||
| Total valid votes | 22,163 | 100.00 | ||||||
| 1965 Canadian federal election | ||||||||
|---|---|---|---|---|---|---|---|---|
| Party | Candidate | Votes | % | ±% | ||||
| Liberal | Hédard Robichaud | 14,121 | 60.61 | +3.15 | ||||
| Progressive Conservative | J. Léo Hachey | 6,351 | 27.26 | +7.82 | ||||
| New Democratic | Martin Kierans | 2,826 | 12.13 | |||||
| Total valid votes | 23,298 | 100.00 | ||||||
| 1963 Canadian federal election | ||||||||
|---|---|---|---|---|---|---|---|---|
| Party | Candidate | Votes | % | ±% | ||||
| Liberal | Hédard Robichaud | 13,344 | 57.46 | +0.40 | ||||
| Social Credit | Joseph Dubé | 5,365 | 23.10 | |||||
| Progressive Conservative | Leo Ferguson | 4,515 | 19.44 | -23.50 | ||||
| Total valid votes | 23,224 | 100.00 | ||||||
| 1962 Canadian federal election | ||||||||
|---|---|---|---|---|---|---|---|---|
| Party | Candidate | Votes | % | ±% | ||||
| Liberal | Hédard Robichaud | 13,519 | 57.06 | +4.23 | ||||
| Progressive Conservative | Antonio Robichaud | 10,174 | 42.94 | -4.23 | ||||
| Total valid votes | 23,693 | 100.00 | ||||||
| 1958 Canadian federal election | ||||||||
|---|---|---|---|---|---|---|---|---|
| Party | Candidate | Votes | % | ±% | ||||
| Liberal | Hédard Robichaud | 13,112 | 52.83 | -5.04 | ||||
| Progressive Conservative | J. Léo Hachey | 11,705 | 47.17 | +5.04 | ||||
| Total valid votes | 24,817 | 100.00 | ||||||
| 1957 Canadian federal election | ||||||||
|---|---|---|---|---|---|---|---|---|
| Party | Candidate | Votes | % | ±% | ||||
| Liberal | Hédard Robichaud | 13,052 | 57.87 | +0.28 | ||||
| Progressive Conservative | J. Léo Hachey | 9,502 | 42.13 | +0.91 | ||||
| Total valid votes | 22,554 | 100.00 | ||||||
| 1953 Canadian federal election | ||||||||
|---|---|---|---|---|---|---|---|---|
| Party | Candidate | Votes | % | ±% | ||||
| Liberal | Hédard Robichaud | 13,330 | 57.59 | +9.89 | ||||
| Progressive Conservative | Albany Robichaud | 9,542 | 41.22 | -11.08 | ||||
| Co-operative Commonwealth | Alphonse Landry | 276 | 1.19 | |||||
| Total valid votes | 23,148 | 100.00 | ||||||
| Canadian federal by-election, 26 May 1952 | ||||||||
|---|---|---|---|---|---|---|---|---|
| Party | Candidate | Votes | % | ±% | ||||
| On Clovis-Thomas Richard's acceptance of an office of emolument under the Crown, 5 March 1952 | ||||||||
| Progressive Conservative | Albany Robichaud | 11,245 | 52.30 | +22.08 | ||||
| Liberal | Hédard Robichaud | 10,256 | 47.70 | -22.08 | ||||
| Total valid votes | 21,501 | 100.00 | ||||||
| 1949 Canadian federal election | ||||||||
|---|---|---|---|---|---|---|---|---|
| Party | Candidate | Votes | % | ±% | ||||
| Liberal | Clovis-Thomas Richard | 14,759 | 69.78 | +7.35 | ||||
| Progressive Conservative | J.L. Albert Robichaud | 6,391 | 30.22 | -4.10 | ||||
| Total valid votes | 21,150 | 100.00 | ||||||
Change for Progressive Conservative candidate Albany Robichaud from 1945 are based on his results running as an Independent.
| 1945 Canadian federal election | ||||||||
|---|---|---|---|---|---|---|---|---|
| Party | Candidate | Votes | % | ±% | ||||
| Liberal | Clovis-Thomas Richard | 11,683 | 62.43 | -3.31 | ||||
| Independent | Albany Robichaud | 6,423 | 34.32 | +0.09 | ||||
| Co-operative Commonwealth | François-Xavier Blanchard | 609 | 3.25 | |||||
| Total valid votes | 18,715 | 100.00 | ||||||
Change for Independent candidate Albany Robichaud from 1940 are based on his results running as a National Government candidate.
| 1940 Canadian federal election | ||||||||
|---|---|---|---|---|---|---|---|---|
| Party | Candidate | Votes | % | ±% | ||||
| Liberal | Clarence Joseph Veniot | 10,451 | 65.74 | -9.22 | ||||
| National Government | Albany Robichaud | 5,447 | 34.26 | +15.47 | ||||
| Total valid votes | 15,898 | 100.00 | ||||||
The "National Government" was the temporary name of the Conservative Party for the 1940 elections, and changes from 1935 are based on the results of the Conservative Party.
Note: Change in popular vote is calculated from popular vote in the 1935 general election.
| By-election on 17 August 1936
On Peter Veniot's death, 6 July 1936 | |||||
| Party | Candidate | Votes | |||
|---|---|---|---|---|---|
| Liberal | Clarence Joseph Veniot | acclaimed | |||
| 1935 Canadian federal election | ||||||||
|---|---|---|---|---|---|---|---|---|
| Party | Candidate | Votes | % | ±% | ||||
| Liberal | Peter Veniot | 11,816 | 74.96 | +24.12 | ||||
| Conservative | Albany Robichaud | 2,962 | 18.79 | -30.37 | ||||
| Reconstruction | Hector Poirier | 985 | 6.25 | |||||
| Total valid votes | 15,763 | 100.00 | ||||||
| 1930 Canadian federal election | ||||||||
|---|---|---|---|---|---|---|---|---|
| Party | Candidate | Votes | % | ±% | ||||
| Liberal | Peter Veniot | 7,716 | 50.84 | -4.95 | ||||
| Conservative | Albany Robichaud | 7,460 | 49.16 | +4.95 | ||||
| Total valid votes | 15,176 | 100.00 | ||||||
| By-election on 2 November 1926
On Peter Veniot's acceptance of an office of | |||||
| Party | Candidate | Votes | |||
|---|---|---|---|---|---|
| Liberal | Peter Veniot | acclaimed | |||
| 1926 Canadian federal election | ||||||||
|---|---|---|---|---|---|---|---|---|
| Party | Candidate | Votes | % | ±% | ||||
| Liberal | Peter Veniot | 7,992 | 55.79 | +1.53 | ||||
| Conservative | Joseph S. Dumas | 6,333 | 44.21 | -1.53 | ||||
| Total valid votes | 14,325 | 100.00 | ||||||
| 1925 Canadian federal election | ||||||||
|---|---|---|---|---|---|---|---|---|
| Party | Candidate | Votes | % | ±% | ||||
| Liberal | Jean George Robichaud | 6,254 | 54.26 | -18.71 | ||||
| Conservative | Joseph Benoît Hachey | 5,272 | 45.74 | +18.71 | ||||
| Total valid votes | 11,526 | 100.00 | ||||||
Note: Change in popular vote is calculated from popular vote in the 1921 general election.
| By-election on 20 November 1922
On Onésiphore Turgeon's acceptance of an office of | |||||
| Party | Candidate | Votes | |||
|---|---|---|---|---|---|
| Liberal | Jean George Robichaud | acclaimed | |||
| 1921 Canadian federal election | ||||||||
|---|---|---|---|---|---|---|---|---|
| Party | Candidate | Votes | % | |||||
| Liberal | Onésiphore Turgeon | 7,671 | 72.97 | |||||
| Conservative | Joseph Edward de Grace | 2,842 | 27.03 | |||||
| Total valid votes | 10,513 | 100.00 | ||||||
| 1917 Canadian federal election | ||||||||
|---|---|---|---|---|---|---|---|---|
| Party | Candidate | Votes | ||||||
| Opposition (Laurier Liberals) | Onésiphore Turgeon | acclaimed | ||||||
| 1911 Canadian federal election | ||||||||
|---|---|---|---|---|---|---|---|---|
| Party | Candidate | Votes | % | ±% | ||||
| Liberal | Onésiphore Turgeon | 3,172 | 59.27 | +4.06 | ||||
| Conservative | Theobald M. Burns | 2,180 | 40.73 | -4.06 | ||||
| Total valid votes | 5,352 | 100.00 | ||||||
| 1908 Canadian federal election | ||||||||
|---|---|---|---|---|---|---|---|---|
| Party | Candidate | Votes | % | ±% | ||||
| Liberal | Onésiphore Turgeon | 2,581 | 55.21 | -8.53 | ||||
| Conservative | Theobald M. Burns | 2,094 | 44.79 | +8.53 | ||||
| Total valid votes | 4,675 | 100.00 | ||||||
| 1904 Canadian federal election | ||||||||
|---|---|---|---|---|---|---|---|---|
| Party | Candidate | Votes | % | ±% | ||||
| Liberal | Onésiphore Turgeon | 2,705 | 63.74 | +3.78 | ||||
| Conservative | Théotime Blanchard | 1,539 | 36.26 | +2.14 | ||||
| Total valid votes | 4,244 | 100.00 | ||||||
| 1900 Canadian federal election | ||||||||
|---|---|---|---|---|---|---|---|---|
| Party | Candidate | Votes | % | ±% | ||||
| Liberal | Onésiphore Turgeon | 2,311 | 59.96 | +30.14 | ||||
| Conservative | Théotime Blanchard | 1,315 | 34.12 | -16.81 | ||||
| Independent | R. Carr Harris | 228 | 5.92 | |||||
| Total valid votes | 3,854 | 100.00 | ||||||
| 1896 Canadian federal election | ||||||||
|---|---|---|---|---|---|---|---|---|
| Party | Candidate | Votes | % | ±% | ||||
| Conservative | Théotime Blanchard | 1,947 | 50.93 | -4.36 | ||||
| Liberal | Onésiphore Turgeon | 1,140 | 29.82 | -14.89 | ||||
| Independent | Robert Young | 736 | 19.25 | |||||
| Total valid votes | 3,823 | 100.00 | ||||||
Note: Change in popular vote is calculated from popular vote in the 1891 general election.
| By-election on 5 May 1894
On Kennedy Burns being called to the Senate, 21 March 1893 | |||||
| Party | Candidate | Votes | |||
|---|---|---|---|---|---|
| Conservative | Théotime Blanchard | acclaimed | |||
| 1891 Canadian federal election | ||||||||
|---|---|---|---|---|---|---|---|---|
| Party | Candidate | Votes | % | ±% | ||||
| Conservative | Kennedy Francis Burns | 1,943 | 55.29 | -0.83 | ||||
| Liberal | W.A. Landry | 1,571 | 44.71 | +0.83 | ||||
| Total valid votes | ,3514 | 100.00 | ||||||
| 1887 Canadian federal election | ||||||||
|---|---|---|---|---|---|---|---|---|
| Party | Candidate | Votes | % | ±% | ||||
| Conservative | Kennedy Francis Burns | 1,908 | 56.12 | +3.93 | ||||
| Liberal | Narc A. Landry | 1,492 | 43.88 | +20.49 | ||||
| Total valid votes | 3,400 | 100.00 | ||||||
| 1882 Canadian federal election | ||||||||
|---|---|---|---|---|---|---|---|---|
| Party | Candidate | Votes | % | |||||
| Conservative | Kennedy Francis Burns | 1,205 | 52.19 | |||||
| Unknown | Onésiphore Turgeon | 564 | 24.43 | |||||
| Liberal | Timothy Anglin | 540 | 23.39 | |||||
| Total valid votes | 2,309 | 100.00 | ||||||
| 1878 Canadian federal election | ||||||||
|---|---|---|---|---|---|---|---|---|
| Party | Candidate | Votes | ||||||
| Liberal | Timothy Anglin | acclaimed | ||||||
| Canadian federal by-election, 2 July 1877 | ||||||||
|---|---|---|---|---|---|---|---|---|
| Party | Candidate | Votes | % | |||||
| Liberal | Timothy Anglin | 1,185 | 58.00 | |||||
| Unknown | Onésiphore Turgeon | 858 | 42.00 | |||||
| Total valid votes | 2,043 | 100.00 | ||||||
| Called upon Timothy Anglin's resignation. | ||||||||
| 1874 Canadian federal election | ||||||||
|---|---|---|---|---|---|---|---|---|
| Party | Candidate | Votes | ||||||
| Liberal | Timothy Anglin | acclaimed | ||||||
| 1872 Canadian federal election | ||||||||
|---|---|---|---|---|---|---|---|---|
| Party | Candidate | Votes | % | ±% | ||||
| Liberal | Timothy Anglin | 1,436 | 80.81 | +19.55 | ||||
| Unknown | ? DesBrisay | 339 | 19.08 | |||||
| Unknown | ? MacKay | 2 | 0.11 | |||||
| Total valid votes | 1,777 | 100.00 | ||||||
| 1867 Canadian federal election | ||||||||
|---|---|---|---|---|---|---|---|---|
| Party | Candidate | Votes | % | |||||
| Liberal | Timothy Anglin | 1,061 | 61.26 | |||||
| Unknown | John Meahan | 671 | 38.74 | |||||
| Total valid votes | 1,732 | 100.00 | ||||||
Student Vote results
2011 election
In 2011, a Student Vote was conducted at participating Canadian schools to parallel the 2011 Canadian federal election results. The vote was designed to educate students and simulate the electoral process for persons who have not yet reached the legal majority. Schools with a large student body that reside in another electoral district had the option to vote for candidates outside of the electoral district then where they were physically located.[10]
| 2011 Canadian federal election | ||||||||
|---|---|---|---|---|---|---|---|---|
| Party | Candidate | Votes | % | |||||
| New Democratic | Yvon Godin | 1,000 | 66.80 | |||||
| Liberal | Jean Marie Gionet | 283 | 18.90 | |||||
| Conservative | Louis Robichaud | 214 | 14.30 | |||||
| Total valid votes | 1,497 | 100.00 | ||||||
See also
- List of Canadian federal electoral districts
- Past Canadian electoral districts
References
- "(Code 13001) Census Profile". 2011 census. Statistics Canada. 2012. Retrieved 3 March 2011.
- Riding history for Gloucester from the Library of Parliament
- Riding history for Acadie-Bathurst from the Library of Parliament
- Campaign expenses from Elections Canada
Notes
- Statistics Canada: 2017
- Statistics Canada: 2017
- "Riding « Pundits' Guide to Canadian Federal Elections". Punditsguide.ca. Retrieved 15 April 2011.
- "Results Validated by the Returning Officer". Elections Canada. Retrieved 27 October 2019.
- "October 19, 2015 Election Results — Acadie—Bathurst (Validated results)". Elections Canada. 21 October 2015. Retrieved 24 October 2015.
- Elections Canada – Preliminary Election Expenses Limits for Candidates Archived 4 March 2016 at the Wayback Machine
- Pundits' Guide to Canadian Elections
- Elections Canada – Official voting results, Forty-first general election, 2011
- Elections Canada – Candidate's electoral campaign return, 41st general election
- "School by School results". Student Vote Canada. Archived from the original on 6 May 2015. Retrieved 12 June 2013.