Charlottetown (electoral district)
Charlottetown (formerly Hillsborough) is a federal electoral district in Prince Edward Island, Canada, that has been represented in the House of Commons of Canada since 2004. The district, which includes the entire City of Charlottetown, has an area of 46 km2 and a population of 34,562 as of 2011.[2]
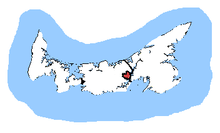 Charlottetown in relation to the other Prince Edward Island ridings | |||
| Coordinates: | 46.260°N 63.134°W | ||
| Federal electoral district | |||
| Legislature | House of Commons | ||
| MP |
Liberal | ||
| District created | 2003 | ||
| First contested | 2004 | ||
| Last contested | 2019 | ||
| District webpage | profile, map | ||
| Demographics | |||
| Population (2011)[1] | 34,562 | ||
| Electors (2015) | 27,891 | ||
| Area (km²)[1] | 46 | ||
| Pop. density (per km²) | 751.3 | ||
| Census divisions | Queens | ||
| Census subdivisions | Charlottetown | ||
Demographics
- Ethnic groups: 97.2% White
- Languages: 94.8% English, 2.1% French, 2.5% Other
- Religions: 47.7% Catholic, 39.5% Protestant, 2.5% Other Christian, 8.3% no affiliation
- Average income: $26,205
- According to the Canada 2016 Census
- Twenty most common mother tongue languages (2016) : 86.8% English, 3.7% Mandarin, 2.1% French, 1.3% Arabic, 0.6% Nepali, 0.4% Cantonese, 0.4% Spanish, 0.4% Tagalog, 0.3% Farsi, 0.3% Russian, 0.2% Dutch, 0.2% Vietnamese, 0.2% Albanian, 0.2% Korean[3]
History
From 1966 until 2004, most of the Charlottetown riding was part of the riding of Hillsborough. In 2003, there was a riding readjustment; a part of the old Hillsborough riding became part of Cardigan. 96.4% of the riding of Charlottetown was previously part of the Hillsborough riding, and 3.6% was previously part of Malpeque. There were no boundary changes as a result of the 2012 federal electoral redistribution.
Member of Parliament
This riding has elected the following Members of Parliament:
| Parliament | Years | Member | Party | |
|---|---|---|---|---|
| Hillsborough Riding created from Queen's |
||||
| 28th | 1968–1972 | Heath MacQuarrie | Progressive Conservative | |
| 29th | 1972–1974 | |||
| 30th | 1974–1979 | |||
| 31st | 1979–1980 | Tom McMillan | ||
| 32nd | 1980–1984 | |||
| 33rd | 1984–1988 | |||
| 34th | 1988–1993 | George Proud | Liberal | |
| 35th | 1993–1997 | |||
| 36th | 1997–2000 | |||
| 37th | 2000–2004 | Shawn Murphy | ||
| Charlottetown | ||||
| 38th | 2004–2006 | Shawn Murphy | Liberal | |
| 39th | 2006–2008 | |||
| 40th | 2008–2011 | |||
| 41st | 2011–2015 | Sean Casey | ||
| 42nd | 2015–2019 | |||
| 43rd | 2019–present | |||
Election results
Charlottetown
2019 general election
| 2019 Canadian federal election | ||||||||
|---|---|---|---|---|---|---|---|---|
| Party | Candidate | Votes | % | ±% | Expenditures | |||
| Liberal | Sean Casey | 8,812 | 44.26 | −12.01 | $81,859.21 | |||
| Green | Darcie Lanthier | 4,648 | 23.35 | +17.57 | $29,114.35 | |||
| Conservative | Robert A. Campbell | 4,040 | 20.29 | +5.47 | ||||
| New Democratic | Joe Byrne | 2,238 | 11.24 | −11.90 | $4,819.38 | |||
| Christian Heritage | Fred MacLeod | 172 | 0.86 | New | $1,200.90 | |||
| Total valid votes/Expense limit | 19,910 | 100.0 | $85,261.73 | |||||
| Total rejected ballots | 274 | 1.36 | +0.89 | |||||
| Turnout | 20,184 | 73.45 | −2.14 | |||||
| Eligible voters | 27,480 | |||||||
| Liberal hold | Swing | −14.79 | ||||||
| Source: Elections Canada[4] | ||||||||
2015 general election
| 2015 Canadian federal election | ||||||||
|---|---|---|---|---|---|---|---|---|
| Party | Candidate | Votes | % | ±% | Expenditures | |||
| Liberal | Sean Casey | 11,910 | 56.27 | +16.79 | $133,567.53 | |||
| New Democratic | Joe Byrne | 4,897 | 23.14 | –1.94 | $51,147.58 | |||
| Conservative | Ron MacMillan | 3,136 | 14.82 | –17.89 | $73,560.00 | |||
| Green | Becka Viau | 1,222 | 5.77 | +3.51 | $5,912.52 | |||
| Total valid votes/Expense limit | 21,165 | 99.53 | $170,107.74 | |||||
| Total rejected ballots | 99 | 0.47 | –0.14 | |||||
| Turnout | 21,264 | 76.24 | +6.14 | |||||
| Eligible voters | 27,891 | |||||||
| Liberal hold | Swing | +9.36 | ||||||
| Source: Elections Canada[5][6] | ||||||||
2011 general election
| 2011 Canadian federal election | ||||||||
|---|---|---|---|---|---|---|---|---|
| Party | Candidate | Votes | % | ±% | Expenditures | |||
| Liberal | Sean Casey | 7,292 | 39.48 | -10.58 | $61,465.09 | |||
| Conservative | Donna Profit | 6,040 | 32.71 | +0.60 | $48,556.35 | |||
| New Democratic | Joe Byrne | 4,632 | 25.08 | +12.77 | $45,026.11 | |||
| Green | Eliza Knockwood | 417 | 2.26 | -2.57 | $2,301.92 | |||
| Christian Heritage | Baird Judson | 87 | 0.47 | -0.23 | $3,159.86 | |||
| Total valid votes/Expense limit | 18,468 | 100.0 | – | $69,664.10 | ||||
| Total rejected ballots | 113 | 0.61 | -0.16 | |||||
| Turnout | 18,581 | 70.10 | +3.96 | |||||
| Eligible voters | 26,507 | |||||||
| Liberal hold | Swing | -5.59 | ||||||
| Sources:[7][8] | ||||||||
2008 general election
| 2008 Canadian federal election | ||||||||
|---|---|---|---|---|---|---|---|---|
| Party | Candidate | Votes | % | ±% | Expenditures | |||
| Liberal | Shawn Murphy | 8,893 | 50.06 | -0.10 | $66,093.14 | |||
| Conservative | Tom DeBlois | 5,704 | 32.11 | -2.03 | $48,302.66 | |||
| New Democratic | Brian Pollard | 2,187 | 12.31 | +1.19 | $4,744.42 | |||
| Green | Laura Bisaillon | 858 | 4.83 | +1.76 | $1,257.27 | |||
| Christian Heritage | Baird Judson | 124 | 0.70 | +0.19 | $8,750.00 | |||
| Total valid votes/Expense limit | 17,776 | 100.0 | – | $67,455 | ||||
| Total rejected, unmarked and declined ballots | 137 | 0.77 | +0.18 | |||||
| Turnout | 17,913 | 66.14 | -4.61 | |||||
| Eligible voters | 27,083 | |||||||
| Liberal hold | Swing | +0.96 | ||||||
2006 general election
| 2006 Canadian federal election | ||||||||
|---|---|---|---|---|---|---|---|---|
| Party | Candidate | Votes | % | ±% | Expenditures | |||
| Liberal | Shawn Murphy | 9,586 | 50.16 | +0.80 | $60,442.09 | |||
| Conservative | Tom DeBlois | 6,524 | 34.14 | +6.59 | $60,317.15 | |||
| New Democratic | Brian Pollard | 2,126 | 11.12 | -7.32 | $5,251.38 | |||
| Green | David Daughton | 586 | 3.07 | -1.02 | $780.62 | |||
| Marijuana | Andrew J. Chisholm | 193 | 1.01 | – | none listed | |||
| Christian Heritage | Baird Judson | 97 | 0.51 | -0.05 | $5,346.77 | |||
| Total valid votes/Expense limit | 19,112 | 100.0 | – | $62,665 | ||||
| Total rejected, unmarked and declined ballots | 114 | 0.59 | -0.12 | |||||
| Turnout | 19,226 | 70.75 | +3.45 | |||||
| Eligible voters | 27,175 | |||||||
| Liberal hold | Swing | -2.90 | ||||||
2004 general election
| 2004 Canadian federal election | ||||||||
|---|---|---|---|---|---|---|---|---|
| Party | Candidate | Votes | % | ±% | Expenditures | |||
| Liberal | Shawn Murphy | 9,175 | 49.36 | +6.80 | $59,677.46 | |||
| Conservative | Darren Peters | 5,121 | 27.55 | -7.80 | $60,605.56 | |||
| New Democratic | Dody Crane | 3,428 | 18.44 | -2.91 | $13,197.84 | |||
| Green | Will McFadden | 760 | 4.09 | – | $1,647.47 | |||
| Christian Heritage | Baird Judson | 105 | 0.56 | – | $2,837.13 | |||
| Total valid votes/Expense limit | 18,589 | 100.0 | – | $61,440 | ||||
| Total rejected, unmarked and declined ballots | 133 | 0.71 | ||||||
| Turnout | 18,722 | 67.30 | ||||||
| Eligible voters | 27,820 | |||||||
| Liberal notional hold | Swing | +7.30 | ||||||
| Changes from 2000 are based on redistributed results. Change for the Conservatives is based on the combined total of the Progressive Conservatives and the Canadian Alliance. | ||||||||
| 2000 federal election redistributed results | |||
|---|---|---|---|
| Party | Vote | % | |
| Liberal | 7,427 | 42.56 | |
| Progressive Conservative | 5,270 | 30.20 | |
| New Democratic | 3,725 | 21.35 | |
| Alliance | 899 | 5.15 | |
| Others | 129 | 0.74 | |
Hillsborough
2000 general election
| 2000 Canadian federal election: Hillsborough | ||||||||
|---|---|---|---|---|---|---|---|---|
| Party | Candidate | Votes | % | |||||
| Liberal | Shawn Murphy | 8,277 | 41.81 | |||||
| Progressive Conservative | Darren Peters | 6,039 | 30.50 | |||||
| New Democratic | Dody Crane | 4,328 | 21.86 | |||||
| Alliance | Gerry Stewart | 1,005 | 5.08 | |||||
| Natural Law | Peter Cameron | 92 | 0.46 | |||||
| Independent | Baird Judson | 58 | 0.29 | |||||
| Turnout | 19,895 | 67.2 | ||||||
1997 general election
| 1997 Canadian federal election | ||||||||
|---|---|---|---|---|---|---|---|---|
| Party | Candidate | Votes | % | ±% | ||||
| Liberal | George Proud | 7,630 | 40.87 | |||||
| New Democratic | Dody Crane | 5,751 | 30.80 | |||||
| Progressive Conservative | Mitchell Tweel | 4,594 | 24.61 | |||||
| Reform | Blaine Jensen | 476 | 2.55 | |||||
| Christian Heritage | Baird Judson | 145 | 0.78 | |||||
| Natural Law | Paula Price | 74 | 0.40 | |||||
| Turnout | 18,847 | 71.2% | ||||||
1993 general election
| 1993 Canadian federal election | ||||||||
|---|---|---|---|---|---|---|---|---|
| Party | Candidate | Votes | % | ±% | ||||
| Liberal | George Proud | 11,976 | 60.57 | |||||
| Progressive Conservative | Thomas McMillan | 5,269 | 26.65 | |||||
| New Democratic | Dody Crane | 1,143 | 5.78 | |||||
| Reform | Freeman T. Whitty | 744 | 3.76 | |||||
| National | Dave Patterson | 350 | 1.77 | |||||
| Christian Heritage | Baird Judson | 167 | 0.84 | |||||
| Natural Law | Peter Cameron | 123 | 0.62 | |||||
1988 general election
| 1988 Canadian federal election | ||||||||
|---|---|---|---|---|---|---|---|---|
| Party | Candidate | Votes | % | ±% | ||||
| Liberal | George Proud | 8,897 | 43.68 | |||||
| Progressive Conservative | Thomas McMillan | 8,638 | 42.41 | |||||
| New Democratic | Dody Crane | 1,984 | 5.78 | |||||
| Independent | David Weale | 569 | 2.79 | |||||
| Christian Heritage | Baird Judson | 281 | 1.38 | |||||
1984 general election
| 1984 Canadian federal election | ||||||||
|---|---|---|---|---|---|---|---|---|
| Party | Candidate | Votes | % | ±% | ||||
| Progressive Conservative | Thomas McMillan | 9,158 | 53.20 | |||||
| Liberal | Gerry Birt | 6,768 | 39.32 | |||||
| New Democratic | David Burke | 846 | 4.91 | |||||
| Independent | Big John Muise | 323 | 1.88 | |||||
| Independent | Izzurd Goat McFadden | 82 | 0.48 | |||||
| Green | David Daughton | 37 | 0.21 | |||||
1980 general election
| 1980 Canadian federal election | ||||||||
|---|---|---|---|---|---|---|---|---|
| Party | Candidate | Votes | % | ±% | ||||
| Progressive Conservative | Thomas McMillan | 7,128 | 47.66 | |||||
| Liberal | Gerry Birt | 6,555 | 43.83 | |||||
| New Democratic | Bob Crockett | 1,245 | 8.32 | |||||
| Marxist–Leninist | Kathryn Schmidt | 28 | 0.19 | |||||
1979 general election
| 1979 Canadian federal election | ||||||||
|---|---|---|---|---|---|---|---|---|
| Party | Candidate | Votes | % | ±% | ||||
| Progressive Conservative | Thomas McMillan | 8,338 | 54.99 | |||||
| Liberal | Gordon Tweedy | 5,319 | 35.08 | |||||
| New Democratic | Bob Crockett | 1,453 | 9.58 | |||||
| Libertarian | Garry Anstett | 54 | 0.36 | |||||
1974 general election
| 1974 Canadian federal election | ||||||||
|---|---|---|---|---|---|---|---|---|
| Party | Candidate | Votes | % | ±% | ||||
| Progressive Conservative | Heath MacQuarrie | 9,917 | 50.36 | |||||
| Liberal | George Chandler | 8,577 | 43.56 | |||||
| New Democratic | Preston MacLeod | 1,197 | 6.08 | |||||
1972 general election
| 1972 Canadian federal election | ||||||||
|---|---|---|---|---|---|---|---|---|
| Party | Candidate | Votes | % | ±% | ||||
| Progressive Conservative | Heath MacQuarrie | 10,605 | 55.13 | |||||
| Liberal | Ian Glass | 7,168 | 37.26 | |||||
| New Democratic | Etsel Ross | 1,464 | 7.61 | |||||
1968 general election
| 1968 Canadian federal election | ||||||||
|---|---|---|---|---|---|---|---|---|
| Party | Candidate | Votes | % | ±% | ||||
| Progressive Conservative | Heath MacQuarrie | 8,328 | 54.99 | |||||
| Liberal | Jack McAndrew | 6,447 | 41.05 | |||||
| New Democratic | David Hall | 930 | 5.92 | |||||
Student Vote results
In a Student Vote, participating Canadian schools to parallel the Canadian federal election results. The vote was designed to educate students and simulate the electoral process for persons who have not yet reached the legal majority. Schools with a large student body that reside in another electoral district had the option to vote for candidates outside of the electoral district then where they were physically located.[9]

2019 election
| 2019 Canadian federal election | ||||||||
|---|---|---|---|---|---|---|---|---|
| Party | Candidate | Votes | % | ±% | ||||
| Liberal | Sean Casey | 1,002 | 32.01 | -9.52 | ||||
| Green | Darcie Lanthier | 983 | 31.41 | +7.7 | ||||
| Conservative | Robert Campell | 536 | 17.12 | +5.05 | ||||
| New Democratic | Joe Byrne | 470 | 15.02 | -7.66 | ||||
| Christian Heritage | Fred MacLeod | 139 | 4.44 | New | ||||
| Total Valid Votes | 3,130 | 100.0 | ||||||
| Source: Student Vote[10] | ||||||||
2015 election
| 2015 Canadian federal election | ||||||||
|---|---|---|---|---|---|---|---|---|
| Party | Candidate | Votes | % | ±% | ||||
| Liberal | Sean Casey | 1,280 | 41.53 | +13.3 | ||||
| Green | Becka Viau | 731 | 23.72 | +8.37 | ||||
| New Democratic | Joe Byrne | 699 | 22.68 | -7.24 | ||||
| Conservative | Ron MacMillan | 372 | 12.07 | -9.19 | ||||
| Total Valid Votes | 3,082 | 100.0 | ||||||
2011 election
| 2011 Canadian federal election | ||||||||
|---|---|---|---|---|---|---|---|---|
| Party | Candidate | Votes | % | |||||
| New Democratic | Joe Byrne | 785 | 29.92 | |||||
| Liberal | Sean Casey | 767 | 29.23 | |||||
| Conservative | Donna Profit | 558 | 21.26 | |||||
| Green | Eliza Knockwood | 402 | 15.32 | |||||
| Christian Heritage | Baird Judson | 112 | 4.27 | |||||
| Total valid votes | 2,624 | 100.00 | ||||||
See also
- List of Canadian federal electoral districts
- Past Canadian electoral districts
References
- "(Code 11002) Census Profile". 2011 census. Statistics Canada. 2012. Retrieved 2011-03-03.
- Riding history for Hillsborough (1966–2003) from the Library of Parliament
- Riding history for Charlottetown (2003–) from the Library of Parliament
- "Canada Votes 2006". CBC News. Retrieved 20 December 2010.
Notes
- Statistics Canada: 2012
- "Electoral District Profile - Charlottetown (Prince Edward Island)". elections.ca. Elections Canada. Retrieved 23 August 2018.
- https://www12.statcan.gc.ca/census-recensement/2016/dp-pd/dt-td/Rp-eng.cfm?LANG=E&APATH=3&DETAIL=0&DIM=0&FL=A&FREE=0&GC=0&GID=0&GK=0&GRP=1&PID=109979&PRID=10&PTYPE=109445&S=0&SHOWALL=0&SUB=888&Temporal=2016,2017&THEME=118&VID=0&VNAMEE=&VNAMEF=
- "Results Validated by the Returning Officer". Elections Canada. Retrieved 25 October 2019.
- "October 19, 2015 Election Results — Charlottetown (Validated results)". Elections Canada. 20 October 2015. Retrieved 24 October 2015.
- Elections Canada – Preliminary Election Expenses Limits for Candidates Archived August 15, 2015, at the Wayback Machine
- Elections Canada – Official voting results, Forty-first general election, 2011
- Elections Canada – Candidate's electoral campaign return, 41st general election
- "School by School results". Student Vote Canada. Archived from the original on 2015-05-06. Retrieved 2013-06-12.
- "Student Vote Canada 2019 Results". Student Vote Canada 2019. Retrieved June 12, 2020.