Federal tax revenue by state
This is a table of the total federal tax revenue by state, federal district, and territory collected by the U.S. Internal Revenue Service.
| This article is part of a series on |
| Taxation in the United States |
|---|
|
|
|
|
|
Gross Collections indicates the total federal tax revenue collected by the IRS from each U.S. state, the District of Columbia, and the Puerto Rico. The figure includes all Individual federal taxes and Corporate Federal Taxes, income taxes, payroll taxes, estate taxes, gift taxes, and excise taxes. This table does not include federal tax revenue data from U.S. Armed Forces personnel stationed overseas, U.S. territories other than Puerto Rico, and U.S. citizens and legal residents living abroad, even though they may be required to pay federal taxes.
Fiscal Year 2018
This table lists the tax revenue collected from each state, plus the District of Columbia and the territory of Puerto Rico by the IRS in fiscal year 2018, which ran from October 1, 2017, through September 30, 2018. The gross collections total only reflects the revenue collected from the categories listed in the table, and not the entire revenue collected by the IRS. [1]
| State federal district or territory |
Gross collections [1]
($) |
|---|---|
| California | 456,555,954,000 |
| New York | 281,220,376,000 |
| Texas | 280,048,364,000 |
| Florida | 205,694,126,000 |
| Illinois | 161,189,282,000 |
| New Jersey | 138,976,784,000 |
| Ohio | 140,891,209,000 |
| Pennsylvania | 136,268,950,000 |
| Massachusetts | 117,998,443,000 |
| Minnesota | 99,354,057,000 |
| Georgia | 92,804,948,000 |
| Virginia | 84,844,999,000 |
| North Carolina | 82,539,491,000 |
| Michigan | 83,256,186,000 |
| Washington | 90,404,108,000 |
| Missouri | 63,139,167,000 |
| Maryland | 72,561,209,000 |
| Tennessee | 68,888,235,000 |
| Connecticut | 53,729,155,000 |
| Indiana | 58,698,927,000 |
| Wisconsin | 51,992,826,000 |
| Colorado | 58,707,795,000 |
| Arizona | 46,226,885,000 |
| Louisiana | 41,982,123,000 |
| Oklahoma | 27,908,169,000 |
| Kentucky | 34,754,947,000 |
| Arkansas | 32,029,540,000 |
| Oregon | 33,802,142,000 |
| Kansas | 25,813,743,000 |
| District of Columbia | 28,443,717,000 |
| Nebraska | 25,312,311,000 |
| Alabama | 26,724,809,000 |
| South Carolina | 28,552,567,000 |
| Iowa | 25,111,982,000 |
| Delaware | 19,038,671,000 |
| Utah | 23,401,402,000 |
| Nevada | 23,317,912,000 |
| Rhode Island | 14,725,607,000 |
| Mississippi | 11,460,401,000 |
| New Hampshire | 12,291,272,000 |
| Idaho | 10,858,404,000 |
| New Mexico | 9,002,297,000 |
| Hawaii | 9,591,724,000 |
| South Dakota | 8,200,403,000 |
| North Dakota | 6,578,855,000 |
| Maine | 7,925,462,000 |
| West Virginia | 6,911,139,000 |
| Montana | 6,229,347,000 |
| Alaska | 5,287,377,000 |
| Wyoming | 4,930,650,000 |
| Vermont | 4,417,527,000 |
| Puerto Rico | 3,443,334,000 |
| TOTAL | 3,444,039,309,000 |
No data for Guam is available for 2018. [1]
Fiscal Year 2017
This table lists the tax revenue collected from each state, plus the District of Columbia and the territory of Puerto Rico by the IRS in fiscal year 2018, which ran from October 1, 2016, through September 30, 2017. The gross collections total only reflects the revenue collected from the categories listed in the table, and not the entire revenue collected by the IRS. [1]
| State federal district or territory |
Gross collections [1]
($) |
|---|---|
| California | 440,475,243,000 |
| Texas | 270,955,237,000 |
| New York | 268,353,669,000 |
| Florida | 192,869,033,000 |
| Illinois | 162,326,463,000 |
| New Jersey | 143,835,479,000 |
| Ohio | 142,086,312,000 |
| Pennsylvania | 139,797,047,000 |
| Massachusetts | 112,996,320,000 |
| Minnesota | 104,429,577,000 |
| Georgia | 94,277,375,000 |
| Virginia | 87,183,756,000 |
| North Carolina | 82,855,993,000 |
| Michigan | 82,676,161,000 |
| Washington | 85,875,647,000 |
| Missouri | 71,921,135,000 |
| Maryland | 71,246,920,000 |
| Tennessee | 69,069,233,000 |
| Connecticut | 57,540,270,000 |
| Indiana | 58,940,989,000 |
| Wisconsin | 53,089,052,000 |
| Colorado | 56,742,235,000 |
| Arizona | 43,928,177,000 |
| Louisiana | 42,724,672,000 |
| Oklahoma | 27,113,120,000 |
| Kentucky | 35,126,897,000 |
| Arkansas | 32,458,328,000 |
| Oregon | 32,345,824,000 |
| Kansas | 25,563,140,000 |
| District of Columbia | 28,302,953,000 |
| Nebraska | 25,450,002,000 |
| Alabama | 26,583,916,000 |
| South Carolina | 26,636,069,000 |
| Iowa | 24,642,287,000 |
| Delaware | 17,081,357,000 |
| Utah | 22,485,663,000 |
| Nevada | 21,570,670,000 |
| Rhode Island | 14,917,462,000 |
| Mississippi | 11,740,655,000 |
| New Hampshire | 12,138,352,000 |
| Idaho | 10,386,020,000 |
| New Mexico | 8,979,166,000 |
| Hawaii | 9,415,214,000 |
| South Dakota | 7,872,916,000 |
| North Dakota | 6,640,269,000 |
| Maine | 8,083,275,000 |
| West Virginia | 6,980,482,000 |
| Montana | 6,080,381,000 |
| Alaska | 5,399,946,000 |
| Wyoming | 4,393,700,000 |
| Vermont | 4,422,942,000 |
| Puerto Rico | 3,393,432,000 |
| TOTAL | 3,402,400,432,000 |
No data for Guam is available for 2017. [1]
Fiscal Year 2015
This table lists the tax revenue collected from each state, plus the District of Columbia and the territory of Puerto Rico by the IRS in fiscal year 2015, which ran from October 1, 2014, through September 30, 2015. The gross collections total only reflects the revenue collected from the categories listed in the table, and not the entire revenue collected by the IRS. Per capita values are based on population estimates from the Census Bureau for July 1, 2015.[2]
| Rank | State federal district or territory |
Gross collections[3] | Revenue per capita (est.) | Ratio to GSP |
|---|---|---|---|---|
| 1 | California | $405,851,295,000 | $10,408 | 16.6% |
| 2 | Texas | $279,904,425,000 | $10,204 | 17.1% |
| 3 | New York | $269,716,999,000 | $13,659 | 18.5% |
| 4 | Florida | $177,389,488,000 | $8,762 | 19.9% |
| 5 | Illinois | $158,042,273,000 | $12,310 | 20.5% |
| 6 | New Jersey | $153,917,572,000 | $17,226 | 26.6% |
| 7 | Ohio | $140,981,150,000 | $12,148 | 23.5% |
| 8 | Pennsylvania | $136,108,810,000 | $10,640 | 19.9% |
| 9 | Massachusetts | $108,049,205,000 | $15,927 | 22.6% |
| 10 | Minnesota | $106,927,808,000 | $19,504 | 31.9% |
| 11 | Georgia | $86,446,602,000 | $8,476 | 17.2% |
| 12 | Virginia | $80,242,853,000 | $9,590 | 16.7% |
| 13 | North Carolina | $78,736,401,000 | $7,846 | 15.4% |
| 14 | Michigan | $77,948,414,000 | $7,860 | 16.7% |
| 15 | Washington | $73,334,437,000 | $10,242 | 16.3% |
| 16 | Missouri | $64,112,504,000 | $10,551 | 22.1% |
| 17 | Maryland | $63,936,798,000 | $10,665 | 17.5% |
| 18 | Tennessee | $62,708,662,000 | $9,508 | 20.2% |
| 19 | Connecticut | $59,174,581,000 | $16,507 | 22.6% |
| 20 | Indiana | $57,972,825,000 | $8,767 | 17.5% |
| 21 | Wisconsin | $51,748,831,000 | $8,972 | 17.2% |
| 22 | Colorado | $47,210,720,000 | $8,664 | 14.8% |
| 23 | Arizona | $42,631,316,000 | $6,253 | 14.3% |
| 24 | Louisiana | $42,628,150,000 | $9,130 | 16.8% |
| 25 | Oklahoma | $33,942,286,000 | $8,687 | 18.9% |
| 26 | Kentucky | $32,708,391,000 | $7,392 | 16.8% |
| 27 | Arkansas | $32,508,761,000 | $10,917 | 26.3% |
| 28 | Oregon | $31,219,148,000 | $7,757 | 13.7% |
| 29 | Kansas | $27,019,291,000 | $9,295 | 18.1% |
| 30 | District of Columbia | $25,583,750,000 | $38,163 | 20.8% |
| 31 | Nebraska | $25,103,770,000 | $13,256 | 22.4% |
| 32 | Alabama | $25,070,261,000 | $5,165 | 12.0% |
| 33 | South Carolina | $24,086,257,000 | $4,921 | 12.1% |
| 34 | Iowa | $23,969,391,000 | $7,678 | 14.0% |
| 35 | Delaware | $22,640,853,000 | $23,982 | 34.2% |
| 36 | Utah | $20,178,718,000 | $6,747 | 13.6% |
| 37 | Nevada | $18,450,072,000 | $6,398 | 13.1% |
| 38 | Rhode Island | $14,373,318,000 | $13,616 | 25.5% |
| 39 | Mississippi | $11,468,660,000 | $3,836 | 10.7% |
| 40 | New Hampshire | $11,314,985,000 | $8,507 | 15.8% |
| 41 | Idaho | $9,785,027,000 | $5,920 | 15.0% |
| 42 | New Mexico | $8,969,666,000 | $4,312 | 9.9% |
| 43 | Hawaii | $8,221,290,000 | $5,769 | 10.3% |
| 44 | South Dakota | $7,732,138,000 | $9,013 | 17.0% |
| 45 | North Dakota | $7,711,243,000 | $10,189 | 14.4% |
| 46 | Maine | $7,464,280,000 | $5,615 | 13.5% |
| 47 | West Virginia | $7,374,299,000 | $4,005 | 10.4% |
| 48 | Montana | $5,805,098,000 | $5,625 | 12.7% |
| 49 | Alaska | $5,717,640,000 | $7,751 | 10.5% |
| 50 | Wyoming | $5,284,146,000 | $9,009 | 13.2% |
| 51 | Vermont | $4,495,280,000 | $7,180 | 15.1% |
| Puerto Rico[4] | $3,524,557,000 | $1,015 | N/A | |
| TOTAL[5] | $3,283,920,138,000 | $10,234 | 18.3% |
GSP is the Gross State Product
Fiscal Year 2012
This table lists the tax revenue collected from each state, plus the District of Columbia and the territory of Puerto Rico by the IRS in fiscal year 2012, which ran from October 1, 2011, through September 30, 2012. The gross collections total only reflects the revenue collected from the categories listed in the table, and not the entire revenue collected by the IRS. Per capita values are based on population estimates from the Census Bureau for July 1, 2012.[6]
| Rank | State federal district or territory |
Gross collections[7] | Revenue per capita (est.) | Ratio to GSP[8] |
|---|---|---|---|---|
| 1 | California | $292,563,574,000 | $7,690.66 | 14.6% |
| 2 | Texas | $219,459,878,000 | $8,421.59 | 15.7% |
| 3 | New York | $201,167,954,000 | $10,279.27 | 16.7% |
| 4 | Illinois | $124,431,227,000 | $9,664.37 | 17.9% |
| 5 | Florida | $122,249,635,000 | $6,328.42 | 15.7% |
| 6 | New Jersey | $111,377,490,000 | $12,564.31 | 21.9% |
| 7 | Ohio | $111,094,276,000 | $9,623.36 | 21.8% |
| 8 | Pennsylvania | $108,961,515,000 | $8,536.94 | 18.1% |
| 9 | Massachusetts | $79,826,976,000 | $12,011.02 | 19.8% |
| 10 | Minnesota | $78,685,402,000 | $14,627.88 | 26.7% |
| 11 | Georgia | $65,498,308,000 | $6,602.69 | 15.1% |
| 12 | Virginia | $64,297,400,000 | $7,854.68 | 14.4% |
| 13 | North Carolina | $61,600,064,000 | $6,316.61 | 13.5% |
| 14 | Michigan | $59,210,158,000 | $5,990.89 | 14.8% |
| 15 | Washington | $52,443,862,000 | $7,603.85 | 14.0% |
| 16 | Indiana | $51,238,512,000 | $7,837.83 | 17.2% |
| 17 | Missouri | $48,413,247,000 | $8,039.41 | 18.7% |
| 18 | Maryland | $48,107,002,000 | $8,175.12 | 15.1% |
| 19 | Connecticut | $47,262,702,000 | $13,163.83 | 20.6% |
| 20 | Tennessee | $47,010,303,000 | $7,281.37 | 17.0% |
| 21 | Wisconsin | $41,498,033,000 | $7,246.80 | 15.9% |
| 22 | Colorado | $41,252,701,000 | $7,952.20 | 15.1% |
| 23 | Arizona | $34,850,436,000 | $5,318.03 | 13.1% |
| 24 | Louisiana | $34,811,072,000 | $7,564.51 | 14.3% |
| 25 | Oklahoma | $27,087,264,000 | $7,100.54 | 16.8% |
| 26 | Arkansas | $25,299,832,000 | $8,578.74 | 23.1% |
| 27 | Kentucky | $25,085,813,000 | $5,726.81 | 14.5% |
| 28 | Oregon | $22,716,602,000 | $5,825.74 | 11.4% |
| 29 | Kansas | $21,904,615,000 | $7,590.21 | 15.8% |
| 30 | Delaware | $21,835,412,000 | $23,809.40 | 33.1% |
| 31 | Alabama | $20,882,949,000 | $4,330.74 | 11.4% |
| District of Columbia[9] | $20,747,652,000 | $32,811.79 | 18.9% | |
| 32 | Nebraska | $19,795,254,000 | $10,668.28 | 19.9% |
| 33 | Iowa | $18,753,596,000 | $6,100.35 | 12.3% |
| 34 | South Carolina | $18,557,166,000 | $3,928.50 | 10.5% |
| 35 | Utah | $15,642,129,000 | $5,478.30 | 12.0% |
| 36 | Nevada | $13,727,425,000 | $4,975.63 | 10.3% |
| 37 | Rhode Island | $10,992,338,000 | $10,465.98 | 21.6% |
| 38 | Mississippi | $10,458,549,000 | $3,503.79 | 10.3% |
| 39 | New Hampshire | $8,807,691,000 | $6,668.87 | 13.6% |
| 40 | New Mexico | $7,866,206,000 | $3,771.79 | 9.8% |
| 41 | Idaho | $7,622,490,000 | $4,776.81 | 13.1% |
| 42 | Hawaii | $6,511,578,000 | $4,676.81 | 9.0% |
| 43 | West Virginia | $6,498,502,000 | $3,502.46 | 9.4% |
| 44 | Maine | $6,229,189,000 | $4,686.45 | 11.6% |
| 45 | North Dakota | $5,664,860,000 | $8,096.96 | 12.3% |
| 46 | South Dakota | $5,136,249,000 | $6,163.35 | 12.1% |
| 47 | Alaska | $4,898,780,000 | $6,697.36 | 9.4% |
| 48 | Montana | $4,383,727,000 | $4,361.31 | 10.8% |
| 49 | Wyoming | $3,828,379,000 | $6,641.74 | 10.0% |
| 50 | Vermont | $3,524,887,000 | $5,630.71 | 12.9% |
| Puerto Rico[4] | $3,067,234,000 | $836.42 | N/A | |
| TOTAL[5] | $2,514,838,095,000 | 7,918.73 (US Avg.) | 16.1% |
GSP is the Gross State Product
Fiscal Year 2011
This table lists the tax revenue collected from each state, plus the District of Columbia and the territory of Puerto Rico by the IRS in fiscal year 2011, which ran from October 1, 2010, through September 30, 2011. The gross collections total only reflects the revenue collected from the categories listed in the table, and not the entire revenue collected by the IRS. Per capita values are based on population estimates from the Census Bureau for July 1, 2011.[10]
| Rank | State federal district or territory |
Gross collections[11] | Revenue per capita (est.) | Ratio to GSP |
|---|---|---|---|---|
| 1 | California | $281,227,298,000 | $7,462.79 | 14.4% |
| 2 | New York | $202,149,306,000 | $10,365.77 | 17.5% |
| 3 | Texas | $198,295,817,000 | $7,736.33 | 15.2% |
| 4 | Illinois | $119,116,442,000 | $9,262.73 | 17.8% |
| 5 | Florida | $116,758,697,000 | $6,118.70 | 15.5% |
| 6 | New Jersey | $112,103,329,000 | $12,688.87 | 23.0% |
| 7 | Ohio | $112,069,407,000 | $9,710.54 | 23.2% |
| 8 | Pennsylvania | $103,134,437,000 | $8,092.82 | 17.8% |
| 9 | Massachusetts | $77,218,196,000 | $11,687.33 | 19.7% |
| 10 | Minnesota | $72,676,800,000 | $13,591.31 | 25.8% |
| 11 | Georgia | $60,601,096,000 | $6,175.93 | 14.5% |
| 12 | Virginia | $60,074,032,000 | $7,412.54 | 14.0% |
| 13 | North Carolina | $56,809,844,000 | $5,886.36 | 12.9% |
| 14 | Michigan | $55,625,833,000 | $5,631.97 | 14.4% |
| 15 | Washington | $52,531,569,000 | $7,698.89 | 14.8% |
| 16 | Maryland | $49,083,255,000 | $8,405.28 | 16.3% |
| 17 | Missouri | $46,794,981,000 | $7,787.50 | 18.8% |
| 18 | Connecticut | $45,561,956,000 | $12,702.97 | 19.8% |
| 19 | Tennessee | $45,189,610,000 | $7,061.11 | 17.0% |
| 20 | Indiana | $43,886,554,000 | $6,734.83 | 15.8% |
| 21 | Colorado | $40,328,519,000 | $7,882.36 | 15.3% |
| 22 | Wisconsin | $38,866,764,000 | $6,806.98 | 15.3% |
| 23 | Louisiana | $35,888,004,000 | $7,844.77 | 14.5% |
| 24 | Arizona | $32,920,415,000 | $5,090.28 | 12.7% |
| 25 | Arkansas | $26,326,077,000 | $8,958.77 | 24.9% |
| 26 | Kentucky | $24,451,664,000 | $5,599.43 | 14.8% |
| 27 | Oklahoma | $24,400,086,000 | $6,447.95 | 15.7% |
| 28 | Oregon | $22,366,343,000 | $5,782.06 | 11.5% |
| 29 | Delaware | $21,088,276,000 | $23,221.47 | 32.1% |
| 30 | Alabama | $20,394,671,000 | $4,245.63 | 11.8% |
| 31 | Kansas | $19,758,229,000 | $6,883.47 | 15.1% |
| District of Columbia | $19,619,128,000 | $31,693.85 | 18.2% | |
| 32 | Iowa | $17,805,295,000 | $5,810.94 | 12.0% |
| 33 | South Carolina | $17,465,006,000 | $3,737.15 | 10.5% |
| 34 | Nebraska | $15,664,192,000 | $8,502.82 | 16.6% |
| 35 | Utah | $14,700,936,000 | $5,223.57 | 11.8% |
| 36 | Nevada | $13,032,725,000 | $4,791.39 | 10.0% |
| 37 | Rhode Island | $10,428,091,000 | $9,925.41 | 20.8% |
| 38 | Mississippi | $9,183,541,000 | $3,084.36 | 9.4% |
| 39 | New Hampshire | $8,702,370,000 | $6,603.68 | 13.7% |
| 40 | New Mexico | $8,039,313,000 | $3,867.52 | 10.1% |
| 41 | West Virginia | $6,386,378,000 | $3,442.96 | 9.6% |
| 42 | Idaho | $6,345,865,000 | $4,006.88 | 11.0% |
| 43 | Maine | $6,153,147,000 | $4,631.50 | 11.9% |
| 44 | Hawaii | $6,127,725,000 | $4,446.41 | 9.1% |
| 45 | North Dakota | $4,917,384,000 | $7,181.39 | 12.2% |
| 46 | Alaska | $4,860,572,000 | $6,714.80 | 9.5% |
| 47 | South Dakota | $4,624,947,000 | $5,615.57 | 11.5% |
| 48 | Montana | $4,197,002,000 | $4,206.82 | 11.0% |
| 49 | Wyoming | $3,516,453,000 | $6,197.97 | 9.3% |
| 50 | Vermont | $3,333,342,000 | $5,319.80 | 12.9% |
| Puerto Rico | $3,313,199,000 | $896.89 | N/A | |
| TOTAL[5] | $2,406,114,118,000 | 7,631.63 (Avg.) | 16.0% |
Maps and graphs
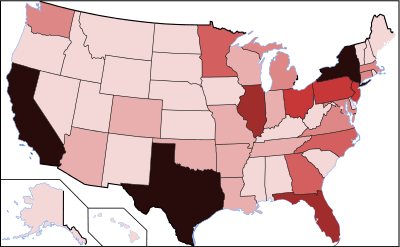
Legend:
|
<$25 billion
$25-$50 billion
$50-$75 billion
|
$75-$100 billion
$100-$125 billion
$125-$150 billion
|
$150-$175 billion
$175-$200 billion
>$200 billion
|
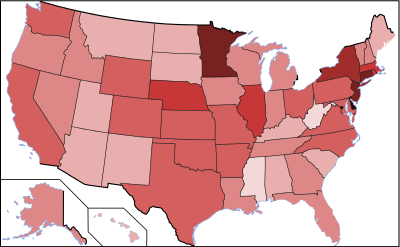
Legend:
|
<$4,000
$4,000-$6,000
$6,000-$8,000
|
$8,000-$10,000
$10,000-$12,000
$12,000-$14,000
|
$14,000-$16,000
$16,000-$18,000
>$18,000
|
_1950_-_2010.gif)
See also
Federal taxes:
State taxes:
General:
Notes
- "SOI Tax Stats". Retrieved 29 June 2019.
- "Table 1. Annual Estimates of the Resident Population for the United States, Regions, States, and Puerto Rico: April 1, 2010 to July 1, 2016 (NST-EST2016-01)". Census.gov. U.S. Census Bureau, Population Division. December 2016. Retrieved 3 February 2017.
- "Internal Revenue Service Data Book, 2015" (PDF). IRS.gov. Statistics of Income Division, Communications and Data Dissemination Section. p. 12. Retrieved 3 February 2017.
- Puerto Rico is not a U.S. state but residents pay federal taxes; however, most are not required to pay federal income tax.
- ratio to GSP is excluding Puerto Rico
- "Table 1. Annual Estimates of the Population for the United States, Regions, States, and Puerto Rico: April 1, 2010 to July 1, 2012 (NST-EST2012-01)". Census.gov. U.S. Census Bureau, Population Division. December 2012. Retrieved 4 November 2013.
- "Internal Revenue Service Data Book, 2012" (PDF). IRS.gov. Statistics of Income Division, Communications and Data Dissemination Section. p. 12. Retrieved 4 November 2013.
- https://www.bea.gov/newsreleases/regional/gdp_state/2013/pdf/gsp0613.pdf
- The District of Columbia is not a U.S. state, but its residents pay federal taxes.
- "Table 1. Annual Estimates of the Population for the United States, Regions, States, and Puerto Rico: April 1, 2010 to July 1, 2012 (NST-EST2012-01)" (xls). Census.gov. U.S. Census Bureau, Population Division. December 2012. Retrieved 4 November 2013.
- "Internal Revenue Service Data Book, 2011" (PDF). IRS.gov. Statistics of Income Division, Communications and Data Dissemination Section. p. 12. Retrieved 4 November 2013.
New table is available for 2015 to update the data. Also - would be good to be able to see some trends in the data in terms of growth by state in terms of taxes paid
References
- 2007 Population, US Census.
- Total Tax Revenue By Type and State Fiscal Year 2007 (XLS)