Demographics of Denmark
This article is about the demographic features of the population of Denmark, including population density, ethnicity, education level, health of the populace, economic status, religious affiliations and other aspects of the population.
National demographics
Since 1980, the number of Danes has remained constant at around 5 million in Denmark and nearly all the population growth from 5.1 up to the 2018 total of 5.8 million was due to immigration.[1]
According to 2017 figures from Statistics Denmark, 86.9%[2][3] of Denmark's population of over 5,760,694 was of Danish descent, defined as having at least one parent who was born in Denmark and has Danish citizenship.[4][2] The remaining 13.1% were of a foreign background, defined as immigrants or descendants of recent immigrants. With the same definition, the most common countries of origin were Poland, Turkey, Germany, Iraq, Romania, Syria, Somalia, Iran, Afghanistan, and Yugoslavia and its successor states. More than 752,618 individuals (13.1%)[2][3] are migrants and their descendants (146,798 second generation migrants born in Denmark[3]).
Of these 752,618[2] immigrants and their descendants:
- 267,606 (36%)[3] have a Western background (Norway, Germany, Bosnia and Herzegovina, UK, Poland, Romania and Iceland; definition: EU countries, non-EU Nordic countries, Andorra, Liechtenstein, Monaco, San Marino, Switzerland, Vatican State, Canada, USA, Australia and New Zealand).
- 485,012 (64%)[3] have a non-Western background (Turkey, Romani, Iraq, Iran, Kurdistan, Pakistan, Thailand and Somalia; all other countries).
| Year | Pop. | ±% |
|---|---|---|
| 1870 | 1,784,741 | — |
| 1880 | 1,969,039 | +10.3% |
| 1890 | 2,172,380 | +10.3% |
| 1901 | 2,449,540 | +12.8% |
| 1911 | 2,747,076 | +12.1% |
| 1921 | 3,267,831 | +19.0% |
| 1930 | 3,550,656 | +8.7% |
| 1940 | 3,844,312 | +8.3% |
| 1950 | 4,281,275 | +11.4% |
| 1960 | 4,585,256 | +7.1% |
| 1970 | 4,937,579 | +7.7% |
| 1980 | 5,122,065 | +3.7% |
| 1990 | 5,135,409 | +0.3% |
| 2000 | 5,330,020 | +3.8% |
| 2011 | 5,560,628 | +4.3% |
| 2020 | 5,822,863 | +4.7% |
| Source: Statistics Denmark 2020 estimate[5] | ||
Ethnic groups
Non-Scandinavian ethnic minorities include:
- Afghans
- Inuit (Greenlandic) from the territory of Greenland
- Turks
- Arabs (i.e. Palestinians, followed by Moroccans, Syrians, Yemenis, Egyptians, Iraqis and Jordanians)
- Vietnamese
- Thai
- Lebanese
- Jews
- Chinese
- Pakistanis (including Pashtuns)
- Iranians/Kurdistanis
- Somalis
- Ethiopians
- Sudanese
- Indians
- Chileans (the most numerous of Latin American nationalities)
- Bosniaks
- Poles
- Albanians
- Bangladeshis
Historic minorities
Ethnic minorities in Denmark include a handful of groups:
- Approximately 15,000 people[6] in Denmark belong to a German minority traditionally referred to as hjemmetyskere meaning "domestic Germans" in Danish, and as Nordschleswiger in German. This minority of Germans hold Danish citizenship and self-identify as Germans. Many of them speak German or Low German as their home language. There are also several thousand German citizens and other ethnic Germans residing in Denmark with no historical connection to this group.
- An estimated 23,000 people[7] in Denmark proper are ethnic Faroese, while 19,000 Greenlanders reside permanently in Denmark.[8] Many of these use the Faroese and Greenlandic languages, respectively, as their first language. All residents of the Kingdom (viz. Denmark proper, the Faroe Islands and Greenland) holds Danish citizenship, unless they inherit or otherwise receive a foreign citizenship.
- The religiously affiliated Danish Jews number around 7,000.[9] Secular Jews and unaffiliated ethnic Jews in Denmark number several thousand.
- There are approximately 15,000-20,000 Romani people with historical ties to Denmark, excluding recent immigrants and their immediate descendants.
Modern minorities
| Rank | Country of origin[10] | Population (2020)[11] |
|---|---|---|
| 1. | 73,906 | |
| 2. | 48,719 | |
| 3. | 43,313 | |
| 4. | 34,727 | |
| 5. | 33,712 | |
| 6. | 33,625 | |
| 7. | 30,634 | |
| 8. | 29,747 | |
| 9. | 23,380 | |
| 10. | 21,863 | |
| 11. | 21,166 | |
| 12. | 19,551 | |
| 13. | 17,733 | |
| 14. | 17,517 | |
| 15. | 17,290 | |
| 16. | 16,825 | |
| 17. | 16,036 | |
| 18. | 15,405 | |
| 19. | 15,139 | |
| 20. | 15,103 |
Total fertility rate from 1850 to 1899
The total fertility rate is the number of children born per woman. It is based on fairly good data for the entire period. Sources: Our World In Data and Gapminder Foundation.[12]
| Year | 1850 | 1851 | 1852 | 1853 | 1854 | 1855 | 1856 | 1857 | 1858 | 1859 | 1860[12] |
|---|---|---|---|---|---|---|---|---|---|---|---|
| Total fertility rate in Denmark | 4.24 | 4.06 | 4.48 | 4.27 | 4.41 | 4.31 | 4.37 | 4.44 | 4.48 | 4.53 | 4.4 |
| Year | 1861 | 1862 | 1863 | 1864 | 1865 | 1866 | 1867 | 1868 | 1869 | 1870[12] |
|---|---|---|---|---|---|---|---|---|---|---|
| Total fertility rate in Denmark | 4.27 | 4.17 | 4.17 | 4.06 | 4.21 | 4.32 | 4.09 | 4.18 | 3.96 | 4.1 |
| Year | 1871 | 1872 | 1873 | 1874 | 1875 | 1876 | 1877 | 1878 | 1879 | 1880[12] |
|---|---|---|---|---|---|---|---|---|---|---|
| Total fertility rate in Denmark | 4.06 | 4.09 | 4.16 | 4.17 | 4.31 | 4.4 | 4.36 | 4.27 | 4.3 | 4.28 |
| Year | 1881 | 1882 | 1883 | 1884 | 1885 | 1886 | 1887 | 1888 | 1889 | 1890[12] |
|---|---|---|---|---|---|---|---|---|---|---|
| Total fertility rate in Denmark | 4.34 | 4.36 | 4.29 | 4.5 | 4.39 | 4.37 | 4.28 | 4.25 | 4.21 | 4.11 |
| Year | 1891 | 1892 | 1893 | 1894 | 1895 | 1896 | 1897 | 1898 | 1899[12] |
|---|---|---|---|---|---|---|---|---|---|
| Total fertility rate in Denmark | 4.18 | 4 | 4.16 | 4.1 | 4.09 | 4.11 | 4.02 | 4.08 | 4.01 |
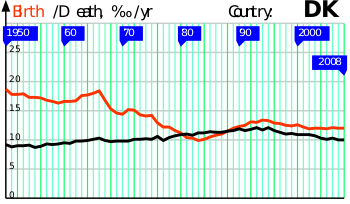
Vital statistics since 1900
Data according to Statistics Denmark, which collects the official statistics for Denmark.[13]
| Average population | Live births | Deaths | Nat. change | Crude birth rate (per 1000) | Crude death rate (per 1000) | Nat. change (per 1000) | Total fertility rate[fn 1] | |
|---|---|---|---|---|---|---|---|---|
| 1900 | 2,432,000 | 72,129 | 40,891 | 31,238 | 29.7 | 16.8 | 12.8 | 4.16 |
| 1901 | 2,463,000 | 73,219 | 38,786 | 34,425 | 29.7 | 15.7 | 14.0 | 4.14 |
| 1902 | 2,494,000 | 72,839 | 36,424 | 36,391 | 29.2 | 14.6 | 14.6 | 4.05 |
| 1903 | 2,525,000 | 72,351 | 36,956 | 35,403 | 28.7 | 14.6 | 14.0 | 3.96 |
| 1904 | 2,546,000 | 73,692 | 35,903 | 37,788 | 28.9 | 14.1 | 14.8 | 3.97 |
| 1905 | 2,574,000 | 73,082 | 38,598 | 34,484 | 28.4 | 15.0 | 13.4 | 3.87 |
| 1906 | 2,603,000 | 74,217 | 35,231 | 38,986 | 28.5 | 13.5 | 15.0 | 3.87 |
| 1907 | 2,635,000 | 74,324 | 37,275 | 37,049 | 28.2 | 14.1 | 14.1 | 3.81 |
| 1908 | 2,668,000 | 76,233 | 39,072 | 37,161 | 28.6 | 14.6 | 13.9 | 3.83 |
| 1909 | 2,702,000 | 76,301 | 35,837 | 40,464 | 28.2 | 13.3 | 15.0 | 3.78 |
| 1910 | 2,737,000 | 75,299 | 35,184 | 40,013 | 27.5 | 12.9 | 14.6 | 3.67 |
| 1911 | 2,770,000 | 73,933 | 37,236 | 36,697 | 26.7 | 13.4 | 13.2 | 3.60 |
| 1912 | 2,802,000 | 74,659 | 36,486 | 38,173 | 26.6 | 13.0 | 13.6 | 3.58 |
| 1913 | 2,833,000 | 72,475 | 35,364 | 37,111 | 25.6 | 12.5 | 13.1 | 3.43 |
| 1914 | 2,866,000 | 73,294 | 35,921 | 37,373 | 25.6 | 12.5 | 13.0 | 3.42 |
| 1915 | 2,901,000 | 70,192 | 37,174 | 33,018 | 24.2 | 12.8 | 11.4 | 3.23 |
| 1916 | 2,936,000 | 71,559 | 39,265 | 32,294 | 24.4 | 13.4 | 11.0 | 3.23 |
| 1917 | 2,972,000 | 70,306 | 39,224 | 31,082 | 23.7 | 13.2 | 10.5 | 3.11 |
| 1918 | 3,006,000 | 72,505 | 39,038 | 33,467 | 24.1 | 13.0 | 11.1 | 3.16 |
| 1919 | 3,041,000 | 68,722 | 39,590 | 29,132 | 22.6 | 13.0 | 9.6 | 2.96 |
| 1920 | 3,079,000 | 78,230 | 39,841 | 38,389 | 25.4 | 12.9 | 12.5 | 3.29 |
| 1921 | 3,283,000 | 78,815 | 36,215 | 42,600 | 24.0 | 11.0 | 13.0 | 3.11 |
| 1922 | 3,318,000 | 73,899 | 39,452 | 34,435 | 22.3 | 11.9 | 10.4 | 2.87 |
| 1923 | 3,352,000 | 74,827 | 37,903 | 36,924 | 22.3 | 11.3 | 11.0 | 2.85 |
| 1924 | 3,389,000 | 73,836 | 38,091 | 35,778 | 21.8 | 11.2 | 10.6 | 2.78 |
| 1925 | 3,425,000 | 71,897 | 37,083 | 34,814 | 21.0 | 10.8 | 10.2 | 2.66 |
| 1926 | 3,452,000 | 70,734 | 38,093 | 32,641 | 20.5 | 11.0 | 9.5 | 2.58 |
| 1927 | 3,475,000 | 68,024 | 40,190 | 27,834 | 19.6 | 11.6 | 8.0 | 2.44 |
| 1928 | 3,497,000 | 68,516 | 38,484 | 30,032 | 19.6 | 11.0 | 8.6 | 2.43 |
| 1929 | 3,518,000 | 65,297 | 39,486 | 25,913 | 18.6 | 11.2 | 7.4 | 2.30 |
| 1930 | 3,542,000 | 66,303 | 38,174 | 28,129 | 18.7 | 10.8 | 7.9 | 2.29 |
| 1931 | 3,569,000 | 64,266 | 40,578 | 23,688 | 18.0 | 11.4 | 6.6 | 2.20 |
| 1932 | 3,603,000 | 64,650 | 39,701 | 24,949 | 17.9 | 11.0 | 6.9 | 2.17 |
| 1933 | 3,633,000 | 62,780 | 38,287 | 24,493 | 17.3 | 10.5 | 6.7 | 2.10 |
| 1934 | 3,666,000 | 65,116 | 38,050 | 27,066 | 17.8 | 10.4 | 7.4 | 2.15 |
| 1935 | 3,695,000 | 65,223 | 40,816 | 24,407 | 17.7 | 11.0 | 6.6 | 2.12 |
| 1936 | 3,722,000 | 66,418 | 40,919 | 25,499 | 17.8 | 11.0 | 6.9 | 2.14 |
| 1937 | 3,749,000 | 67,440 | 40,442 | 26,998 | 18.0 | 10.8 | 7.2 | 2.16 |
| 1938 | 3,777,000 | 68,463 | 39,058 | 29,407 | 18.1 | 10.3 | 7.8 | 2.18 |
| 1939 | 3,805,000 | 67,914 | 38,535 | 29,379 | 17.8 | 10.1 | 7.7 | 2.16 |
| 1940 | 3,832,000 | 70,121 | 39,730 | 30,391 | 18.3 | 10.4 | 7.9 | 2.22 |
| 1941 | 3,863,000 | 71,306 | 39,756 | 31,550 | 18.5 | 10.3 | 8.2 | 2.24 |
| 1942 | 3,903,000 | 79,545 | 37,527 | 42,018 | 20.4 | 9.6 | 10.8 | 2.50 |
| 1943 | 3,949,000 | 84,319 | 37,982 | 46,337 | 21.4 | 9.6 | 11.7 | 2.65 |
| 1944 | 3,998,000 | 90,641 | 41,087 | 49,554 | 22.7 | 10.3 | 12.4 | 2.84 |
| 1945 | 4,045,000 | 95,062 | 42,298 | 52,764 | 23.5 | 10.5 | 13.0 | 2.98 |
| 1946 | 4,101,000 | 96,111 | 42,013 | 54,098 | 23.4 | 10.2 | 13.2 | 3.02 |
| 1947 | 4,146,000 | 91,714 | 40,043 | 51,671 | 22.1 | 9.7 | 12.5 | 2.90 |
| 1948 | 4,190,000 | 84,938 | 35,981 | 48,957 | 20.3 | 8.6 | 11.7 | 2.71 |
| 1949 | 4,230,000 | 79,919 | 37,793 | 42,126 | 18.9 | 8.9 | 10.0 | 2.58 |
| 1950 | 4,271,000 | 79,558 | 39,300 | 40,258 | 18.6 | 9.2 | 9.4 | 2.57 |
| 1951 | 4,304,000 | 76,559 | 37,960 | 38,599 | 17.8 | 8.8 | 9.0 | 2.50 |
| 1952 | 4,334,000 | 76,943 | 39,173 | 37,770 | 17.8 | 9.0 | 8.7 | 2.53 |
| 1953 | 4,369,000 | 78,261 | 39,350 | 38,911 | 17.9 | 9.0 | 8.9 | 2.60 |
| 1954 | 4,406,000 | 76,365 | 39,885 | 36,480 | 17.3 | 9.1 | 8.3 | 2.55 |
| 1955 | 4,439,000 | 76,845 | 38,789 | 38,056 | 17.3 | 8.7 | 8.6 | 2.58 |
| 1956 | 4,466,000 | 76,725 | 39,588 | 37,137 | 17.2 | 8.9 | 8.3 | 2.61 |
| 1957 | 4,488,000 | 75,264 | 41,730 | 33,534 | 16.8 | 9.3 | 7.5 | 2.57 |
| 1958 | 4,515,000 | 74,681 | 41,560 | 33,121 | 16.5 | 9.2 | 7.3 | 2.55 |
| 1959 | 4,547,000 | 73,928 | 42,159 | 31,769 | 16.3 | 9.3 | 7.0 | 2.52 |
| 1960 | 4,581,000 | 76,077 | 43,681 | 32,396 | 16.6 | 9.5 | 7.1 | 2.57 |
| 1961 | 4,610,000 | 76,439 | 43,310 | 33,129 | 16.6 | 9.4 | 7.2 | 2.55 |
| 1962 | 4,647,000 | 77,808 | 45,334 | 32,474 | 16.7 | 9.8 | 7.0 | 2.58 |
| 1963 | 4,684,000 | 82,413 | 45,773 | 36,640 | 17.6 | 9.8 | 7.8 | 2.64 |
| 1964 | 4,720,000 | 83,356 | 46,811 | 36,545 | 17.7 | 9.9 | 7.7 | 2.60 |
| 1965 | 4,758,000 | 85,796 | 47,884 | 37,912 | 18.0 | 10.1 | 8.0 | 2.61 |
| 1966 | 4,795,000 | 88,332 | 49,344 | 38,988 | 18.4 | 10.3 | 8.1 | 2.62 |
| 1967 | 4,836,000 | 81,410 | 47,836 | 33,574 | 16.8 | 9.9 | 6.9 | 2.35 |
| 1968 | 4,865,000 | 74,543 | 47,290 | 27,253 | 15.3 | 9.7 | 5.6 | 2.12 |
| 1969 | 4,891,000 | 71,298 | 47,943 | 23,355 | 14.6 | 9.8 | 4.8 | 2.00 |
| 1970 | 4,951,000 | 70,802 | 48,233 | 22,569 | 14.3 | 9.7 | 4.6 | 1.95 |
| 1971 | 4,963,000 | 75,359 | 48,858 | 26,501 | 15.2 | 9.8 | 5.3 | 2.04 |
| 1972 | 4,992,000 | 75,505 | 50,445 | 25,060 | 15.1 | 10.1 | 5.0 | 2.03 |
| 1973 | 5,022,000 | 71,895 | 50,526 | 21,369 | 14.3 | 10.1 | 4.3 | 1.92 |
| 1974 | 5,045,000 | 71,327 | 51,637 | 19,690 | 14.1 | 10.2 | 3.9 | 1.90 |
| 1975 | 5,060,000 | 72,071 | 50,895 | 21,176 | 14.2 | 10.1 | 4.1 | 1.92 |
| 1976 | 5,073,000 | 65,267 | 54,001 | 11,266 | 12.9 | 10.6 | 2.2 | 1.75 |
| 1977 | 5,088,000 | 61,878 | 50,485 | 11,393 | 12.2 | 9.9 | 2.2 | 1.66 |
| 1978 | 5,104,000 | 62,036 | 52,864 | 9,172 | 12.2 | 10.4 | 1.8 | 1.67 |
| 1979 | 5,117,000 | 59,464 | 54,654 | 4,810 | 11.6 | 10.7 | 0.9 | 1.60 |
| 1980 | 5,123,000 | 57,293 | 55,939 | 1,354 | 11.2 | 10.9 | 0.3 | 1.55 |
| 1981 | 5,122,000 | 53,089 | 56,359 | -3,270 | 10.4 | 11.0 | -0.6 | 1.44 |
| 1982 | 5,118,000 | 52,658 | 55,368 | -2,710 | 10.3 | 10.8 | -0.5 | 1.43 |
| 1983 | 5,114,000 | 50,822 | 57,156 | -6,334 | 9.9 | 11.2 | -1.2 | 1.38 |
| 1984 | 5,112,000 | 51,800 | 57,109 | -5,309 | 10.1 | 11.2 | -1.0 | 1.40 |
| 1985 | 5,114,000 | 53,749 | 58,378 | -4,629 | 10.5 | 11.4 | -0.9 | 1.45 |
| 1986 | 5,121,000 | 55,312 | 58,100 | -2,788 | 10.8 | 11.3 | -0.5 | 1.48 |
| 1987 | 5,127,000 | 56,221 | 58,136 | -1,915 | 11.0 | 11.3 | -0.4 | 1.51 |
| 1988 | 5,130,000 | 58,844 | 58,984 | -127 | 11.5 | 11.5 | -0.0 | 1.56 |
| 1989 | 5,133,000 | 61,351 | 59,397 | 2,047 | 12.0 | 11.6 | 0.4 | 1.62 |
| 1990 | 5,140,000 | 63,433 | 60,926 | 2,545 | 12.3 | 11.9 | 0.5 | 1.67 |
| 1991 | 5,154,000 | 64,358 | 59,581 | 4,777 | 12.5 | 11.6 | 0.9 | 1.68 |
| 1992 | 5,170,000 | 67,726 | 60,821 | 6,905 | 13.1 | 11.8 | 1.3 | 1.76 |
| 1993 | 5,189,000 | 67,369 | 62,809 | 4,560 | 13.0 | 12.1 | 0.9 | 1.75 |
| 1994 | 5,205,000 | 69,666 | 61,099 | 8,567 | 13.4 | 11.7 | 1.6 | 1.81 |
| 1995 | 5,228,000 | 69,771 | 63,127 | 6,644 | 13.3 | 12.1 | 1.3 | 1.81 |
| 1996 | 5,262,000 | 67,638 | 61,043 | 6,595 | 12.9 | 11.6 | 1.3 | 1.75 |
| 1997 | 5,284,000 | 67,648 | 59,898 | 7,750 | 12.8 | 11.3 | 1.5 | 1.75 |
| 1998 | 5,301,000 | 66,174 | 58,453 | 7,721 | 12.5 | 11.0 | 1.5 | 1.72 |
| 1999 | 5,322,000 | 66,220 | 59,179 | 7,041 | 12.4 | 11.1 | 1.3 | 1.73 |
| 2000 | 5,340,000 | 67,084 | 57,998 | 9,086 | 12.6 | 10.9 | 1.7 | 1.77 |
| 2001 | 5,359,000 | 65,458 | 58,355 | 7,103 | 12.2 | 10.9 | 1.3 | 1.74 |
| 2002 | 5,375,000 | 64,075 | 58,610 | 5,465 | 11.9 | 10.9 | 1.0 | 1.72 |
| 2003 | 5,391,000 | 64,599 | 57,574 | 7,025 | 12.0 | 10.7 | 1.3 | 1.76 |
| 2004 | 5,405,000 | 64,609 | 55,086 | 9,523 | 12.0 | 10.2 | 1.8 | 1.78 |
| 2005 | 5,419,000 | 64,282 | 54,962 | 9,320 | 11.9 | 10.1 | 1.7 | 1.80 |
| 2006 | 5,437,000 | 64,984 | 55,477 | 9,507 | 12.0 | 10.2 | 1.7 | 1.85 |
| 2007 | 5,461,000 | 64,082 | 55,604 | 8,478 | 11.7 | 10.2 | 1.6 | 1.84 |
| 2008 | 5,494,000 | 65,038 | 54,591 | 10,447 | 11.8 | 9.9 | 1.9 | 1.89 |
| 2009 | 5,523,000 | 62,818 | 54,872 | 7,946 | 11.4 | 9.9 | 1.4 | 1.84 |
| 2010 | 5,548,000 | 63,411 | 54,368 | 9,043 | 11.4 | 9.8 | 1.6 | 1.87 |
| 2011 | 5,571,000 | 58,998 | 52,516 | 6,482 | 10.6 | 9.4 | 1.2 | 1.75 |
| 2012 | 5,591,000 | 57,916 | 52,325 | 5,591 | 10.4 | 9.4 | 1.0 | 1.73 |
| 2013 | 5,614,000 | 55,844 | 52,428 | 3,416 | 9.9 | 9.3 | 0.6 | 1.67 |
| 2014 | 5,659,000 | 56,870 | 51,340 | 5,530 | 10.1 | 9.1 | 1.0 | 1.69 |
| 2015 | 5,707,000 | 58,205 | 52,555 | 5,650 | 10.2 | 9.2 | 1.0 | 1.71 |
| 2016 | 5,749,000 | 61,614 | 52,824 | 8,790 | 10.7 | 9.2 | 1.5 | 1.79 |
| 2017 | 5,781,000 | 61,272 | 53,261 | 8,011 | 10.6 | 9.2 | 1.4 | 1.75 |
| 2018 | 5,806,000 | 61,476 | 55,232 | 6,244 | 10.6 | 9.5 | 1.1 | 1.73 |
| 2019 | 5,823,000 | 61,167 | 53,958 | 7,209 | 10.5 | 9.3 | 1.2 | 1.70 |
Note. Population as of 31 December.
Current natural increase
- Number of births from January–June 2019 =

- Number of births from January–June 2020 =

- Number of deaths from January–June 2019 =

- Number of deaths from January–June 2020 =
- Natural growth from January–June 2019 =
- Natural growth from January–June 2020 =
Life expectancy from 1775 to 2015
Sources: Our World In Data and the United Nations.
1775-1950
| Years | 1775 | 1835 | 1836 | 1837 | 1838 | 1839 | 1840 | 1841 | 1842 | 1843 | 1844 | 1845 | 1846 | 1847 | 1848 | 1849 | 1850[15] |
|---|---|---|---|---|---|---|---|---|---|---|---|---|---|---|---|---|---|
| Life expectancy in Denmark | 33.0 | 38.4 | 40.0 | 41.5 | 43.1 | 41.9 | 41.1 | 42.6 | 42.5 | 43.9 | 44.0 | 43.4 | 40.4 | 40.4 | 40.8 | 39.5 | 43.5 |
| Years | 1851 | 1852 | 1853 | 1854 | 1855 | 1856 | 1857 | 1858 | 1859 | 1860[15] |
|---|---|---|---|---|---|---|---|---|---|---|
| Life expectancy in Denmark | 44.5 | 43.0 | 38.5 | 44.7 | 46.1 | 46.7 | 42.5 | 40.0 | 44.4 | 45.1 |
| Years | 1861 | 1862 | 1863 | 1864 | 1865 | 1866 | 1867 | 1868 | 1869 | 1870[15] |
|---|---|---|---|---|---|---|---|---|---|---|
| Life expectancy in Denmark | 47.6 | 47.6 | 47.2 | 40.2 | 39.8 | 42.9 | 44.9 | 45.6 | 46.1 | 46.0 |
| Years | 1871 | 1872 | 1873 | 1874 | 1875 | 1876 | 1877 | 1878 | 1879 | 1880[15] |
|---|---|---|---|---|---|---|---|---|---|---|
| Life expectancy in Denmark | 46.1 | 47.2 | 47.5 | 46.0 | 44.4 | 45.8 | 47.3 | 47.5 | 46.2 | 44.8 |
| Years | 1881 | 1882 | 1883 | 1884 | 1885 | 1886 | 1887 | 1888 | 1889 | 1890[15] |
|---|---|---|---|---|---|---|---|---|---|---|
| Life expectancy in Denmark | 48.3 | 46.7 | 48.5 | 48.5 | 49.6 | 49.0 | 48.7 | 46.7 | 47.8 | 47.2 |
| Years | 1891 | 1892 | 1893 | 1894 | 1895 | 1896 | 1897 | 1898 | 1899 | 1900[15] |
|---|---|---|---|---|---|---|---|---|---|---|
| Life expectancy in Denmark | 46.8 | 47.4 | 47.1 | 49.4 | 50.8 | 52.9 | 51.8 | 53.1 | 50.6 | 51.9 |
| Years | 1901 | 1902 | 1903 | 1904 | 1905 | 1906 | 1907 | 1908 | 1909 | 1910[15] |
|---|---|---|---|---|---|---|---|---|---|---|
| Life expectancy in Denmark | 52.6 | 54.7 | 54.8 | 55.7 | 54.3 | 56.5 | 56.1 | 54.9 | 57.4 | 58.0 |
| Years | 1911 | 1912 | 1913 | 1914 | 1915 | 1916 | 1917 | 1918 | 1919 | 1920[15] |
|---|---|---|---|---|---|---|---|---|---|---|
| Life expectancy in Denmark | 57.0 | 58.0 | 58.9 | 58.5 | 58.4 | 56.9 | 57.3 | 56.3 | 57.0 | 57.6 |
| Years | 1921 | 1922 | 1923 | 1924 | 1925 | 1926 | 1927 | 1928 | 1929 | 1930[15] |
|---|---|---|---|---|---|---|---|---|---|---|
| Life expectancy in Denmark | 61.7 | 60.6 | 61.2 | 61.1 | 61.9 | 61.7 | 61.2 | 61.9 | 61.9 | 62.3 |
| Years | 1931 | 1932 | 1933 | 1934 | 1935 | 1936 | 1937 | 1938 | 1939 | 1940[15] |
|---|---|---|---|---|---|---|---|---|---|---|
| Life expectancy in Denmark | 61.8 | 62.7 | 63.6 | 64.1 | 62.9 | 63.5 | 64.0 | 65.0 | 65.8 | 66.3 |
| Years | 1941 | 1942 | 1943 | 1944 | 1945 | 1946 | 1947 | 1948 | 1949 | 1950[15] |
|---|---|---|---|---|---|---|---|---|---|---|
| Life expectancy in Denmark | 66.0 | 67.1 | 67.4 | 66.4 | 66.1 | 67.2 | 68.5 | 70.1 | 70.1 | 70.3 |
1950-2015
| Period | Life expectancy in Years |
Period | Life expectancy in Years |
|---|---|---|---|
| 1950–1955 | 71.1 | 1985–1990 | 74.8 |
| 1955–1960 | 72.1 | 1990–1995 | 75.2 |
| 1960–1965 | 72.4 | 1995–2000 | 76.1 |
| 1965–1970 | 72.9 | 2000–2005 | 77.3 |
| 1970–1975 | 73.6 | 2005–2010 | 78.6 |
| 1975–1980 | 74.2 | 2010–2015 | 80.2 |
| 1980–1985 | 74.4 |
Source: UN World Population Prospects[16]
Religion
The Church of Denmark (Den danske folkekirke) is state-supported and, according to statistics from January 2019, accounts for about 74.7% of Denmark's religious affiliation. Denmark has had religious freedom guaranteed since 1849 by the Constitution,[17] and numerous other religions are officially recognised,[18] including several Christian denominations, Muslim, Jewish, Buddhist, Hindu and other congregations as well as Forn Siðr, a revival of Scandinavian pagan tradition.[18] The Department of Ecclesiastical Affairs recognises roughly a hundred religious congregations for tax and legal purposes such as conducting wedding ceremonies.
Islam is the second largest religion in Denmark.
For historical reasons, there is a formal distinction between 'approved' (godkendte) and 'recognised' (anerkendte) congregations of faith.[18] The latter include 11 traditional denominations, such as Roman Catholics, the Reformed Church, the Mosaic Congregation, Methodists and Baptists, some of whose privileges in the country date hundreds of years back. These have the additional rights of having priests appointed by royal resolution and to christen/name children with legal effect.
Demographic statistics
Population
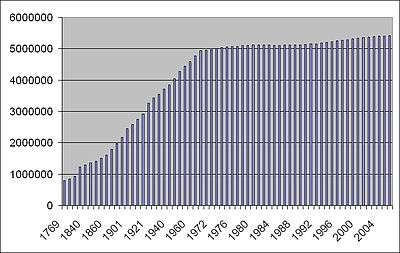
Denmark's population from 1769 to 2007.
| Year | Population | Year | Population |
|---|---|---|---|
| 1769 | 797,584 | 1976 | 5,065,313 |
| 1787 | 841,806 | 1977 | 5,079,879 |
| 1801 | 929,001 | 1978 | 5,096,959 |
| 1834 | 1,230,964 | 1979 | 5,111,537 |
| 1840 | 1,289,075 | 1980 | 5,122,065 |
| 1845 | 1,356,877 | 1981 | 5,123,989 |
| 1850 | 1,414,648 | 1982 | 5,119,155 |
| 1855 | 1,507,222 | 1983 | 5,116,464 |
| 1860 | 1,608,362 | 1984 | 5,112,130 |
| 1870 | 1,784,741 | 1985 | 5,111,108 |
| 1880 | 1,969,039 | 1986 | 5,116,273 |
| 1890 | 2,172,380 | 1987 | 5,124,794 |
| 1901 | 2,449,540 | 1988 | 5,129,254 |
| 1906 | 2,588,919 | 1989 | 5,129,778 |
| 1911 | 2,757,076 | 1990 | 5,135,409 |
| 1916 | 2,921,362 | 1991 | 5,146,469 |
| 1921 | 3,267,831 | 1992 | 5,162,126 |
| 1925 | 3,434,555 | 1993 | 5,180,614 |
| 1930 | 3,550,656 | 1994 | 5,196,642 |
| 1935 | 3,706,349 | 1995 | 5,215,718 |
| 1940 | 3,844,312 | 1996 | 5,251,027 |
| 1945 | 4,045,232 | 1997 | 5,275,121 |
| 1950 | 4,281,275 | 1998 | 5,294,860 |
| 1955 | 4,448,401 | 1999 | 5,313,577 |
| 1960 | 4,585,256 | 2000 | 5,330,020 |
| 1965 | 4,767,597 | 2001 | 5,349,212 |
| 1970 | 4,937,579 | 2002 | 5,368,354 |
| 1971 | 4,950,598 | 2003 | 5,383,507 |
| 1972 | 4,975,653 | 2004 | 5,397,640 |
| 1973 | 5,007,538 | 2005 | 5,411,405 |
| 1974 | 5,036,184 | 2006 | 5,427,459 |
| 1975 | 5,054,410 | 2007 | 5,447,084 |
- Source Statistics Denmark, "Folketal efter hovedlandsdele (summariske tal fra folketællinger)" (table FT)[19]
- To curb population decline, Denmark began subidizing the Do it for Denmark advertising campaign in 2014.
Demographic statistics according to the World Population Review in 2019.[20]
- One birth every 8 minutes
- One death every 9 minutes
- One net migrant every 34 minutes
- Net gain of one person every 24 minutes
Demographic statistics according to the CIA World Factbook, unless otherwise indicated.[21]
- Population
- 5,809,502 (July 2018 est.)
- Age structure
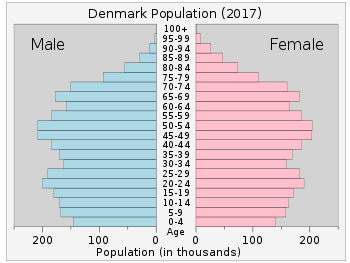
- 0-14 years: 16.57% (male 493,829 /female 468,548)
- 15-24 years: 12.67% (male 377,094 /female 358,807)
- 25-54 years: 39.03% (male 1,147,196 /female 1,119,967)
- 55-64 years: 12.33% (male 356,860 /female 359,264)
- 65 years and over: 19.42% (male 518,200 /female 609,737) (2018 est.)
- Median age
- total: 41.9 years. Country comparison to the world: 35th
- male: 40.8 years
- female: 42.9 years (2018 est.)
- Birth rate
- 10.9 births/1,000 population (2018 est.) Country comparison to the world: 178th
- Death rate
- 9.3 deaths/1,000 population (2018 est.) Country comparison to the world: 55th
- Total fertility rate
- 1.78 children born/woman (2018 est.) Country comparison to the world: 152nd
- Mother's mean age at first birth
- 29.1 years (2015 est.)
- Population growth rate
- 0.59% (2018 est.) Country comparison to the world: 148th
- Net migration rate
- 2.1 migrant(s)/1,000 population (2017 est.) Country comparison to the world: 46th
- Life expectancy at birth
- total population: 81 years (2018 est.) Country comparison to the world: 34th
- male: 79.1 years (2018 est.)
- female: 83.1 years (2018 est.)
- Ethnic groups
- Danish (includes Greenlandic (who are predominantly Inuit) and Faroese) 86.3%, Turkish 1.1%, other 12.6% (largest groups are Polish, Syrian, German, Iraqi, and Romanian) (2018 est.)
note: data represent population by ancestry
- Religions
- Evangelical Lutheran (official) 74.8%, Muslim 5.3%, other (denominations of less than 1% each, include Roman Catholic, Jehovah's Witness, Serbian Orthodox Christian, Jewish, Baptist, and Buddhist) 19.9% (2017 est.)
- Dependency ratios
- total dependency ratio: 56 (2015 est.)
- youth dependency ratio: 26.3 (2015 est.)
- elderly dependency ratio: 29.7 (2015 est.)
- potential support ratio: 3.4 (2015 est.)
- Urbanization
- urban population: 87.9% of total population (2018)
- rate of urbanization: 0.51% annual rate of change (2015-20 est.)
- Major urban areas - population
- 1.321 million COPENHAGEN (capital) (2018)
- Sex ratio
- at birth: 1.05 male(s)/female (2017 est.)
- 0-14 years: 1.05 male(s)/female (2017 est.)
- 15-24 years: 1.04 male(s)/female (2017 est.)
- 25-54 years: 0.99 male(s)/female (2017 est.)
- 55-64 years: 0.99 male(s)/female (2017 est.)
- 65 years and over: 0.81 male(s)/female (2017 est.)
- total population: 0.97 male(s)/female (2017 est.)
- School life expectancy (primary to tertiary education)
- total: 19 years (2014)
- male: 18 years (2014)
- female: 20 years (2014)
- Unemployment, youth ages 15–24
- total: 12% (2016 est.) Country comparison to the world: 109th
- male: 13.1% (2016 est.)
- female: 10.9% (2016 est.)
See also
Notes
- In fertility rates, 2.1 and above is a stable population and have been marked blue, 2 and below leads to an aging population and a reducing population.
References
- Parallelsamfund i Danmark / Økonomisk Analyse nr. 30. Ministry for economic affairs and the interior. February 2018. p. 3. Archived from the original (PDF) on 26 February 2018. Retrieved 14 July 2018.
- "IMMIGRANTS AND THEIR DESCENDANTS". Dst.dk. Retrieved 11 September 2017.
- "Population and population projections". Statistics Denmark. Archived from the original on 30 October 2018. Retrieved 10 August 2019.
- "Willkommen bei der deutschen Minderheit in Dänemark". Nordschleswig.dk. Archived from the original on 26 March 2013. Retrieved 29 August 2017.
- "Archived copy". Archived from the original on 19 July 2011. Retrieved 18 January 2010.CS1 maint: archived copy as title (link)
- "Archived copy". Archived from the original on 19 July 2011. Retrieved 18 January 2010.CS1 maint: archived copy as title (link)
- "Forside - Mosaiske". Mosaiske.dk. Retrieved 29 August 2017.
- Immigrants, Descentants and Children of Descentants
- "Immigrants and Descendants, 1 January 2020". Statistics Denmark.
- Max Roser (2014), "Total Fertility Rate around the world over the last centuries", Our World In Data, Gapminder Foundation, archived from the original on 2019-01-19, retrieved 2019-01-18
- "Statistikbanken". Statistikbanken.dk. Retrieved 29 August 2017.
- "Population and Elections". StatBank Denmark. Statistics of Denmark. Retrieved 8 November 2019.
- "Life expectancy". Our World in Data. Retrieved 2018-08-28.
- "World Population Prospects – Population Division – United Nations". Archived from the original on 2016-09-19. Retrieved 2017-07-15.
- "Denmark – Constitution : Part VII – Section 70". Servat.unibe.ch. Retrieved 29 August 2017.
No person shall for reasons of his creed or descent be deprived of access to complete enjoyment of his civic and political rights, nor shall he for such reasons evade compliance with any common civic duty.
- Freedom of religion and religious communities in Denmark Archived 2012-02-05 at the Wayback Machine – The Ministry of Ecclesiastical Affairs – May 2006. Km.dk
- "Statistikbanken". Statistikbanken.dk. Archived from the original on 8 September 2017. Retrieved 29 August 2017.
- "Denmark Population 2019", World Population Review
- "World Factbook EUROPE : DENMARK", The World Factbook, July 12, 2018
![]()
External links
| Wikimedia Commons has media related to Demographics of Denmark. |
- Danish Demes Regional DNA Project
- National statistics
- Ministry of Ecclesiastical Affairs - List of recognised denominations (in Danish)
- Statistic info on recognised denominations (in Danish; Muslim congregations not listed)
Part of the Kingdom of Denmark | |||||||
| History |  | ||||||
| Geography | |||||||
| Politics |
| ||||||
| Economy |
| ||||||
| Society |
| ||||||