Deaf Smith County, Texas
Deaf Smith County is a county located in the U.S. state of Texas. As of the 2010 census, the population was 19,372.[1] The county seat is Hereford,[2] which is known as the "Beef Capital of the World". The county was created in 1876 and later organized in 1890.[3]
Deaf Smith County | |
|---|---|
 Deaf Smith County Courthouse in Hereford | |
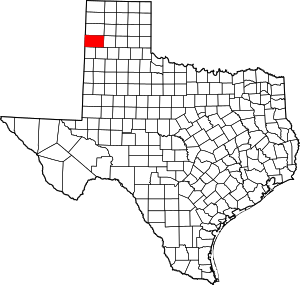 Location within the U.S. state of Texas | |
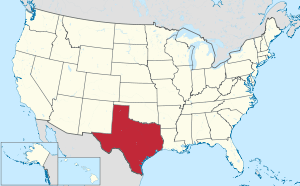 Texas's location within the U.S. | |
| Coordinates: 34°58′N 102°36′W | |
| Country | |
| State | |
| Founded | 1890 |
| Named for | Deaf Smith |
| Seat | Hereford |
| Largest city | Hereford |
| Area | |
| • Total | 1,498 sq mi (3,880 km2) |
| • Land | 1,497 sq mi (3,880 km2) |
| • Water | 1.5 sq mi (4 km2) 0.1%% |
| Population (2010) | |
| • Total | 19,372 |
| • Density | 13/sq mi (5/km2) |
| Time zone | UTC−6 (Central) |
| • Summer (DST) | UTC−5 (CDT) |
| Congressional district | 13th |
| Website | www |
The Hereford, TX Micropolitan Statistical Area includes all of Deaf Smith County.
History
In 1876, the state legislature defined and named the county, but it was not organized until 1890, with the town of La Plata as the original county seat. The county was named for Erastus "Deaf" Smith[4] (1787–1837), a partially deaf scout and soldier who served in the Texas Revolution and was the first to reach the Alamo after its fall. The pronunciation of "Deaf", like that of Smith himself, is /diːf/ DEEF; however, most residents pronounce it /dɛf/ DEF.
This county was also selected as an alternate site for a possible nuclear waste disposal repository, but was later dropped. Jesse Frank Ford, founder of Arrowhead Mills, led the opposition to the Deaf Smith site on grounds of contamination of the Ogallala Aquifer, the source of much of the water supply for West Texas.
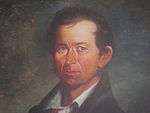 Erastus "Deaf" Smith as he appears at the Deaf Smith County Museum
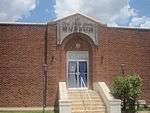 The Deaf Smith County Historical Museum in Hereford
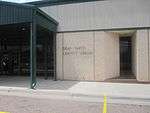 The Deaf Smith County Library formerly housed the National Cowgirl Hall of Fame on the ground floor. The museum is now located in a new building in the Historic District of Fort Worth.
Geography
According to the U.S. Census Bureau, the county has a total area of 1,498 square miles (3,880 km2), of which 1,497 square miles (3,880 km2) is land and 1.5 square miles (3.9 km2) (0.1%) is covered by water.[5]
Major highways
.svg.png)


Adjacent counties
- Oldham County (north)
- Randall County (east)
- Castro County (southeast)
- Parmer County (south)
- Curry County, New Mexico (southwest/Mountain Time Zone)
- Quay County, New Mexico (west/Mountain Time Zone)
Demographics
| Historical population | |||
|---|---|---|---|
| Census | Pop. | %± | |
| 1880 | 38 | — | |
| 1890 | 179 | 371.1% | |
| 1900 | 843 | 370.9% | |
| 1910 | 3,942 | 367.6% | |
| 1920 | 3,747 | −4.9% | |
| 1930 | 5,979 | 59.6% | |
| 1940 | 6,056 | 1.3% | |
| 1950 | 9,111 | 50.4% | |
| 1960 | 13,187 | 44.7% | |
| 1970 | 18,999 | 44.1% | |
| 1980 | 21,165 | 11.4% | |
| 1990 | 19,153 | −9.5% | |
| 2000 | 18,561 | −3.1% | |
| 2010 | 19,372 | 4.4% | |
| Est. 2019 | 18,546 | [6] | −4.3% |
| U.S. Decennial Census[7] 1850–2010[8] 2010–2014[1] | |||
As of the census[9] of 2000, 18,561 people, 6,180 households, and 4,832 families resided in the county. The population density was 12 people per square mile (5/km²). The 6,914 housing units averaged 5 per square mile (2/km²). The racial makeup of the county was 72.28% White, 1.51% Black or African American, 0.80% Native American, 0.25% Asian, 0.13% Pacific Islander, 22.92% from other races, and 2.11% from two or more races. About 57.40% of the population was Hispanic or Latino of any race.
Of the 6,180 households, 41.00% had children under the age of 18 living with them, 61.00% were married couples living together, 12.60% had a female householder with no husband present, and 21.80% were not families. Around 19.70% of all households was made up of individuals and 10.00% had someone living alone who was 65 years of age or older. The average household size was 2.96 and the average family size was 3.41.
In the county, the population was distributed as 33.30% under the age of 18, 9.60% from 18 to 24, 25.50% from 25 to 44, 19.40% from 45 to 64, and 12.10% who were 65 years of age or older. The median age was 31 years. For every 100 females, there were 95.50 males. For every 100 females age 18 and over, there were 91.90 males.
The median income for a household was $29,601, and for a family was $32,391. Males had a median income of $26,090 versus $19,113 for females. The per capita income for the county was $13,119. About 19.30% of families and 20.60% of the population were below the poverty line, including 26.30% of those under age 18 and 15.70% of those age 65 or over.
Infrastructure
The headquarters of the Deaf Smith Electric Cooperative are located in Hereford. The cooperative provides electricity for Deaf Smith County, as well as Castro, Parmer and Oldham Counties.[10]
Communities
City
- Hereford (county seat)
Unincorporated communities
- Dawn
- Glenrio (partly in Quay County, New Mexico)
Politics
| Year | Republican | Democratic | Third parties |
|---|---|---|---|
| 2016 | 69.1% 2,911 | 28.1% 1,185 | 2.8% 120 |
| 2012 | 70.6% 3,042 | 28.8% 1,239 | 0.7% 28 |
| 2008 | 73.1% 3,466 | 26.3% 1,247 | 0.7% 31 |
| 2004 | 78.2% 4,139 | 21.4% 1,133 | 0.4% 19 |
| 2000 | 74.0% 3,687 | 24.9% 1,240 | 1.1% 57 |
| 1996 | 60.4% 3,051 | 32.8% 1,655 | 6.8% 342 |
| 1992 | 56.4% 3,137 | 29.5% 1,642 | 14.0% 780 |
| 1988 | 65.4% 3,744 | 33.7% 1,930 | 0.9% 52 |
| 1984 | 75.8% 4,762 | 23.6% 1,485 | 0.6% 36 |
| 1980 | 69.5% 4,073 | 28.4% 1,666 | 2.1% 125 |
| 1976 | 51.1% 2,776 | 48.1% 2,613 | 0.9% 46 |
| 1972 | 73.7% 3,690 | 24.8% 1,240 | 1.6% 79 |
| 1968 | 52.5% 2,474 | 32.8% 1,545 | 14.7% 694 |
| 1964 | 46.0% 1,793 | 53.7% 2,094 | 0.3% 10 |
| 1960 | 60.4% 2,024 | 38.8% 1,299 | 0.8% 26 |
| 1956 | 55.2% 1,685 | 44.6% 1,361 | 0.3% 9 |
| 1952 | 70.9% 2,468 | 28.9% 1,006 | 0.3% 9 |
| 1948 | 25.6% 535 | 71.6% 1,496 | 2.8% 58 |
| 1944 | 28.1% 508 | 61.9% 1,117 | 10.0% 180 |
| 1940 | 25.7% 423 | 74.0% 1,219 | 0.3% 5 |
| 1936 | 10.2% 142 | 89.1% 1,236 | 0.7% 9 |
| 1932 | 13.2% 198 | 86.8% 1,307 | |
| 1928 | 58.1% 570 | 41.9% 411 | |
| 1924 | 25.2% 192 | 70.5% 538 | 4.3% 33 |
| 1920 | 30.8% 205 | 68.9% 459 | 0.3% 2 |
| 1916 | 17.0% 77 | 78.8% 356 | 4.2% 19 |
| 1912 | 7.8% 21 | 82.2% 221 | 10.0% 27 |
See also
References
- "State & County QuickFacts". United States Census Bureau. Archived from the original on April 24, 2011. Retrieved December 10, 2013.
- "Find a County". National Association of Counties. Archived from the original on 2011-05-31. Retrieved 2011-06-07.
- "Texas: Individual County Chronologies". Texas Atlas of Historical County Boundaries. The Newberry Library. 2008. Retrieved May 21, 2015.
- Gannett, Henry (1905). The Origin of Certain Place Names in the United States. Govt. Print. Off. pp. 102.
- "2010 Census Gazetteer Files". United States Census Bureau. August 22, 2012. Retrieved April 22, 2015.
- "Population and Housing Unit Estimates". United States Census Bureau. May 24, 2020. Retrieved May 27, 2020.
- "U.S. Decennial Census". United States Census Bureau. Retrieved April 22, 2015.
- "Texas Almanac: Population History of Counties from 1850–2010" (PDF). Texas Almanac. Retrieved April 22, 2015.
- "U.S. Census website". United States Census Bureau. Retrieved 2011-05-14.
- Spotlight on CRC Member: Deaf Smith Electric Cooperative. Cooperative Response Center.
- Leip, David. "Dave Leip's Atlas of U.S. Presidential Elections". uselectionatlas.org. Retrieved 2018-07-21.
External links
- Deaf Smith County government website
- A History of Deaf Smith County, featuring Pioneer Families, published 1964 by Bessie Smith, hosted by the Portal to Texas History
- The Land and Its People, 1876-1981: Deaf Smith County Texas, published 1982 by the Deaf Smith County Historical society, hosted by the Portal to Texas History
- Historic photographs from the Deaf Smith County Library hosted by the Portal to Texas History
- Deaf Smith County in Handbook of Texas Online at the University of Texas
- Deaf Smith County Profile from the Texas Association of Counties
Places adjacent to Deaf Smith County, Texas | ||||||||||
|---|---|---|---|---|---|---|---|---|---|---|
| ||||||||||
Municipalities and communities of Deaf Smith County, Texas, United States | ||
|---|---|---|
| City | Deaf Smith County map | |
| Unincorporated communities | ||
| Ghost towns | ||
| Footnotes | ‡This populated place also extends into New Mexico | |
| Authority control |
|
|---|