Crime in the United States
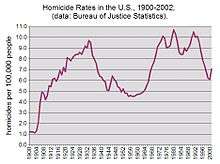
Crime in the United States has been recorded since colonization. Crime rates have varied over time, with a sharp rise after 1900, reaching a broad bulging peak between the 1970s and early 1990s. Since then, crime has declined significantly.[1]
| United States | |
|---|---|
| Crime rates* (2017) | |
| Violent crimes | |
| Homicide | 5.3 |
| Rape | 41.7 |
| Robbery | 98.0 |
| Aggravated assault | 248.9 |
| Total violent crime | 382.9 |
| Property crimes | |
| Burglary | 430.4 |
| Larceny-theft | 1,694.4 |
| Motor vehicle theft | 237.4 |
| Total property crime | 2,362.2 |
Notes *Number of reported crimes per 100,000 population. Estimated total population: 325,719,178. In 2013 the FBI modified the definition of rape. Source: Crime in the United States by Volume and Rate per 100,000 Inhabitants, 1998–2017 (Table 1) | |

Statistics on specific crimes are indexed in the annual Uniform Crime Reports by the Federal Bureau of Investigation (FBI) and by annual National Crime Victimization Surveys by the Bureau of Justice Statistics.[2] In addition to the primary Uniform Crime Report known as Crime in the United States, the FBI publishes annual reports on the status of law enforcement in the United States.[3] The report's definitions of specific crimes are considered standard by many American law enforcement agencies.[4] According to the FBI, index crime in the United States includes violent crime and property crime.[5] Violent crime consists of five criminal offenses: murder and non-negligent manslaughter, rape, robbery, aggravated assault, and gang violence; property crime consists of burglary, larceny, motor vehicle theft, and arson.[5]
Crime over time
In the long term, violent crime in the United States has been in decline since colonial times. The homicide rate has been estimated to be over 30 per 100,000 people in 1700, dropping to under 20 by 1800, and to under 10 by 1900.[6]
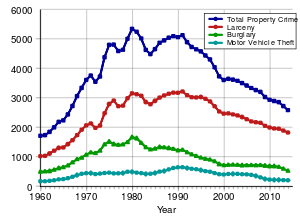
After World War II, crime rates increased in the United States, peaking from the 1970s to the early-1990s. Violent crime nearly quadrupled between 1960 and its peak in 1991. Property crime more than doubled over the same period. Since the 1990s, however, contrary to common misconception,[7] crime in the United States has declined steadily. Several theories have been proposed to explain this decline:
- The number of police officers increased considerably in the 1990s.[8]
- On September 16, 1994, President Bill Clinton signed the Violent Crime Control and Law Enforcement Act into law. Under the act, over $30 billion in federal aid was spent over a six-year period to improve state and local law enforcement, prisons and crime prevention programs.[9] Proponents of the law, including the President, touted it as a lead contributor to the sharp drop in crime which occurred throughout the 1990s,[9] while critics have dismissed it as an unprecedented federal boondoggle.[9]
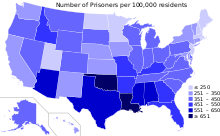
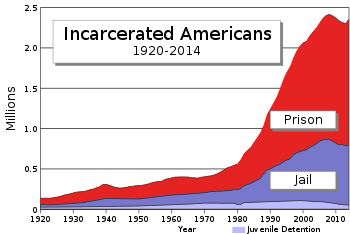 Total incarceration in the United States by year
 - The prison population has rapidly increased since the mid-1970s.[8]
- Starting in the mid-1980s, the crack-cocaine market grew rapidly before declining again a decade later. Some authors have pointed towards the link between violent crimes and crack use.[8]
- Legalized abortion reduced the number of children born to mothers in difficult circumstances, and difficult childhood makes children more likely to become criminals.[10]
- The changing demographics of an aging population has been cited for the drop in overall crime.[11]
- Rising income[12]
- The introduction of the data-driven policing practice CompStat significantly reduced crimes in cities that adopted it.[12]
- The lead-crime hypothesis suggests reduced lead exposure as the cause; Scholar Mark A.R. Kleiman writes: "Given the decrease in lead exposure among children since the 1980s and the estimated effects of lead on crime, reduced lead exposure could easily explain a very large proportion—certainly more than half—of the crime decrease of the 1994–2004 period. A careful statistical study relating local changes in lead exposure to local crime rates estimates the fraction of the crime decline due to lead reduction as greater than 90 percent.[13]
- The quality and extent of use of security technology both increased around the time of the crime decline, after which the rate of car theft declined; this may have caused rates of other crimes to decline as well.[14]
- Increased rates of immigration to the United States[15][16]
Violent crime rates (per 100,000) in the United States (1960-2016):[17][18]
| Year | Violent crime | Murder and non-negligent manslaughter | Rape | Robbery | Aggravated assault |
|---|---|---|---|---|---|
| 1960 | 160.9 | 5.1 | 9.6 | 60.1 | 86.1 |
| 1961 | 158.1 | 4.8 | 9.4 | 58.3 | 85.7 |
| 1962 | 162.3 | 4.6 | 9.4 | 59.7 | 88.6 |
| 1963 | 168.2 | 4.6 | 9.4 | 61.8 | 92.4 |
| 1964 | 190.6 | 4.9 | 11.2 | 68.2 | 106.2 |
| 1965 | 200.2 | 5.1 | 12.1 | 71.7 | 111.3 |
| 1966 | 220.0 | 5.6 | 13.2 | 80.8 | 120.3 |
| 1967 | 253.2 | 6.2 | 14.0 | 102.8 | 130.2 |
| 1968 | 298.4 | 6.9 | 15.9 | 131.8 | 143.8 |
| 1969 | 328.7 | 7.3 | 18.5 | 148.4 | 154.5 |
| 1970 | 363.5 | 7.9 | 18.7 | 172.1 | 164.8 |
| 1971 | 396.0 | 8.6 | 20.5 | 188.0 | 178.8 |
| 1972 | 401.0 | 9.0 | 22.5 | 180.7 | 188.8 |
| 1973 | 417.4 | 9.4 | 24.5 | 183.1 | 200.5 |
| 1974 | 461.1 | 9.8 | 26.2 | 209.3 | 215.8 |
| 1975 | 487.8 | 9.6 | 26.3 | 220.8 | 231.1 |
| 1976 | 467.8 | 8.7 | 26.6 | 199.3 | 233.2 |
| 1977 | 475.9 | 8.8 | 29.4 | 190.7 | 247.0 |
| 1978 | 497.8 | 9.0 | 31.0 | 195.8 | 262.1 |
| 1979 | 548.9 | 9.8 | 34.7 | 218.4 | 286.0 |
| 1980 | 596.6 | 10.2 | 36.8 | 251.1 | 298.5 |
| 1981 | 594.3 | 9.8 | 36.0 | 258.4 | 289.3 |
| 1982 | 570.8 | 9.1 | 34.0 | 238.8 | 289.0 |
| 1983 | 537.7 | 8.3 | 33.8 | 216.7 | 279.4 |
| 1984 | 539.9 | 7.9 | 35.7 | 205.7 | 290.6 |
| 1985 | 556.6 | 8.0 | 36.8 | 209.3 | 304.0 |
| 1986 | 620.1 | 8.6 | 38.1 | 226.0 | 347.4 |
| 1987 | 612.5 | 8.3 | 37.6 | 213.7 | 352.9 |
| 1988 | 640.6 | 8.5 | 37.8 | 222.1 | 372.2 |
| 1989 | 666.9 | 8.7 | 38.3 | 234.3 | 385.6 |
| 1990 | 729.6 | 9.4 | 41.1 | 256.3 | 422.9 |
| 1991 | 758.2 | 9.8 | 42.3 | 272.7 | 433.4 |
| 1992 | 757.7 | 9.3 | 42.8 | 263.7 | 441.9 |
| 1993 | 747.1 | 9.5 | 41.1 | 256.0 | 440.5 |
| 1994 | 713.6 | 9.0 | 39.3 | 237.8 | 427.6 |
| 1995 | 684.5 | 8.2 | 37.1 | 220.9 | 418.3 |
| 1996 | 636.6 | 7.4 | 36.3 | 201.9 | 391.0 |
| 1997 | 611.0 | 6.8 | 35.9 | 186.2 | 382.1 |
| 1998 | 567.6 | 6.3 | 34.5 | 165.5 | 361.4 |
| 1999 | 523.0 | 5.7 | 32.8 | 150.1 | 334.3 |
| 2000 | 506.5 | 5.5 | 32.0 | 145.0 | 324.0 |
| 2001 | 504.5 | 5.6 | 31.8 | 148.5 | 318.6 |
| 2002 | 494.4 | 5.6 | 33.1 | 146.1 | 309.5 |
| 2003 | 475.8 | 5.7 | 32.3 | 142.5 | 295.4 |
| 2004 | 463.2 | 5.5 | 32.4 | 136.7 | 288.6 |
| 2005 | 469.0 | 5.6 | 31.8 | 140.8 | 290.8 |
| 2006 | 473.6 | 5.8 | 31.6 | 150.0 | 292.0 |
| 2007 | 471.8 | 5.7 | 30.6 | 148.3 | 287.2 |
| 2008 | 458.6 | 5.4 | 29.8 | 145.9 | 277.5 |
| 2009 | 431.9 | 5.0 | 29.1 | 133.1 | 264.7 |
| 2010 | 404.5 | 4.8 | 27.7 | 119.3 | 252.8 |
| 2011 | 387.1 | 4.7 | 27.0 | 113.9 | 241.5 |
| 2012 | 386.9 | 4.7 | 26.9 | 112.9 | 242.3 |
| 2013 | 369.1 | 4.5 | 25.9 | 109.0 | 229.6 |
| 2014 | 361.1 | 4.4 | 26.6 | 101.3 | 229.2 |
| 2015 | 373.7 | 4.9 | 28.4 | 102.2 | 238.1 |
| 2016 | 386.3 | 5.3 | 29.6 | 102.8 | 248.5 |
Property crime rates (per 100,000) in the United States (1960–2016):[17][18]
| Year | Property crime | Burglary | Larceny | Motor vehicle theft |
|---|---|---|---|---|
| 1960 | 1,726.3 | |||
| 1961 | 1,747.9 | |||
| 1963 | 2,012 | |||
| 1965 | 2,249 | |||
| 1967 | 2,736 | |||
| 1969 | 3,351 | |||
| 1971 | 3,769 | |||
| 1973 | 3,737 | |||
| 1975 | 4,811 | |||
| 1977 | 4,602 | |||
| 1979 | 5,017 | |||
| 1981 | 5,264 | |||
| 1983 | 4,637 | |||
| 1985 | 4,650 | |||
| 1987 | 4,940 | |||
| 1989 | 5,078 | |||
| 1991 | 5,140 | |||
| 1992 | 4,903.7 | 1,168.4 | 3,103.6 | 631.6 |
| 1993 | 4,740.0 | 1,099.7 | 3,033.9 | 606.3 |
| 1994 | 4,660.2 | 1,042.1 | 3,026.9 | 591.3 |
| 1995 | 4,590.5 | 987.0 | 3,043.2 | 560.3 |
| 1996 | 4,451.0 | 945.0 | 2,980.3 | 525.7 |
| 1997 | 4,316.3 | 918.8 | 2,891.8 | 505.7 |
| 1998 | 4,052.5 | 863.2 | 2,729.5 | 459.9 |
| 1999 | 3,743.6 | 770.4 | 2,550.7 | 422.5 |
| 2000 | 3,618.3 | 728.8 | 2,477.3 | 412.2 |
| 2001 | 3,658.1 | 741.8 | 2,485.7 | 430.5 |
| 2002 | 3,630.6 | 747.0 | 2,450.7 | 432.9 |
| 2003 | 3,591.2 | 741.0 | 2,416.5 | 433.7 |
| 2004 | 3,514.1 | 730.3 | 2,362.3 | 421.5 |
| 2005 | 3,431.5 | 726.9 | 2,287.8 | 416.8 |
| 2006 | 3,346.6 | 733.1 | 2,213.2 | 400.2 |
| 2007 | 3,276.4 | 726.1 | 2,185.4 | 364.9 |
| 2008 | 3,214.6 | 733.0 | 2,166.1 | 315.4 |
| 2009 | 3,041.3 | 717.7 | 2,064.5 | 259.2 |
| 2010 | 2,945.9 | 701.0 | 2,005.8 | 239.1 |
| 2011 | 2,905.4 | 701.3 | 1,974.1 | 230.0 |
| 2012 | 2,859.2 | 670.2 | 1,959.3 | 229.7 |
| 2013 | 2,733.6 | 610.5 | 1,901.9 | 221.3 |
| 2014 | 2,574.1 | 537.2 | 1,821.5 | 215.4 |
| 2015 | 2,500.5 | 494.7 | 1,783.6 | 222.2 |
| 2016 | 2,450.7 | 468.9 | 1,745.0 | 236.9 |
Arrests
Each state has a set of statutes enforceable within its own borders. A state has no jurisdiction outside of its borders, even though still in the United States. It must request extradition from the state in which the suspect has fled. In 2014, there were 186,873 felony suspects outside specific states jurisdiction against whom no extradition would be sought. Philadelphia has about 20,000 of these since it is near a border with four other states. Extradition is estimated to cost a few hundred dollars per case.[19]
Analysis of arrest data from California indicates that the most common causes of felony arrest are for violent offenses such as robbery and assault, property offenses such as burglary and auto theft, and drug offenses. For misdemeanors, the most common causes of arrest were traffic offenses, most notably impaired driving, drug offenses, and failure to appear in court. Other common causes of misdemeanor arrest included assault and battery and minor property offenses such as petty theft.[20]
Characteristics of offenders
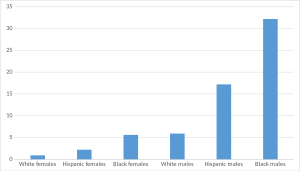
For 2012, law enforcement made approximately 12,200,000 arrests nationally, down 200,000 from 2011.[21][22] Arrested offenders in the United States tend to be male,[23][24] over age 18,[25][26] and white, mirroring the general population. Based on a comparison with race and ethnicity data from the 2010 Census, blacks are arrested for more crimes than average, Native Americans are arrested for slightly more crimes than average, whites are arrested for slightly fewer crimes than average, and Asians and Pacific Islanders are arrested for fewer crimes than average.[27][28]
| Year | White and Hispanic | Black | American Indian or Alaskan Native | Asian or Pacific Islander |
|---|---|---|---|---|
| 2012 | 6,502,919 | 2,640,067 | 135,165 | 112,322 |
| As proportion of population[29][30] | 223,553,265 (2.9%) | 38,929,319 (6.8%) | 2,932,248 (4.6%) | 15,214,265 (0.7%) |
| Proportion of total crime | 69.3% | 28.1% | 1.4% | 1.2% |
| Year | Male | Female | Male (%) | Female (%) |
|---|---|---|---|---|
| 2012 | 6,972,023 | 2,474,637 | 73.8 | 26.2 |
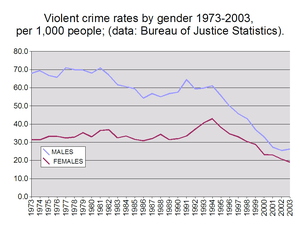
Characteristics of offenders vary from the average for specific types of crimes and specific crimes. In terms of violent crime by gender, in 2011, 80.4% of arrested persons were male and 19.6% were female.[24] Males were 88.2% of those arrested for homicide, while females were 11.8%.[24] Among those arrested for rape in 2011, males were 98.8% and females were 1.2%.[24] For property crime in 2011, 62.9% of arrested persons were male and 37.1% were female.[24]
For violent crime by race in 2011, 59.4% of those arrested were white, 38.3% were black, and 2.2% were of other races.[28] For persons arrested for homicide in 2011, 49.7% were black, 48% were white, and 2.3% were of other races.[28] For persons arrested for rape in 2011, 65% were white, 32.9% were black, and 2.1% were of other races.[28] For property crime in 2011, 68.1% of arrested persons were white, 29.5% were black, and 2.4% were of other races.[28]
In 2011, law enforcement reported 6,222 bias-motivated incidents, known as hate crimes, for which 5,731 offenders were identified.[32] Of these, 59% were white, 20.9% were black, 7.1% were of various races, 1.4% were Asian or Pacific Islanders, 0.8% were Native American, and 10.8% were of unknown race.[32]
Crime victimology
In 2011, surveys indicated more than 5.8 million violent victimizations and 17.1 million property victimizations took place in the United States; according to the Bureau of Justice Statistics, each property victimization corresponded to one household, while violent victimizations is the number of victims of a violent crime.[33]
Patterns are found within the victimology of crime in the United States. Overall, males, people with lower incomes, those younger than 25, and non-whites were more likely to report being the victim of crime.[33] Income, gender, and age had the most dramatic effect on the chances of a person being victimized by crime, while the characteristic of race depended upon the crime being committed.[33]
In terms of gender, males were more likely to become crime victims than were females,[34] with 79% percent of all murder victims being male. Males were twice as likely to be carjacked as females.[34] In terms of income, households with a 2008 income of less than $15,000 were significantly more likely to have their homes burglarized.[34]
Concerning age, those younger than twenty-five were more likely to fall victim to crime, especially violent crime.[35] The chances of being victimized by violent crime decreased far more substantially with age than the chances of becoming the victim of property crime.[35] For example, 3.03% of crimes committed against a young person were theft, while 20% of crimes committed against an elderly person were theft.[35]
Bias motivation reports showed that of the 7,254 hate crimes reported in 2011, 47.7% (3,465) were motivated by race, with 72% (2,494) of race-motivated incidents being anti-black.[32] In addition, 20.8% (1,508) of hate crimes were motivated by sexual orientation, with 57.8% (871) of orientation-motivated incidents being anti-male homosexual.[32] The third largest motivation factor for hate crime was religion, representing 18.2% (1,318) incidents, with 62.2% (820) of religion-motivated incidents being anti-Jewish.[32]
As of 2007, violent crime against homeless people is increasing.[36]
The likelihood of falling victim to crime relates to both demographic and geographic characteristics.[1] Overall, men, minorities, the young, and those in urban areas are more likely to be crime victims.[1] The likelihood of perpetrating crime also relates to demography.
In 2010, according to the UNODC, 67.5% of all homicides in the United States were perpetrated using a firearm.[37] The costliest crime in terms of impact on victims, and the most underreported crime is rape, in the United States.[38][39]
Incarceration
The United States has the highest incarceration rate in the world (which includes pre-trial detainees and sentenced prisoners).[40] As of 2009, 2.3 million people were incarcerated in the United States, including federal and state prisons and local jails, creating an incarceration rate of 793 persons per 100,000 of national population.[40] During 2011, 1.6 million people were incarcerated under the jurisdiction of federal and state authorities.[41] At the end of 2011, 492 persons per 100,000 U.S. residents were incarcerated in federal and state prisons.[41] Of the 1.6 million state and federal prisoners, nearly 1.4 million people were under state jurisdiction, while 215,000 were under federal jurisdiction.[41] Demographically, nearly 1.5 million prisoners were male, and 115,000 were female, while 581,000 prisoners were black, 516,000 were white, and 350,000 were Hispanic.[41]
Among the 1.35 million sentenced state prisoners in 2011, 725,000 people were incarcerated for violent crimes, 250,000 were incarcerated for property crimes, 237,000 people were incarcerated for drug crimes, and 150,000 were incarcerated for other offenses.[41] Of the 200,000 sentenced federal prisoners in 2011, 95,000 were incarcerated for drug crimes, 69,000 were incarcerated for public order offenses, 15,000 were incarcerated for violent crimes, and 11,000 were incarcerated for property crimes.[41]
International comparison
The manner in which America's crime rate compared to other countries of similar wealth and development depends on the nature of the crime used in the comparison.[42] Overall crime statistic comparisons are difficult to conduct, as the definition and categorization of crimes varies across countries. Thus an agency in a foreign country may include crimes in its annual reports which the United States omits, and vice versa.
However, some countries such as Canada have similar definitions of what constitutes a violent crime, and nearly all countries had the same definition of the characteristics that constitutes a homicide. Overall the total crime rate of the United States is higher than developed countries, specifically Europe, with South American countries and Russia being the exceptions.[43] Some types of reported property crime in the U.S. survey as lower than in Germany or Canada, yet the homicide rate in the United States is substantially higher as is the prison population.
Violent crime
The reported U.S. violent crime rate includes murder, rape and sexual assault, robbery, and assault,[44] whereas the Canadian violent crime rate includes all categories of assault, including Assault level 1 (i.e., assault not using a weapon and not resulting in serious bodily harm).[45][46] A Canadian government study concluded that direct comparison of the two countries' violent crime totals or rates was "inappropriate".[47]
France does not count minor violence such as punching or slapping as assault, whereas Austria, Germany, and Finland do count such occurrences.[48]
The United Kingdom similarly has different definitions of what constitutes violent crime compared to the United States, making a direct comparison of the overall figure flawed. The FBI's Uniform Crime Reports defines a "violent crime" as one of four specific offenses: murder and non-negligent manslaughter, forcible rape, robbery, and aggravated assault. The British Home Office, by contrast, has a different definition of violent crime, including all "crimes against the person," including simple assaults, all robberies, and all "sexual offenses," as opposed to the FBI, which only counts aggravated assaults and "forcible rapes."[49]
Crime rates are necessarily altered by averaging neighborhood higher or lower local rates over a larger population which includes the entire city. Having small pockets of dense crime may lower a city's average crime rate.
| Country | Homicide | Rape | Robbery | Assault |
|---|---|---|---|---|
| Australia | 1.2 | 91.9 | 18 | 327 |
| Germany | 0.8 | 8.9 | 60 | 630 |
| England/Wales | 1.1 | 27.7 | 137 | 730 |
| Scotland | 1.6 | 17.0 | 48 | 1487 |
| US | 5.0 | 28.6 | 133 | 241 |
| Sweden | 1.0 | 58.6 | 103 | 927 |
Homicide
According to a 2013 report by the United Nations Office on Drugs and Crime (UNODC), between 2005 and 2012, the average homicide rate in the U.S. was 4.9 per 100,000 inhabitants compared to the average rate globally, which was 6.2. However, the U.S. had much higher murder rates compared to four other selected "developed countries", which all had average homicide rates of 0.8 per 100,000.[43] In 2004, there were 5.5 homicides for every 100,000 persons, roughly three times as high as Canada (1.9) and six times as high as Germany and Italy (0.9).[51][45] A closer look at The National Archive of Criminal Justice Data indicates that per capita homicide rates over the last 30 plus years on average, of major cities, New Orleans' average annual per capita homicide rate of 52 murders per 100,000 people overall (1980–2012) is the highest of U.S. cities with average annual homicide totals that were among the top 10 highest during the same period.
In 2018, the US murder rate was 5.0 per 100,000, for a total of 15,498 murders.[52]
| Country | Singapore | Iceland | Armenia | United States | Moldova | South Sudan | Panama |
|---|---|---|---|---|---|---|---|
| Homicide rate (per hundred thousand) in 2012 (international methodology)[43] | 0.2 | 0.5 | 1.7 | 5.1 | 5.2 | 12 | 53.1 |
In the United States, the number of homicides where the victim and offender relationship was undetermined has been increasing since 1999 but has not reached the levels experienced in the early 1990s. In 14% of all murders, the victim and the offender were strangers. Spouses and family members made up about 15% of all victims, about one-third of the victims were acquaintances of the assailant, and the victim and offender relationship was undetermined in over one-third of homicides. Gun involvement in homicides were gang-related homicides which increased after 1980, homicides that occurred during the commission of a felony which increased from 55% in 1985 to 77% in 2005, homicides resulting from arguments which declined to the lowest levels recorded recently, and homicides resulting from other circumstances which remained relatively constant. Because gang killing has become a normal part of inner cities, many including police hold preconceptions about the causes of death in inner cities. When a death is labeled gang-related it lowers the chances that it will be investigated and increases the chances that the perpetrator will remain at large. In addition, victims of gang killings often determine the priority a case will be given by police. Jenkins (1988) argues that many serial murder cases remain unknown to police and that cases involving Black offenders and victims are especially likely to escape official attention.[53]
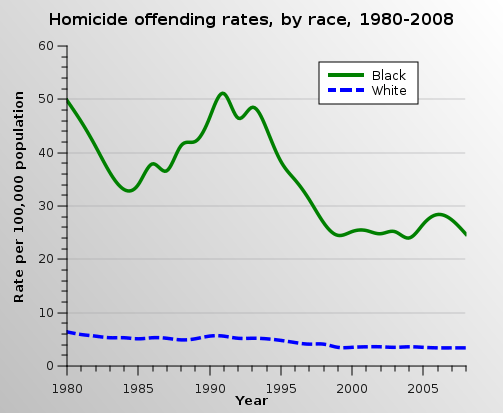
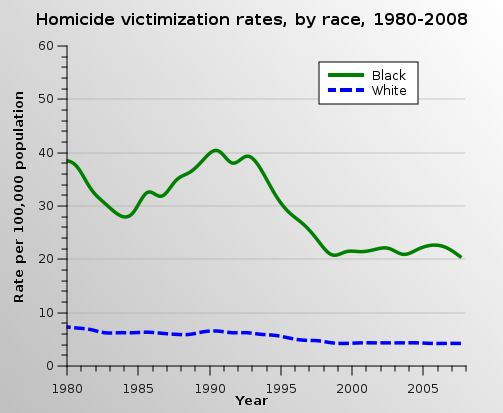
According to the FBI, "When the race of the offender was known, 53.0 percent were black, 44.7 percent were white, and 2.3 percent were of other races. The race was unknown for 4,132 offenders. (Based on Expanded Homicide Data Table 3). Of the offenders for whom gender was known, 88.2 percent were male."[54] According to the U.S. Bureau of Justice Statistics, from 1980 to 2008, 84 percent of white homicide victims were killed by white offenders and 93 percent of black homicide victims were killed by black offenders.[31]
Gun violence
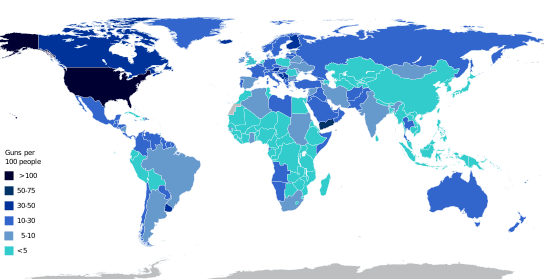
The United States has the highest rate of civilian gun ownership per capita.[55][56][57] According to the CDC, between 1999 and 2014 there have been 185,718 homicides from use of a firearm and 291,571 suicides using a firearm.[58] Despite a significant increase in the sales of firearms since 1994, the US has seen a drop in the annual rate of homicides using a firearm from 7.0 per 100,000 population in 1993 to 3.6 per 100,000.[59] In the ten years between 2000 and 2009, the ATF reported 37,372,713 clearances for purchase, however, in the four years between 2010 and 2013, the ATF reported 31,421,528 clearances.[60]
Property crime
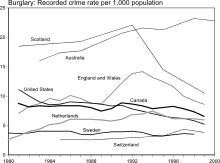
According to a 2004 study by the Bureau of Justice Statistics, looking at the period from 1981 to 1999, the United States had a lower surveyed residential burglary rate in 1998 than Scotland, England, Canada, the Netherlands, and Australia. The other two countries included in the study, Sweden and Switzerland, had only slightly lower burglary rates. For the first nine years of the study period the same surveys of the public showed only Australia with rates higher than the United States. The authors noted various problems in doing the comparisons including infrequent data points. (The United States performed five surveys from 1995 to 1999 when its rate dipped below Canada's, while Canada ran a single telephone survey during that period for comparison.)[42]
Crimes against children
Violence against children from birth to adolescence is considered a "global phenomenon that takes many forms (physical, sexual, emotional), and occurs in many settings, including the home, school, community, care, and justice systems, and over the Internet."[61]
According to a 2001 report from UNICEF, the United States has the highest rate of deaths from child abuse and neglect of any industrialized nation, at 2.4 per 100,000 children; France has 1.4, Japan 1, UK 0.9 and Germany 0.8. According to the US Department of Health, the state of Texas has the highest death rate, at 4.1 per 100,000 children, New York has 2.5, Oregon 1.5 and New Hampshire 0.4. [62] A 2018 report from the Congressional Research Service stated, at the national level, violent crime and homicide rates have increased each year from 2014 to 2016.[63]
In 2016, data from the National Child Abuse and Neglect Data System (NCANDS) revealed that approximately 1,750 children died from either abuse or neglect; further, this is a continuing trend with an increasing 7.4% of crimes against children from 2012 to 2016 and these statistics can be compared to a rate of 2.36 children per 100,000 children in the United States general population.[64] In addition, 44.2% of these 2016 statistics are specific to physical abuse towards a child.[64]
A 2016 report from the Child Welfare Information Gateway also showed that 78% of the main perpetrators of violence against children in the United States are caused by a parent.
Human trafficking
Human trafficking is categorized into the following three groups: (1) sex trafficking; (2) sex and labor trafficking; and (3) labor trafficking; In addition, the rate of domestic minor sex trafficking has exponentially increased over the years. Sex trafficking of children also referred to as commercial sexual exploitation of children, is categorized by the following forms: pornography, prostitution, child sex tourism, and child marriage. Profiles of traffickers and types of trafficking differ in the way victims are abducted, how they are treated, and the reason for the abduction.
According to a 2017 report from the National Human Trafficking Hotline (NHTH), out of 10,615 reported survivors of sex trafficking, 2,762 of those survivors were minors.[65]
The U.S. Department of Justice defines Commercial Sexual Exploitation of Children (CSEC) as a range of crimes and activities involving the sexual abuse or exploitation of a child for the financial benefit of any person or in exchange for anything of value (including monetary and non-monetary benefits) given or received by any person. These crimes against children, which may occur at any time or place, rob them of their childhood and are extremely detrimental to their emotional and psychological development.[66]
Types of human sex trafficking
In Pimp-controlled trafficking, the pimp typically is the only trafficker involved who has full physical, psychological and emotional control over the victim. In Gang-controlled trafficking, a large group of people has power over the victim, forcing the victim to take part in illegal or violent tasks for the purpose of obtaining drugs. Another form is called Familial trafficking, which differs the most from the two mentioned above because the victim is typically not abducted. Instead, the victim is forced into being sexually exploited by family members in exchange for something of monetary value, whether that's paying back debt, or obtaining drugs or money. This type of sexual exploitation tends to be the most difficult to detect, yet remains as the most prevalent form of human sex trafficking within the United States.[66]
In 2009, the Office of Juvenile Justice and Delinquency Prevention reported that the average age when children first fall victim to CSEC is between ages 12 and 14. However, this age has become increasingly younger due to exploiters' fear of contracting HIV or AIDS from older victims.[66]
In 2018, the Office of Public Affairs within the Department of Justice released a report from operation "Broken Heart" conducted by Internet Crimes Against Children (ICAC) task forces, stating that more than 2,300 suspected online child sex offenders were arrested on the following allegations:[67]
- produce, distribute, receive and possess child pornography
- engage in online enticement of children for sexual purposes
- engage in the sex trafficking of children
- travel across state lines or to foreign countries and sexually abuse children
In addition, a 2011 report by the Bureau of Justice Statistics described the characteristics of suspected human trafficking incidents, identifying roughly 95% of victims as female and over half as 17 years old or younger.[66]
Geography of crime
Crime rates vary in the United States depending on the type of community.[68] Within metropolitan statistical areas, both violent and property crime rates are higher than the national average; in cities located outside metropolitan areas, violent crime was lower than the national average, while property crime was higher.[68] For rural areas, both property and violent crime rates were lower than the national average.[68]
Regions
For regional comparisons, the FBI divides the United States into four regions: Northeast, Midwest, South, and West.[69] For 2011, the region with the lowest violent crime was the Midwest, with a rate of 349.9 per 100,000 residents, while the region with the highest violent crime rate was the South, with a rate of 428.8 per 100,000.[69] For 2011, the region with the lowest property crime rate was the Northeast, with a rate of 2,121.8 per 100,000 residents, while the region with the highest property crime rate was the South, with a rate of 3,370.8 per 100,000.[69]
States
Crime rates vary among U.S. states.[70] In 2011, the state with the lowest violent crime rate was Maine, with a rate of 123.2 per 100,000 residents, while the state with the highest violent crime rate was Tennessee, with a rate of 608.2 per 100,000.[70] However, the District of Columbia, the U.S. capital district, had a violent crime rate of 1,202.1 per 100,000 in 2011.[70] In 2011, the state with the highest property crime rate was South Carolina, with a rate of 3,904.2 per 100,000, while the state with the lowest property crime rate was South Dakota, with a rate of 1,817.7 per 100,000.[70] However, Puerto Rico, an unincorporated territory of the United States, had a property crime rate of 1,395.2 per 100,000 in 2011.[70]
Metropolitan areas
Crime in metropolitan statistical areas tends to be above the national average; however, wide variance exists among and within metropolitan areas.[71] Some responding jurisdictions report very low crime rates, while others have considerably higher rates; these variations are due to many factors beyond population.[71] FBI crime statistics publications strongly caution against comparison rankings of cities, counties, metropolitan statistical areas, and other reporting units without considering factors other than simply population.[71] For 2011, the metropolitan statistical area with the highest violent crime rate was the Memphis metropolitan area, with a rate of 980.4 per 100,000 residents, while the metropolitan statistical area with the lowest violent crime rate was Logan metropolitan area, with a rate of 47.7.[72][73]
It is quite common for crime in American cities to be highly concentrated in a few, often economically disadvantaged areas. For example, San Mateo County, California had a population of approximately 707,000 and 17 homicides in 2001. Six of these 17 homicides took place in poor East Palo Alto, which had a population of roughly 30,000. So, while East Palo Alto accounted for a mere 4.2% of the population, about one-third of the homicides took place there.[74]
| Metropolitan statistical area | Violent crime rate | Property crime rate |
|---|---|---|
| New York-Northern New Jersey-Long Island, NY-NJ-PA MSA | 406.0 | 1744.1 |
| Los Angeles-Long Beach-Santa Ana, CA MSA | 405.4 | 2232.7 |
| Chicago-Joliet-Naperville, IL-IN-WI MSA | 357.2 | 2791.5 |
| Dallas-Fort Worth-Arlington, TX MSA | 358.4 | 3498.5 |
| Houston-Sugar Land-Baytown, TX MSA | 550.8 | 3576.9 |
| Philadelphia-Camden-Wilmington, PA-NJ-DE-MD MSA | 532.3 | 2747.3 |
| Washington-Arlington-Alexandria, DC-VA-MD-WV MSA | 334.6 | 2386.0 |
| Miami-Fort Lauderdale-Pompano Beach, FL MSA | 596.7 | 4193.3 |
| Atlanta-Sandy Springs-Marietta, GA MSA | 400.9 | 3552.0 |
| Boston-Cambridge-Quincy, MA-NH MSA | 374.7 | 2109.0 |
Number and growth of criminal laws
There are conflicting opinions on the number of federal crimes,[75][76] but many have argued that there has been explosive growth and it has become overwhelming.[77][78][79] In 1982, the U.S. Justice Department could not come up with a number, but estimated 3,000 crimes in the United States Code.[75][76][80] In 1998, the American Bar Association (ABA) said that it was likely much higher than 3,000, but didn't give a specific estimate.[75][76] In 2008, the Heritage Foundation published a report that put the number at a minimum of 4,450.[76] When staff for a task force of the U.S. House Judiciary Committee asked the Congressional Research Service (CRS) to update its 2008 calculation of criminal offenses in the United States Code in 2013, the CRS responded that they lack the manpower and resources to accomplish the task.[81]
See also
- Gangs in the United States
- Incarceration in the United States
- Mass shootings in the United States
- Race and crime in the United States
- National Crime Information Center Interstate Identification Index
- United States cities by crime rate
- List of U.S. states by homicide rate
- Strict liability (criminal) § United States
- Contempt of court § United States
- List of criminal enterprises, gangs and syndicates § United States
References
- "Criminal Victimization Survey" (PDF). Bureau of Justice Statistics. 2011. Archived from the original (PDF) on February 17, 2013. Retrieved May 15, 2013.
- "Crime in the United States". FBI. 2011. Retrieved May 15, 2013.
- "Uniform Crime Reports". FBI. Retrieved May 15, 2013.
- Charlie Savage (January 6, 2012). "U.S. to Expand its Definition of Rape in Statistics". New York Times. Retrieved May 15, 2013.
- "Uniform Crime Reports Data Tool". FBI. Archived from the original on July 3, 2013. Retrieved May 15, 2013.
- Fischer, Claude. "A crime puzzle: Violent crime declines in America". UC Regents. Retrieved April 24, 2012.
- "5 facts about crime in the U.S." Retrieved March 22, 2019.
- Levitt, Steven D. (2004). "Understanding Why Crime Fell in the 1990s: Four Factors that Explain the Decline and Six that Do Not" (PDF). Journal of Economic Perspectives. 18 (1): 163–190. doi:10.1257/089533004773563485. Retrieved November 29, 2012.
- "Effect of the Violent Crime Control and Law Enforcement Act of 1994". West's Encyclopedia of American Law, edition 2. 2008.
- Donohue, John; Levitt, Steven (March 1, 2000). "The Impact of Legalized Abortion on Crime". Berkeley Program in Law & Economics, Working Paper Series. 2000 (2): 69. Retrieved March 15, 2014.
- Von Drehle, David (February 22, 2010). "What's Behind America's Falling Crime Rate". Time Magazine. Retrieved January 8, 2013.
- Roeder, Oliver K.; et al. (February 12, 2015). "What Caused the Crime Decline?". Brennan Center for Justice. SSRN 2566965. Retrieved August 29, 2019.
- When Brute Force Fails: How to Have Less Crime and Less Punishment, Princeton University Press 2009 p. 133 citing Richard Nevin, "How Lead Exposure Relates to Temoral Changes in IQ, Violent Crime and Unwed Pregnancy," Environmental Research 83, 1 (2000): 1–22.
- Farrell, G.; Tseloni, A.; Mailley, J.; Tilley, N. (February 22, 2011). "The Crime Drop and the Security Hypothesis" (PDF). Journal of Research in Crime and Delinquency. 48 (2): 147–175. doi:10.1177/0022427810391539.
- Wadsworth, Tim (June 2010). "Is Immigration Responsible for the Crime Drop? An Assessment of the Influence of Immigration on Changes in Violent Crime Between 1990 and 2000". Social Science Quarterly. 91 (2): 531–553. doi:10.1111/j.1540-6237.2010.00706.x.
- Sampson, Robert J. (February 2008). "Rethinking crime and immigration". Contexts. 7 (1): 28–33. doi:10.1525/ctx.2008.7.1.28.
- "Crime in the US, 1960-2004, Bureau of Justice Statistics". Archived from the original on July 20, 2011. Retrieved September 29, 2006.
- "Crime in the United States by Volume and Rate per 100,000 Inhabitants, 1997–2016".
- Heath, Brad (March 13, 2014). "A license to commit crimes". USA Today. pp. 1B, 4B. Retrieved March 13, 2014.
- Lofstrom, Magnus; Martin, Brandon; Goss, Justin; Hayes, Joseph; Raphael, Steven (December 2018). "New Insights into California Arrests" (PDF). Public Policy Institute of California. p. 8. Retrieved August 9, 2019.
- "Crime in the United States, Persons Arrested". FBI. 2012.
- "Crime in the United States, Persons Arrested". FBI. 2011.
- "Crime in the United States, Arrests by Sex". FBI. 2012.
- "Crime in the United States, Arrests by Sex". FBI. 2011.
- "Crime in the United States, Arrests by Age". FBI. 2012.
- "Crime in the United States, Arrests by Age". FBI. 2011.
- "Crime in the United States, Arrests by Race". FBI. 2012.
- "Crime in the United States, Arrests by Race". FBI. 2011.
- Demographics of the United States#Race and ethnicity
- Center for New Media and Promotions(C2PO). "2010 Census". census.gov. Archived from the original on December 21, 2013.
- Cooper, Alexia D.; Smith, Erica L. (November 16, 2011). Homicide Trends in the United States, 1980-2008 (Report). Bureau of Justice Statistics. p. 11. NCJ 236018. Archived from the original on March 30, 2018.
- "Hate Crime Statistics, Offenders". FBI. 2011.
- Bureau of Justice Statistics (October 2012). "Criminal Victimization, 2011" (PDF). U.S. Department of Justice. p. 1.
- Bureau of Justice Statistics (September 2009). "Criminal Victimization, 2008" (PDF). U.S. Department of Justice. Archived from the original (PDF) on July 16, 2011. Retrieved February 17, 2010.
- Bureau of Justice Statistics. "Criminal Victimization, 2005". U.S. Department of Justice. Archived from the original on September 26, 2006.
- Lewan, Todd, "Unprovoked Beatings of Homeless Soaring", Associated Press, April 8, 2007.
- Homicides by firearms UNODC. Retrieved: July 28, 2012.
- "Statistics". acasa.us. Retrieved September 27, 2017.
- "Rape and Sexual Assault". mainweb-v.musc.edu. Retrieved September 27, 2017.
- R. Walmsley (May 2011). "World Prison Population List" (PDF). International Centre for Prison Studies.
- Bureau of Justice Statistics (December 2012). "Prisoners in 2011" (PDF). U.S. Department of Justice.
- "National Crime Rates Compared". Archived from the original on November 15, 2006. Retrieved September 29, 2006.
- UNODC (2014). "Global Study on Homicide 2013" (PDF). United Nations publication. ISBN 978-92-1-054205-0. Sales No. 14.IV.1. Retrieved December 27, 2016.
- "Violent Crime". United States Bureau of Justice Statistics. Retrieved July 21, 2014.
- "BKA, German federal crime statistics 2004 (German)" (PDF). Bka.de. Archived from the original (PDF) on June 21, 2007. Retrieved September 27, 2006.
- "Crime in Canada, Canada Statistics". Archived from the original on August 6, 2008. Retrieved August 14, 2008.
- Feasibility Study on Crime Comparisons Between Canada and the United States Maire Gannon, Canadian Centre for Justice Statistics, Statistics Canada, Cat. no. 85F0035XIE, Accessed June 28, 2009
- European Sourcebook of Crime and Criminal Justice Statistics 2010, Fourth edition, English.wodc.nl
- "By the Numbers: Is the UK really 5 times more violent than the US?". The Skeptical Libertarian. January 12, 2013. Retrieved September 27, 2017.
- "Comparisons of Crime in OECD Countries" (PDF). civitas.org.uk. Civitas. Retrieved June 25, 2020.
- "Crime in Canada, Canada Statistics". Archived from the original on August 28, 2006. Retrieved September 27, 2006.
- "FBI: Uniform Crime Report 2018".
- Jenkins, P. (1988). "Myth and murder: the serial killer panic of 1983–1985", Criminal Justice Research Bulletin. 3(11) 1–7.
- "FBI – Expanded Homicide Data – 2014". Federal Bureau of Investigation (FBI).
- Keith Krause; Eric G. Berman, eds. (August 2007). "Small Arms Survey 2007 – Chapter 2. Completing the Count: Civilian Firearms". Geneva, Switzerland: Small Arms Survey. Retrieved June 20, 2013.
- Vladeta Ajdacic-Gross; Martin Killias; Urs Hepp; Erika Gadola; Matthias Bopp; Christoph Lauber; Ulrich Schnyder; Felix Gutzwiller; Wulf Rössler (October 2006). "Firearm suicides and the availability of firearms: analysis of longitudinal international data". Am J Public Health. Rockville Pike, Bethesda MD, US. 96: 1752–5. doi:10.2105/AJPH.2005.075812. PMC 1586136. PMID 16946021.
- Killias, Martin (August 1993). "Gun Ownership, Suicide and Homicide: An International Perspective". Understanding Crime Experiences of Crime and Crime Control (PDF). Acts of the International Conference, Rome, November 18–20, 1992. Publication No. 49. United Nations Publication, Interregional Crime and Justice Research Institute (UNICRI). pp. 289–302. Sales No. E.93.III.N.2; NCJ 146360. Retrieved December 27, 2016.
- "CDC WISQARS Fatal Injury Reports, National and Regional, 1999–2014". Atlanta, GA: US Centers for Disease Control. Retrieved October 13, 2016.
- Max Ehrenfreund (December 3, 2015). "We've had a massive decline in gun violence in the United States. Here's why". Washington, DC: Washington Post. Retrieved October 13, 2016.
- "Firearms Commerce in the United States: Annual Statistical Update 2015". Washington, DC: United States Department of Justice, Bureau of Alcohol, Tobacco, Firearms, and Explosives. March 15, 2016. Retrieved October 13, 2016.
- "UNICEF Annual Report 2017". UNICEF. Retrieved April 18, 2019.
- BBC – America's child death shame, October 17, 2011
- James, Nathan (October 29, 2015). "Is Violent Crime in the United States Increasing?". Digital Library. Retrieved April 18, 2019.
- "Child Abuse and Neglect Fatalities 2016: Statistics and Interventions – Child Welfare Information Gateway". www.childwelfare.gov. Retrieved April 18, 2019.
- "2017 Hotline Statistics". Polaris. March 12, 2018. Retrieved April 18, 2019.
- "Commercial Sexual Exploitation of Children, Office of Juvenile Justice and Delinquency Prevention, OJJDP". Office of Juvenile Justice and Delinquency Prevention, OJJDP. Retrieved April 18, 2019.
- "More Than 2,300 Suspected Online Child Sex Offenders Arrested During Operation 'Broken Heart'". www.justice.gov. June 12, 2018. Retrieved April 18, 2019.
- "Crime in the United States by Community Type". FBI. 2011.
- "Crime in the United States by Region". FBI. 2011.
- "Crime in the United States by State". FBI. 2011.
- "Caution Against Ranking". FBI. 2011.
- "Crime in the United States by Metropolitan Statistical Area". FBI. 2011.
- Data collection methodology for Chicago for forcible rape did not align with FBI standards so its metropolitan statistical area violent crime rate was not reported.
- "Crime in San Mateo County in 2001, US Bureau of Justice Statistics". Retrieved September 27, 2006.
- Fields, Gary; Emshwiller, John R. (July 23, 2011). "Many Failed Efforts to Count Nation's Federal Criminal Laws". The Wall Street Journal.
- Baker, John S. (June 16, 2008), Revisiting the Explosive Growth of Federal Crimes, The Heritage Foundation
- Fields, Gary; Emshwiller, John R. (July 23, 2011). "As Criminal Laws Proliferate, More Are Ensnared". The Wall Street Journal.
- Neil, Martha (June 14, 2013). "ABA leader calls for streamlining of 'overwhelming' and 'often ineffective' federal criminal law". ABA Journal.
- Savage, David G. (January 1, 1999). "Rehnquist Urges Shorter List of Federal Crimes". Los Angeles Times.
- Weiss, Debra Cassens (July 25, 2011). "Federal Laws Multiply: Jail Time for Misappropriating Smokey Bear Image?". ABA Journal.
- 26 million recorded crimes on average a year in the US. Ruger, Todd (June 14, 2013), "Way Too Many Criminal Laws, Lawyers Tell Congress", Blog of Legal Times, ALM
Further reading
- Patrick Sharkey (2018). Uneasy Peace: The Great Crime Decline, the Renewal of City Life, and the Next War on Violence. ISBN 978-0393609608.
- Webster, DW & Vernick, JS (2013). Reducing Gun Violence in America: Informing Policy with Evidence and Analysis.
External links
| Wikimedia Commons has media related to Crime in the United States. |
- 15 Most Wanted by U.S. Marshals
- The FBI's Ten Most Wanted Fugitives
- Surviving Crime
- Latest Crime Stats Released (FBI)
- DEA Fugitives, Major International Fugitives
- Metropolitan Police Department: Most Wanted
- New York State's 100 Most Wanted Fugitives
- All Most Wanted - official website of the Los Angeles Police Department
- Nationmaster - Worldwide statistics
- Open data on US violent crime
- Top 10 cities in USA with lowest recorded crime rates
- U. S. Crime and Imprisonment Statistics Total and by State from 1960 - Current
Crime in the Americas | ||
|---|---|---|
| ||
| Sovereign states |
| .svg.png) |
| ||