California's 13th congressional district
California's 13th congressional district is a congressional district in the U.S. state of California.
| California's 13th congressional district | |||
|---|---|---|---|
.tif.png) California's 13th congressional district—since January 3, 2013 | |||
| Representative |
| ||
| Median income | $82,237[1] | ||
| Ethnicity | |||
| Cook PVI | D+40[3] | ||
Barbara Lee, a Democrat, has represented this district since January 2013.
Currently, the 13th district consists of the northwestern portion of Alameda County. Cities in the district include Alameda, Albany, Berkeley, Emeryville, Oakland, Piedmont, and San Leandro.[4]
Prior to redistricting by the California Citizens Redistricting Commission of 2011, the 13th district was in southwestern Alameda County, anchored by Hayward and Fremont.
Recent election results from statewide races
| Year | Office | Results |
|---|---|---|
| 1992 | President | Clinton 54.4 - 25.6% |
| Senator | Boxer 58.0 - 31.4% | |
| Senator | Feinstein 66.1 - 26.9% | |
| 1994 | Governor[5] | Brown 51.0 - 44.7% |
| Senator[6] | Feinstein 59.3 - 32.8% | |
| 1996 | President[7] | Clinton 62.3- 27.5% |
| 1998 | Governor[8] | Davis 68.9 - 27.7% |
| Senator[9] | Boxer 63.0 - 33.5% | |
| 2000 | President[10] | Gore 66.4 - 29.6% |
| Senator[11] | Feinstein 66.9 - 27.3% | |
| 2002 | Governor[12] | Davis 62.8 - 26.7% |
| 2003 | Recall[13][14] | No 63.2 - 36.8% |
| Bustamante 46.8 - 31.5% | ||
| 2004 | President[15] | Kerry 70.9 - 28.0% |
| Senator[16] | Boxer 72.8 - 23.2% | |
| 2006 | Governor[17] | Angelides 52.1 - 42.4% |
| Senator[18] | Feinstein 75.0 - 20.0% | |
| 2008 | President[19] | Obama 74.4 - 23.8% |
| 2010 | Governor | Brown 68.7 - 27.4% |
| Senator | Boxer 69.4 - 25.9% | |
| 2012 | President | Obama 87.5 - 9.0% |
| Senator | Feinstein 90.9 - 9.1% | |
| 2014 | Governor | Brown 91.2 - 8.8% |
| 2016 | President | Clinton 87.4 - 6.8% |
| Senator | Harris 80.9 - 19.1% | |
| 2018 | Governor | Newsom 90.2 - 9.8% |
| Senator | Feinstein 58.9 - 41.1% |
List of members representing the district
| Member | Party | Dates | Cong ress(es) |
Electoral history | Counties |
|---|---|---|---|---|---|
| District created | March 4, 1933 | ||||
.jpg) Charles Kramer |
Democratic | March 4, 1933 – January 3, 1943 |
73rd 74th 75th 76th 77th |
[data unknown/missing] Lost re-election. |
1993–1943 [data unknown/missing] |
 Norris Poulson |
Republican | January 3, 1943 – January 3, 1945 |
78th | [data unknown/missing] Lost re-election. |
1943–1953 [data unknown/missing] |
 Ned R. Healy |
Democratic | January 3, 1945 – January 3, 1947 |
79th | [data unknown/missing] Lost re-election. | |
Norris Poulson |
Republican | January 3, 1947 – January 3, 1953 |
80th 81st 82nd |
[data unknown/missing] Redistricted to the 24th district. | |
.jpg) Ernest K. Bramblett |
Republican | January 3, 1953 – January 3, 1955 |
83rd | Redistricted from the 11th district. Retired. |
1953–1963 Monterey, San Luis Obispo, Santa Barbara, Ventura |
 Charles M. Teague |
Republican | January 3, 1955 – January 1, 1974 |
84th 85th 86th 87th 88th 89th 90th 91st 92nd 93rd |
[data unknown/missing] Died. | |
| 1963–1967 Santa Barbara, Ventura | |||||
| 1967–1973 Southwestern Los Angeles, Santa Barbara, Ventura | |||||
| 1973–1975 Most of Santa Barbara and Ventura | |||||
| Vacant | January 1, 1974 – March 5, 1974 | ||||
 Robert J. Lagomarsino |
Republican | March 5, 1974 – January 3, 1975 |
93rd | Elected to finish Teague's term. Redistricted to the 19th district. | |
 Norman Mineta |
Democratic | January 3, 1975 – January 3, 1993 |
94th 95th 96th 97th 98th 99th 100th 101st 102nd |
[data unknown/missing] Redistricted to the 15th district. |
1975–1983 Santa Clara |
| 1983–1993 Santa Clara (western San Jose) | |||||
 Pete Stark |
Democratic | January 3, 1993 – January 3, 2013 |
103rd 104th 105th 106th 107th 108th 109th 110th 111th 112th |
Redistricted from the 9th district. Redistricted to the 15th district and lost re-election. |
1993–2003 Western Alameda, small part of northern Santa Clara |
| 2003–2013 Southwestern Alameda 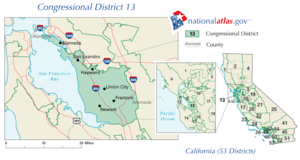 | |||||
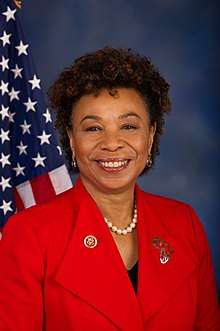 Barbara Lee |
Democratic | January 3, 2013 – present |
113th 114th 115th 116th |
Redistricted from the 9th district and re-elected in 2012. | 2013–present Northern Alameda .tif.png) |
Election results
|
1932 • 1934 • 1936 • 1938 • 1940 • 1942 • 1944 • 1946 • 1948 • 1950 • 1952 • 1954 • 1956 • 1958 • 1960 • 1962 • 1964 • 1966 • 1968 • 1970 • 1972 • 1974 (Special) • 1974 • 1976 • 1978 • 1980 • 1982 • 1984 • 1986 • 1988 • 1990 • 1992 • 1994 • 1996 • 1998 • 2000 • 2002 • 2004 • 2006 • 2008 • 2010 • 2012 • 2014 • 2016 • 2018 |
1932
| Party | Candidate | Votes | % | ||
|---|---|---|---|---|---|
| Democratic | Charles Kramer | 65,261 | 52.7 | ||
| Republican | Charles H. Randall | 53,449 | 43.1 | ||
| Liberty | George D. Higgins | 5,237 | 4.2 | ||
| Total votes | 123,947 | 100.0 | |||
| Turnout | |||||
| Democratic win (new seat) | |||||
1934
| Party | Candidate | Votes | % | |
|---|---|---|---|---|
| Democratic | Charles Kramer (Incumbent) | 83,384 | 62.5 | |
| Republican | Thomas K. Case | 27,993 | 21.0 | |
| Prohibition | Charles H. Randall | 18,760 | 14.1 | |
| Socialist | Michael S. Kerrigan | 2,113 | 1.6 | |
| Communist | John J. Graham | 1,268 | 0.9 | |
| Total votes | 133,518 | 100.0 | ||
| Turnout | ||||
| Democratic hold | ||||
1936
| Party | Candidate | Votes | % | |
|---|---|---|---|---|
| Democratic | Charles Kramer (Incumbent) | 119,251 | 90.0 | |
| No party | Floyd Seaman (write-in) | 6,946 | 5.2 | |
| Communist | Emma Cutler | 6,362 | 4.8 | |
| Total votes | 132,559 | 100.0 | ||
| Turnout | ||||
| Democratic hold | ||||
1938
| Party | Candidate | Votes | % | |
|---|---|---|---|---|
| Democratic | Charles Kramer (Incumbent) | 96,258 | 65.9 | |
| Republican | K. L. Stockton | 44,808 | 30.7 | |
| Communist | Louis Baron | 5,104 | 3.4 | |
| Total votes | 146,170 | 100.0 | ||
| Turnout | ||||
| Democratic hold | ||||
1940
| Party | Candidate | Votes | % | |
|---|---|---|---|---|
| Democratic | Charles Kramer (Incumbent) | 127,167 | 75.7 | |
| Prohibition | Charles H. Randall | 36,406 | 21.7 | |
| Communist | Celeste Strack | 4,434 | 2.6 | |
| Total votes | 168,007 | 100.0 | ||
| Turnout | ||||
| Democratic hold | ||||
1942
| Party | Candidate | Votes | % | |||
|---|---|---|---|---|---|---|
| Republican | Norris Poulson | 38,577 | 49.5 | |||
| Democratic | Charles Kramer (Incumbent) | 33,060 | 42.4 | |||
| Townsend | Calvert S. Wilson | 6,306 | 8.1 | |||
| Total votes | 77,943 | 100.0 | ||||
| Turnout | ||||||
| Republican gain from Democratic | ||||||
1944
| Party | Candidate | Votes | % | |||
|---|---|---|---|---|---|---|
| Democratic | Ned R. Healy | 66,854 | 55 | |||
| Republican | Norris Poulson (Incumbent) | 54,792 | 45 | |||
| Total votes | 121,646 | 100 | ||||
| Turnout | ||||||
| Democratic gain from Republican | ||||||
1946
| Party | Candidate | Votes | % | |||
|---|---|---|---|---|---|---|
| Republican | Norris Poulson | 48,071 | 51.8 | |||
| Democratic | Ned R. Healy (Incumbent) | 44,712 | 48.2 | |||
| Total votes | 92,783 | 100.0 | ||||
| Turnout | ||||||
| Republican gain from Democratic | ||||||
1948
| Party | Candidate | Votes | % | |
|---|---|---|---|---|
| Republican | Norris Poulson (Incumbent) | 62,951 | 52.6 | |
| Democratic | Ned R. Healy | 56,624 | 47.4 | |
| Total votes | 119,575 | 100.0 | ||
| Turnout | ||||
| Republican hold | ||||
1950
| Party | Candidate | Votes | % | |
|---|---|---|---|---|
| Republican | Norris Poulson (Incumbent) | 83,296 | 84.9 | |
| Progressive | Ellen P. Davidson | 14,789 | 15.1 | |
| Total votes | 98,085 | 100.0 | ||
| Turnout | ||||
| Republican hold | ||||
1952
| Party | Candidate | Votes | % | |
|---|---|---|---|---|
| Republican | Ernest K. Bramblett (Incumbent) | 79,496 | 51 | |
| Democratic | Will Hays | 76,516 | 49 | |
| Total votes | 156,012 | 100 | ||
| Turnout | ||||
| Republican hold | ||||
1954
| Party | Candidate | Votes | % | |
|---|---|---|---|---|
| Republican | Charles M. Teague | 69,287 | 52.5 | |
| Democratic | Timothy I. O'Reilly | 62,786 | 47.5 | |
| Total votes | 132,073 | 100.0 | ||
| Turnout | ||||
| Republican hold | ||||
1956
| Party | Candidate | Votes | % | |
|---|---|---|---|---|
| Republican | Charles M. Teague (Incumbent) | 104,009 | 59.6 | |
| Democratic | William Kirk Stewart | 70,567 | 40.4 | |
| Total votes | 174,576 | 100.0 | ||
| Turnout | ||||
| Republican hold | ||||
1958
| Party | Candidate | Votes | % | |
|---|---|---|---|---|
| Republican | Charles M. Teague (Incumbent) | 98,381 | 57 | |
| Democratic | William Kirk Stewart | 74,160 | 43 | |
| Total votes | 172,541 | 100 | ||
| Turnout | ||||
| Republican hold | ||||
1960
| Party | Candidate | Votes | % | |
|---|---|---|---|---|
| Republican | Charles M. Teague (Incumbent) | 146,072 | 65 | |
| Democratic | George J. Holgate | 78,597 | 35 | |
| Total votes | 224,669 | 100 | ||
| Turnout | ||||
| Republican hold | ||||
1962
| Party | Candidate | Votes | % | |
|---|---|---|---|---|
| Republican | Charles M. Teague (Incumbent) | 84,743 | 64.9 | |
| Democratic | George J. Holgate | 45,746 | 35.1 | |
| Total votes | 130,489 | 100.0 | ||
| Turnout | ||||
| Republican hold | ||||
1964
| Party | Candidate | Votes | % | |
|---|---|---|---|---|
| Republican | Charles M. Teague (Incumbent) | 104,744 | 57.4 | |
| Democratic | George E. Taylor | 77,763 | 42.6 | |
| Total votes | 182,507 | 100.0 | ||
| Turnout | ||||
| Republican hold | ||||
1966
| Party | Candidate | Votes | % | |
|---|---|---|---|---|
| Republican | Charles M. Teague (Incumbent) | 116,701 | 67.5 | |
| Democratic | Charles A. Storke | 56,240 | 32.5 | |
| Total votes | 172,941 | 100.0 | ||
| Turnout | ||||
| Republican hold | ||||
1968
| Party | Candidate | Votes | % | |
|---|---|---|---|---|
| Republican | Charles M. Teague (Incumbent) | 148,357 | 65.9 | |
| Democratic | Stankey K. Sheinbaum | 76,928 | 34.1 | |
| Total votes | 225,285 | 100.0 | ||
| Turnout | ||||
| Republican hold | ||||
1970
| Party | Candidate | Votes | % | |
|---|---|---|---|---|
| Republican | Charles M. Teague (Incumbent) | 125,507 | 58.2 | |
| Democratic | Gary Hart | 87,980 | 40.8 | |
| American Independent | Maude I. Jordet | 2,339 | 1.0 | |
| Total votes | 215,826 | 100.0 | ||
| Turnout | ||||
| Republican hold | ||||
1972
| Party | Candidate | Votes | % | |
|---|---|---|---|---|
| Republican | Charles M. Teague (Incumbent) | 153,723 | 73.9 | |
| Democratic | Lester Dean Cleveland | 54,237 | 27.1 | |
| Total votes | 207,960 | 100.0 | ||
| Turnout | ||||
| Republican hold | ||||
1974 (Special)
| Party | Candidate | Votes | % | |
|---|---|---|---|---|
| Republican | Robert J. Lagomarsino | 53.7 | ||
| Democratic | James D. Loebl | 18.8 | ||
| Democratic | James A. Browning Jr. | 7.8 | ||
| Democratic | Roger A. Ikola | 6.3 | ||
| Democratic | E.T. "Tom" Jolicoeur | 6.0 | ||
| Democratic | David H. Miller | 3.2 | ||
| Democratic | R.W. Handley | 2.4 | ||
| Democratic | F. Joe Deauchamp | 1.9 | ||
| Total votes | 100.0 | |||
| Turnout | ||||
| Republican hold | ||||
1974
| Party | Candidate | Votes | % | |||
|---|---|---|---|---|---|---|
| Democratic | Norm Mineta | 78,649 | 52.6 | |||
| Republican | George W. Milias | 63,381 | 42.4 | |||
| Peace and Freedom | Elizabeth Cervantes Barron | 3,846 | 2.6 | |||
| American Independent | Floyd S. Stancliffe | 3,738 | 2.5 | |||
| Total votes | 149,614 | 100.0 | ||||
| Turnout | ||||||
| Democratic gain from Republican | ||||||
1976
| Party | Candidate | Votes | % | |
|---|---|---|---|---|
| Democratic | Norm Mineta (Incumbent) | 135,291 | 66.8 | |
| Republican | Ernie Konnyu | 63,130 | 31.2 | |
| American Independent | William Pollock Herrell | 4,190 | 2.1 | |
| Total votes | 202,611 | 100.0 | ||
| Turnout | ||||
| Democratic hold | ||||
1978
| Party | Candidate | Votes | % | |
|---|---|---|---|---|
| Democratic | Norm Mineta (Incumbent) | 100,809 | 57.5 | |
| Republican | Dan O'Keefe | 69,306 | 39.5 | |
| Peace and Freedom | Robert Goldsborough III | 5,246 | 3.0 | |
| Total votes | 175,361 | 100.0 | ||
| Turnout | ||||
| Democratic hold | ||||
1980
| Party | Candidate | Votes | % | |
|---|---|---|---|---|
| Democratic | Norm Mineta (Incumbent) | 132,246 | 58.9 | |
| Republican | W. E. "Ted" Gagne | 79,766 | 35.5 | |
| Libertarian | Ray Strong | 8,806 | 3.9 | |
| Peace and Freedom | Robert Goldsborough | 3,791 | 1.7 | |
| Total votes | 224,609 | 100.0 | ||
| Turnout | ||||
| Democratic hold | ||||
1982
| Party | Candidate | Votes | % | |
|---|---|---|---|---|
| Democratic | Norm Mineta (Incumbent) | 110,805 | 65.9 | |
| Republican | Tom Kelly | 52,806 | 31.4 | |
| Libertarian | Al Hinkle | 4,553 | 2.7 | |
| Total votes | 168,164 | 100.0 | ||
| Turnout | ||||
| Democratic hold | ||||
1984
| Party | Candidate | Votes | % | |
|---|---|---|---|---|
| Democratic | Norm Mineta (Incumbent) | 139,851 | 65.2 | |
| Republican | John D. "Jack" Williams | 70,666 | 33.0 | |
| Libertarian | John R. Redding | 3,836 | 1.8 | |
| Total votes | 214,353 | 100.0 | ||
| Turnout | ||||
| Democratic hold | ||||
1986
| Party | Candidate | Votes | % | |
|---|---|---|---|---|
| Democratic | Norm Mineta (Incumbent) | 107,696 | 69.7 | |
| Republican | Bob Nash | 46,754 | 30.3 | |
| Total votes | 154,450 | 100.0 | ||
| Turnout | ||||
| Democratic hold | ||||
1988
| Party | Candidate | Votes | % | |
|---|---|---|---|---|
| Democratic | Norm Mineta (Incumbent) | 143,980 | 67.1 | |
| Republican | Luke Somner | 63,959 | 29.8 | |
| Libertarian | John H. Webster | 6,583 | 3.1 | |
| Total votes | 214,522 | 100.0 | ||
| Turnout | ||||
| Democratic hold | ||||
1990
| Party | Candidate | Votes | % | |
|---|---|---|---|---|
| Democratic | Norm Mineta (Incumbent) | 97,286 | 58.0 | |
| Republican | David E. Smith | 59,773 | 35.7 | |
| Libertarian | John H. Webster | 10,587 | 6.3 | |
| Total votes | 167,646 | 100.0 | ||
| Turnout | ||||
| Democratic hold | ||||
1992
| Party | Candidate | Votes | % | |
|---|---|---|---|---|
| Democratic | Pete Stark (Incumbent) | 123,795 | 60.2 | |
| Republican | Verne W. Teyler | 64,953 | 31.6 | |
| Peace and Freedom | Roslyn A. Allen | 16,768 | 8.2 | |
| Total votes | 205,516 | 100.0 | ||
| Turnout | ||||
| Democratic hold | ||||
1994
| Party | Candidate | Votes | % | |
|---|---|---|---|---|
| Democratic | Pete Stark (Incumbent) | 97,344 | 64.62 | |
| Republican | Larry Molton | 45,555 | 30.24 | |
| Libertarian | Robert "Bob" Gough | 7,743 | 5.14 | |
| Total votes | 150,642 | 100.00 | ||
| Turnout | ||||
| Democratic hold | ||||
1996
| Party | Candidate | Votes | % | |
|---|---|---|---|---|
| Democratic | Pete Stark (Incumbent) | 114,408 | 65.2 | |
| Republican | James Fay | 53,385 | 30.4 | |
| Libertarian | Terry Savage | 7,746 | 4.4 | |
| Total votes | 176,539 | 100.0 | ||
| Turnout | ||||
| Democratic hold | ||||
1998
| Party | Candidate | Votes | % | |
|---|---|---|---|---|
| Democratic | Pete Stark (Incumbent) | 101,671 | 71.20 | |
| Republican | James R. Goetz | 38,050 | 26.65 | |
| Natural Law | Karnig Beylikjian | 3,066 | 4.4 | |
| Total votes | 142,787 | 100.0 | ||
| Turnout | ||||
| Democratic hold | ||||
2000
| Party | Candidate | Votes | % | |
|---|---|---|---|---|
| Democratic | Pete Stark (Incumbent) | 129,012 | 70.5 | |
| Republican | James R. "Jim" Goetz | 44,499 | 24.3 | |
| Libertarian | Howard Mora | 4,623 | 2.6 | |
| Natural Law | Timothy R. Hoehner | 2,647 | 1.4 | |
| American Independent | Don J. Grundmann | 2,365 | 1.2 | |
| Total votes | 183,146 | 100.0 | ||
| Turnout | ||||
| Democratic hold | ||||
2002
| Party | Candidate | Votes | % | |
|---|---|---|---|---|
| Democratic | Pete Stark (Incumbent) | 86,495 | 71.1 | |
| Republican | Syed R. Mahmoud | 26,852 | 22.1 | |
| Libertarian | Mark R. Stroberg | 3,703 | 3.1 | |
| American Independent | Don J. Grundmann | 2,772 | 2.2 | |
| Reform | John J. Bambey | 1,901 | 1.5 | |
| Total votes | 121,723 | 100.0 | ||
| Turnout | ||||
| Democratic hold | ||||
2004
| Party | Candidate | Votes | % | |
|---|---|---|---|---|
| Democratic | Pete Stark (Incumbent) | 144,605 | 71.7 | |
| Republican | George I. Bruno | 48,439 | 28.2 | |
| Libertarian | Mark R. Stroberg | 8,877 | 4.3 | |
| Total votes | 201,921 | 100.0 | ||
| Turnout | ||||
| Democratic hold | ||||
2006
| Party | Candidate | Votes | % | |
|---|---|---|---|---|
| Democratic | Pete Stark (Incumbent) | 144,409 | 74.9 | |
| Republican | George I. Bruno | 27,141 | 25.1 | |
| Total votes | 171,500 | 100.0 | ||
| Turnout | ||||
| Democratic hold | ||||
2008
| Party | Candidate | Votes | % | |
|---|---|---|---|---|
| Democratic | Pete Stark (Incumbent) | 166,829 | 76.5 | |
| Republican | Raymond Chui | 51,447 | 23.5 | |
| Total votes | 218,276 | 100.0 | ||
| Turnout | ||||
| Democratic hold | ||||
2010
| Party | Candidate | Votes | % | |
|---|---|---|---|---|
| Democratic | Pete Stark (Incumbent) | 118,278 | 72.19 | |
| Republican | Forest Baker | 45,545 | 27.81 | |
| Democratic hold | ||||
2012
| Party | Candidate | Votes | % | |
|---|---|---|---|---|
| Democratic | Barbara Lee (Incumbent) | 250,436 | 87% | |
| No party preference | Marilyn M. Singleton | 38,146 | 13% | |
| Total votes | 288,582 | 100.0% | ||
| Democratic hold | ||||
2014
| Party | Candidate | Votes | % | |
|---|---|---|---|---|
| Democratic | Barbara Lee (Incumbent) | 168,491 | 89% | |
| Republican | Dakin Sundeen | 21,940 | 11% | |
| Total votes | 190,431 | 100.0% | ||
| Democratic hold | ||||
2016
| Party | Candidate | Votes | % | |
|---|---|---|---|---|
| Democratic | Barbara Lee (Incumbent) | 293,117 | 91% | |
| Republican | Sue Caro | 29,754 | 9% | |
| Total votes | 322,871 | 100.0% | ||
| Democratic hold | ||||
2018
| Party | Candidate | Votes | % | |
|---|---|---|---|---|
| Democratic | Barbara Lee (Incumbent) | 260,580 | 88% | |
| Green | Laura Wells | 34,257 | 11% | |
| Total votes | 294,837 | 100.0% | ||
| Democratic hold | ||||
References
- "My Congressional District".
- "Citizens Redistricting Commission Final Report, 2011" (PDF).
- "Partisan Voting Index – Districts of the 115th Congress" (PDF). The Cook Political Report. April 7, 2017. Retrieved April 7, 2017.
- "Maps: Final Congressional Districts". Citizens Redistricting Commission. Archived from the original on March 10, 2013. Retrieved February 25, 2013.
- https://elections.cdn.sos.ca.gov/sov/1994-general/ssov/governor-congress-district.pdf
- https://elections.cdn.sos.ca.gov/sov/1994-general/ssov/us-senate-congress-district.pdf
- https://elections.cdn.sos.ca.gov/sov/1996-general/ssov/president-congress-district.pdf
- "Wayback Machine" (PDF). September 29, 2011. Archived from the original (PDF) on September 29, 2011.
- "Wayback Machine" (PDF). September 29, 2011. Archived from the original (PDF) on September 29, 2011.
- "Statement of Vote (2000 President)" (PDF). Archived from the original (PDF) on June 11, 2007. Retrieved September 17, 2008.
- "Statement of Vote (2000 Senator)" (PDF). Archived from the original (PDF) on June 11, 2007. Retrieved September 17, 2008.
- "Statement of Vote (2002 Governor)" (PDF). Archived from the original (PDF) on November 11, 2010.
- "Statement of Vote (2003 Recall Question)" (PDF). Archived from the original (PDF) on May 20, 2011. Retrieved October 8, 2007.
- "Statement of Vote (2003 Governor)" (PDF). Archived from the original (PDF) on May 20, 2011. Retrieved October 8, 2007.
- "Statement of Vote (2004 President)" (PDF). Archived from the original (PDF) on August 1, 2010. Retrieved August 8, 2007.
- "Statement of Vote (2004 Senator)" (PDF). Archived from the original (PDF) on August 10, 2011.
- "Statement of Vote (2006 Governor)" (PDF). Archived from the original (PDF) on August 10, 2011.
- "Statement of Vote (2006 Senator)" (PDF). Archived from the original (PDF) on August 10, 2011.
- "(2008 President)". Archived from the original on February 11, 2009. Retrieved March 5, 2009.
- "1932 election results" (PDF).
- "1934 election results" (PDF).
- "1936 election results" (PDF).
- "1938 election results" (PDF).
- "1940 election results" (PDF).
- "1942 election results" (PDF).
- "1944 election results" (PDF).
- "1946 election results" (PDF).
- "1948 election results" (PDF).
- "1950 election results" (PDF).
- "1952 election results" (PDF).
- "1954 election results" (PDF).
- "1956 election results" (PDF).
- "1958 election results" (PDF).
- "1960 election results" (PDF).
- "1962 election results" (PDF).
- "1964 election results" (PDF).
- "1966 election results" (PDF).
- "1968 election results" (PDF).
- "1970 election results" (PDF).
- "1972 election results" (PDF).
- "JoinCalifornia - 03-05-1974 Election". www.joincalifornia.com.
- "1974 election results" (PDF).
- "1976 election results" (PDF).
- "1978 election results" (PDF).
- "1980 election results" (PDF).
- "1982 election results" (PDF).
- "1984 election results" (PDF).
- "1986 election results" (PDF).
- "1988 election results" (PDF).
- "1990 election results" (PDF).
- "1992 election results" (PDF).
- "1994 election results" (PDF).
- "1996 election results" (PDF).
- "1998 election results" (PDF).
- "2000 election results" (PDF).
- "2002 general election results" (PDF). Archived from the original (PDF) on February 3, 2009.
- "2004 general election results" (PDF). Archived from the original (PDF) on August 21, 2008.
- "2006 general election results" (PDF). Archived from the original (PDF) on November 27, 2008.
- "2008 general election results" (PDF). Archived from the original (PDF) on October 18, 2012. Retrieved January 5, 2009.
- "2010 general election results" (PDF). Archived from the original (PDF) on June 11, 2014. Retrieved March 24, 2011.
- "2012 general election results" (PDF). Archived from the original (PDF) on October 19, 2013.
External links
- GovTrack.us: California's 13th congressional district
- RAND California Election Returns: District Definitions (out of date)
- California Voter Foundation map - CD13 (out of date)