2019 Exeter City Council election
The 2019 Exeter City Council election took place on 2 May 2019 to of the members of Exeter City Council in Devon, England. This was on the same day as other local elections. 14 of the 39 seats were up for re-election: those of the candidates who had finished second in the all-out election of 2016, with a double vacancy in Priory ward. The Labour Party remained in control with 29 seats, with the Conservatives as the main opposition party, with 6 seats.[1]
| |||||||||||||||||||||||||||||||||||||||||||||||
All 39 seats to Exeter City Council 20 seats needed for a majority | |||||||||||||||||||||||||||||||||||||||||||||||
|---|---|---|---|---|---|---|---|---|---|---|---|---|---|---|---|---|---|---|---|---|---|---|---|---|---|---|---|---|---|---|---|---|---|---|---|---|---|---|---|---|---|---|---|---|---|---|---|
| |||||||||||||||||||||||||||||||||||||||||||||||
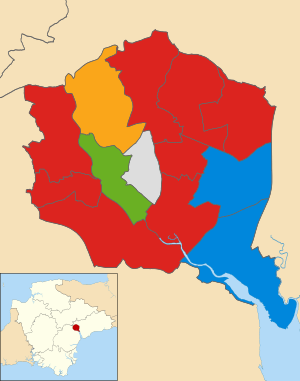 Map showing the results the 2019 Exeter City Council elections by ward. Red shows Labour seats, blue shows the Conservatives, yellow shows the Liberal Democrats, green shows the Green Party and silver shows and Independent. | |||||||||||||||||||||||||||||||||||||||||||||||
Council composition
Before this election, the composition of the council was:
| 29 | 8 | 1 | 1 |
| Labour | Conservative | LD | G |
After this election, the composition of the council was:
| 29 | 6 | 2 | 1 | 1 |
| Labour | Conservative | LD | G | Ind |
Election summary
| Exeter City Council Election Result 2019[2] | |||||||||||||||
|---|---|---|---|---|---|---|---|---|---|---|---|---|---|---|---|
| Party | Candidates | Votes | |||||||||||||
| Stood | Elected | Gained | Unseated | Net | % of total | % | No. | Net % | |||||||
| Labour | 14 | 9 | 1 | 2 | 64.2 | 36.1 | 11,979 | -11.1% | |||||||
| Conservative | 14 | 2 | 0 | 2 | 14.2 | 26.4 | 8,713 | -6.1% | |||||||
| Green | 13 | 1 | 1 | 0 | 7.1 | 17.8 | 5,873 | +7.3% | |||||||
| Liberal Democrats | 13 | 1 | 1 | 0 | 7.1 | 11.6 | 2,776 | -2.1% | |||||||
| UKIP | 7 | 0 | 0 | 0 | 0.0 | 5.3 | 1,768 | +5.3% | |||||||
| Independent | 2 | 1 | 1 | 0 | 7.1 | 4.5 | 1,486 | +4.5% | |||||||
| For Britain | 1 | 0 | 0 | 0 | 0.0 | 0.3 | 113 | +0.3% | |||||||
| Women's Equality | 1 | 0 | 0 | 0 | 0.0 | 0.2 | 66 | -0.03% | |||||||
| Total | 64 | 14 | 4 | 4 | 100% | 100% | 32,883 | ||||||||
Results by ward
(*) Asterisk denotes the sitting councillor.
Alphington
| Party | Candidate | Votes | % | |
|---|---|---|---|---|
| Labour | Yvonne Margaret Atkinson | 901 | 37.2% | |
| Conservative | Katherine New | 711 | 29.3% | |
| Green | Andrew Bell | 396 | 16.3% | |
| UKIP | Dutch Dudgeon | 222 | 9.2% | |
| Liberal Democrats | Rod Ruffle | 202 | 8.3% | |
| Majority | 190 | 7.8% | ||
| Turnout | 2,453 | 37.51% | ||
| Labour gain from Green | ||||
Note: The outgoing councillor Chris Musgrave was elected as Labour in 2016, but defected to the Green Party in February 2017.[4]
Duryard & St.James
| Party | Candidate | Votes | % | |
|---|---|---|---|---|
| Liberal Democrats | Michael Norman Mitchell | 803 | 33.9% | |
| Conservative | Percy Prowse* | 609 | 25.7% | |
| Labour | Charlie Davies | 602 | 25.4% | |
| Green | Jonathan Dawson | 292 | 12.3% | |
| Women's Equality | Bea Gare | 66 | 2.8% | |
| Majority | 194 | 8.2% | ||
| Turnout | 2,383 | 34.77% | ||
| Liberal Democrats gain from Conservative | ||||
Exwick
| Party | Candidate | Votes | % | |
|---|---|---|---|---|
| Labour | Ollie Pearson* | 1,034 | 44.5% | |
| Conservative | Kayleigh Michelle Suzanne Luscombe | 576 | 24.8% | |
| Green | Mark Shorto | 345 | 14.8% | |
| UKIP | Lawrence Simon Harper | 298 | 12.8% | |
| Liberal Democrats | Joel Nicholas Punwani | 73 | 3.1% | |
| Majority | 458 | 19.7% | ||
| Turnout | 2,339 | 31.67% | ||
| Labour hold | ||||
Heavitree
| Party | Candidate | Votes | % | |
|---|---|---|---|---|
| Labour | Chris Buswell | 1,170 | 42.7% | |
| Green | Gillian Clare Baker | 746 | 27.2% | |
| Conservative | Robert Anthony Jones | 577 | 21.1% | |
| Liberal Democrats | Stephen Michael Gates | 246 | 9.0% | |
| Majority | 424 | 15.5% | ||
| Turnout | 2,782 | 39.99% | ||
| Labour hold | ||||
Mincinglake & Whipton
| Party | Candidate | Votes | % | |
|---|---|---|---|---|
| Labour | Ruth Travis Williams | 944 | 48.1% | |
| UKIP | Brian Jeffery | 339 | 17.3% | |
| Conservative | Harry Charles Burton | 316 | 16.1% | |
| Green | David Barker-Hahlo | 248 | 12.6% | |
| Liberal Democrats | Andrew Matthew Soper | 116 | 5.9% | |
| Majority | 605 | 30.8% | ||
| Turnout | 1,975 | 29.54% | ||
| Labour hold | ||||
Newtown & St.Leonards
| Party | Candidate | Votes | % | |
|---|---|---|---|---|
| Independent | Jemima Moondaisy Moore | 1,359 | 48.6% | |
| Labour | Carol Whitton | 1,092 | 39.1% | |
| Conservative | Jago Barnabas York Brockway | 342 | 12.2% | |
| Majority | 267 | 9.6% | ||
| Turnout | 2,813 | 39.05% | ||
| Independent gain from Labour | ||||
Pennsylvania
| Party | Candidate | Votes | % | |
|---|---|---|---|---|
| Labour | Ian Quance | 1,109 | 39.0% | |
| Conservative | David Smith | 889 | 31.3% | |
| Green | Lizzie Woodman | 683 | 24.0% | |
| Liberal Democrats | Ian Robert Bristow | 163 | 5.7% | |
| Majority | 220 | 7.7% | ||
| Turnout | 2,867 | 37.20% | ||
| Labour hold | ||||
Pinhoe
| Party | Candidate | Votes | % | |
|---|---|---|---|---|
| Labour | Trish Oliver | 928 | 38.4% | |
| Conservative | Cynthia Thompson* | 913 | 37.8% | |
| UKIP | Robert Ball | 262 | 10.8% | |
| Green | Frank Williamson | 226 | 9.4% | |
| Liberal Democrats | Felix Brett | 86 | 3.6% | |
| Majority | 15 | 0.6% | ||
| Turnout | 2,435 | 38.27% | ||
| Labour gain from Conservative | ||||
Priory (2 seats)
| Party | Candidate | Votes | % | |
|---|---|---|---|---|
| Labour | Amal Ghusain | 895 | ||
| Labour | Alys Amelia Quance | 850 | ||
| Conservative | John Benedict Harvey | 631 | ||
| Conservative | Keith Andrew Sparkes | 597 | ||
| Green | Lynn Wetenhall | 362 | ||
| UKIP | Diana Beasley | 359 | ||
| Green | Mary Roddick | 359 | ||
| UKIP | Sheridan Robert James | 316 | ||
| Liberal Democrats | Christine Campion | 232 | ||
| Liberal Democrats | Ramus Jakob Lindgren | 109 | ||
| Turnout | 2,412 | 36.82% | ||
| Labour hold | ||||
| Labour hold | ||||
St Davids
| Party | Candidate | Votes | % | |
|---|---|---|---|---|
| Green | Diana Frances Moore | 1,455 | 54.9% | |
| Labour | Lesley Sara Robson | 796 | 30.1% | |
| Conservative | Aric Samuel David Gilinsky | 270 | 10.2% | |
| Liberal Democrats | Charles Cole | 126 | 4.8% | |
| Majority | 659 | 24.9% | ||
| Turnout | 2,667 | 35.61% | ||
| Green gain from Labour | ||||
St Loyes
| Party | Candidate | Votes | % | |
|---|---|---|---|---|
| Conservative | Yolonda Anna Cullis Henson | 1,140 | 47.6% | |
| Labour | George Lawrence Ford | 550 | 23.0% | |
| UKIP | Alison Sheridan | 288 | 12.0% | |
| Liberal Democrats | Thomas Jacob Deakin | 206 | 8.6% | |
| Green | Christo Skelton | 206 | 8.6% | |
| Majority | 590 | 24.7% | ||
| Turnout | 2402 | 34.32% | ||
| Conservative hold | ||||
St Thomas
| Party | Candidate | Votes | % | |
|---|---|---|---|---|
| Labour | Hannah Louise Packham* | 1,082 | 41.0% | |
| Conservative | Ashley Christopher Carr | 484 | 18.4% | |
| Green | Joe Levy | 447 | 17.0% | |
| Liberal Democrats | Adrian Alan Fullam | 383 | 14.5% | |
| Independent | Paul David Mouland | 127 | 4.8% | |
| For Britain | Frankie Rufolo | 113 | 4.3% | |
| Majority | 598 | 22.7% | ||
| Turnout | 2,658 | 35.36% | ||
| Labour hold | ||||
Topsham
| Party | Candidate | Votes | % | |
|---|---|---|---|---|
| Conservative | Rob Newby | 1,255 | 47.3% | |
| Labour | Eliot Paul Wright | 794 | 29.9% | |
| Green | Melanie Frances Shaw | 467 | 17.6% | |
| Liberal Democrats | Aaron Benjamin Nolan | 140 | 5.3% | |
| Majority | 461 | 17.4% | ||
| Turnout | 2,697 | 37.97% | ||
| Conservative hold | ||||
References
- Exeter Council [@ExeterCouncil] (3 May 2019). "The new political makeup of the council is: Labour - 29 Conservatives - 6 Liberal Democrats - 2 Green Party - 1 Independant [sic] - 1" (Tweet) – via Twitter.
- "Election Results".
- "2019 Local Election Results". Exeter City Council. 2 May 2019.
- "Labour councillor joins Exeter Greens". www.greenparty.org.uk. 28 February 2017.
External links
This article is issued from Wikipedia. The text is licensed under Creative Commons - Attribution - Sharealike. Additional terms may apply for the media files.