2007 North Devon District Council election
The 2007 North Devon District Council election took place on 3 May 2007 to elect members of North Devon District Council in Devon, England. The whole council was up for election and the Conservative party gained overall control of the council from the Liberal Democrats.[1]
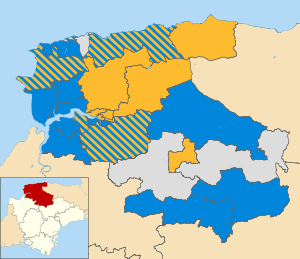
Map of the results of the 2007 North Devon council election. Conservatives in blue, Liberal Democrats in yellow and independent in grey.
Election result
The results saw the Conservatives gain 12 seats to take control of the council from the Liberal Democrats with 22 councillors.[2] These gains came at the expense of the Liberal Democrats who were down 5 to 17 seats and the independents who fell 7 to have 4 seats.[2] Overall turnout in the election was 40.25%.[3]
| Party | Seats | Gains | Losses | Net gain/loss | Seats % | Votes % | Votes | +/− | |
|---|---|---|---|---|---|---|---|---|---|
| Conservative | 22 | 12 | 0 | +12 | 51.2 | 39.8 | 17,737 | +8.7% | |
| Liberal Democrats | 17 | 2 | 7 | -5 | 39.5 | 42.8 | 19,101 | +0.9% | |
| Independent | 4 | 0 | 7 | -7 | 9.3 | 7.5 | 3,360 | -17.1% | |
| Green | 0 | 0 | 0 | 0 | 0 | 9.3 | 4,152 | +8.6% | |
| Labour | 0 | 0 | 0 | 0 | 0 | 0.2 | 109 | +0.2% | |
| Communist | 0 | 0 | 0 | 0 | 0 | 0.2 | 96 | +0.2% | |
| BNP | 0 | 0 | 0 | 0 | 0 | 0.1 | 63 | -0.2% | |
1 Conservative and 1 Liberal Democrat candidates were unopposed.[3]
Ward results
| Party | Candidate | Votes | % | ± | |
|---|---|---|---|---|---|
| Conservative | Rodney Cann | 792 | |||
| Liberal Democrats | Carol McCormack-Hole | 540 | |||
| Green | Linda Mack | 343 | |||
| Turnout | 1,675 | 34.9 | -0.1 | ||
| Conservative hold | Swing | ||||
| Liberal Democrats hold | Swing | ||||
| Party | Candidate | Votes | % | ± | |
|---|---|---|---|---|---|
| Independent | Eric Ley | 728 | 84.2 | +6.5 | |
| Green | John Hextall | 137 | 15.8 | +15.8 | |
| Majority | 591 | 68.3 | +12.8 | ||
| Turnout | 865 | 52.1 | -17.2 | ||
| Independent hold | Swing | ||||
| Party | Candidate | Votes | % | ± | |
|---|---|---|---|---|---|
| Liberal Democrats | Malcolm Prowse | 702 | 78.9 | +14.9 | |
| Conservative | Margaret Keene | 188 | 21.1 | -14.9 | |
| Majority | 514 | 57.8 | +29.8 | ||
| Turnout | 890 | 56.6 | -8.9 | ||
| Liberal Democrats hold | Swing | ||||
| Party | Candidate | Votes | % | ± | |
|---|---|---|---|---|---|
| Conservative | Roy Lucas | 653 | |||
| Conservative | Philip Daniel | 531 | |||
| Liberal Democrats | Mark Alexander | 514 | |||
| Liberal Democrats | Nicholas Welch | 469 | |||
| Green | Liz Wood | 220 | |||
| Turnout | 2,387 | 40.6 | -4.0 | ||
| Conservative hold | Swing | ||||
| Conservative hold | Swing | ||||
| Party | Candidate | Votes | % | ± | |
|---|---|---|---|---|---|
| Conservative | Caroline Chugg | 808 | |||
| Conservative | Jasmine Chesters | 732 | |||
| Liberal Democrats | Marquerite Shapland | 493 | |||
| Liberal Democrats | John Hoult | 462 | |||
| Labour | Danny Neary | 109 | |||
| Turnout | 2,604 | 43.4 | -0.7 | ||
| Conservative gain from Liberal Democrats | Swing | ||||
| Conservative hold | Swing | ||||
| Party | Candidate | Votes | % | ± | |
|---|---|---|---|---|---|
| Liberal Democrats | Faye Webber | 658 | |||
| Liberal Democrats | John Wilsher | 584 | |||
| Conservative | Simon Harvey | 446 | |||
| Conservative | Debbie Lewis | 267 | |||
| Green | Simon Clift | 186 | |||
| Green | Martin Hewlett | 179 | |||
| Turnout | 2,320 | 33.5 | +2.2 | ||
| Liberal Democrats hold | Swing | ||||
| Liberal Democrats hold | Swing | ||||
| Party | Candidate | Votes | % | ± | |
|---|---|---|---|---|---|
| Independent | Albert Cook | 578 | 72.3 | ||
| Liberal Democrats | Marek Donaldson | 222 | 27.8 | ||
| Majority | 356 | 44.5 | |||
| Turnout | 800 | 43.7 | |||
| Independent hold | Swing | ||||
| Party | Candidate | Votes | % | ± | |
|---|---|---|---|---|---|
| Conservative | Susan Croft | 433 | 48.5 | +4.5 | |
| Liberal Democrats | Kevin Butt | 315 | 35.3 | -20.7 | |
| Green | Matthew Knight | 145 | 16.2 | +16.2 | |
| Majority | 118 | 13.2 | |||
| Turnout | 893 | 50.3 | -3.9 | ||
| Conservative gain from Liberal Democrats | Swing | ||||
| Party | Candidate | Votes | % | ± | |
|---|---|---|---|---|---|
| Liberal Democrats | Yvette Gubb | 922 | |||
| Conservative | Susan Sussex | 909 | |||
| Liberal Democrats | Julia Clark | 753 | |||
| Conservative | Arthur Yelton | 534 | |||
| Turnout | 3,118 | 50.9 | -5.6 | ||
| Liberal Democrats hold | Swing | ||||
| Conservative gain from Liberal Democrats | Swing | ||||
| Party | Candidate | Votes | % | ± | |
|---|---|---|---|---|---|
| Liberal Democrats | Sue Haywood | 505 | |||
| Liberal Democrats | Julie Hunt | 427 | |||
| Conservative | Eileen Lyons | 210 | |||
| Green | Robert Cornish | 183 | |||
| Green | Earl Bramley-Howard | 158 | |||
| Turnout | 1,483 | 26.1 | -3.8 | ||
| Liberal Democrats gain from Independent | Swing | ||||
| Liberal Democrats hold | Swing | ||||
| Party | Candidate | Votes | % | ± | |
|---|---|---|---|---|---|
| Conservative | Dick Jones | 563 | |||
| Conservative | John Gill | 537 | |||
| Liberal Democrats | Christopher Pascoe | 383 | |||
| Liberal Democrats | Pauline Batt | 380 | |||
| Independent | Bowser Harris | 335 | |||
| Independent | Charles Piper | 255 | |||
| Green | Stephen Barnes | 123 | |||
| Turnout | 2,576 | 42.9 | +6.0 | ||
| Conservative gain from Independent | Swing | ||||
| Conservative gain from Independent | Swing | ||||
| Party | Candidate | Votes | % | ± | |
|---|---|---|---|---|---|
| Liberal Democrats | Malcolm Wilkinson | 602 | |||
| Conservative | Pat Barker | 464 | |||
| Liberal Democrats | Stuart Maskell | 461 | |||
| Conservative | Eddie Short | 417 | |||
| Green | Michael Harrison | 203 | |||
| Green | Rosemary Brian | 165 | |||
| Turnout | 2,312 | 41.1 | +4.2 | ||
| Liberal Democrats hold | Swing | ||||
| Conservative gain from Liberal Democrats | Swing | ||||
| Party | Candidate | Votes | % | ± | |
|---|---|---|---|---|---|
| Conservative | Andrea Davis | 345 | 71.0 | +17.0 | |
| Liberal Democrats | Rod Hawes | 141 | 29.0 | -17.0 | |
| Majority | 204 | 42.0 | +34.0 | ||
| Turnout | 486 | 32.0 | -1.6 | ||
| Conservative hold | Swing | ||||
| Party | Candidate | Votes | % | ± | |
|---|---|---|---|---|---|
| Independent | Paul Crabb | 594 | |||
| Conservative | Brian Yabsley | 493 | |||
| Liberal Democrats | Wendy Butler | 313 | |||
| Liberal Democrats | Frank Pearson | 313 | |||
| Turnout | 1,713 | 30.3 | -3.7 | ||
| Independent hold | Swing | ||||
| Conservative gain from Independent | Swing | ||||
| Party | Candidate | Votes | % | ± | |
|---|---|---|---|---|---|
| Independent | Mike Edmunds | 386 | 48.3 | +9.9 | |
| Conservative | Paul Crockett | 351 | 43.9 | +11.7 | |
| BNP | Dave Moore | 63 | 7.9 | +7.9 | |
| Majority | 35 | 4.4 | -1.8 | ||
| Turnout | 800 | 42.4 | -3.9 | ||
| Independent hold | Swing | ||||
| Party | Candidate | Votes | % | ± | |
|---|---|---|---|---|---|
| Conservative | Colin Wright | 740 | |||
| Conservative | Robert Darell | 588 | |||
| Liberal Democrats | Geoff Fowler | 525 | |||
| Liberal Democrats | Janice Donovan | 419 | |||
| Turnout | 2,272 | 34.1 | -3.3 | ||
| Conservative gain from Liberal Democrats | Swing | ||||
| Conservative gain from Independent | Swing | ||||
| Party | Candidate | Votes | % | ± | |
|---|---|---|---|---|---|
| Conservative | Brian Moores | 316 | 53.2 | +17.9 | |
| Liberal Democrats | Reginald Cane | 278 | 46.8 | +12.5 | |
| Majority | 38 | 6.4 | +5.4 | ||
| Turnout | 594 | 44.3 | -4.0 | ||
| Conservative hold | Swing | ||||
| Party | Candidate | Votes | % | ± | |
|---|---|---|---|---|---|
| Liberal Democrats | David Butt | 630 | |||
| Conservative | David Luggar | 621 | |||
| Liberal Democrats | Walter White | 603 | |||
| Independent | Cliff Bell | 484 | |||
| Conservative | Robert Street | 424 | |||
| Green | Ian Godfrey | 222 | |||
| Green | Anna Wotton | 162 | |||
| Turnout | 3,146 | 43.9 | |||
| Liberal Democrats hold | Swing | ||||
| Conservative gain from Liberal Democrats | Swing | ||||
| Party | Candidate | Votes | % | ± | |
|---|---|---|---|---|---|
| Conservative | Des Brailey | 895 | |||
| Conservative | Silvia Harrison | 667 | |||
| Liberal Democrats | Andrew Cann | 418 | |||
| Liberal Democrats | Steve Upcott | 310 | |||
| Green | Clive Robins | 209 | |||
| Turnout | 2,499 | 41.1 | -2.2 | ||
| Conservative hold | Swing | ||||
| Conservative gain from Independent | Swing | ||||
| Party | Candidate | Votes | % | ± | |
|---|---|---|---|---|---|
| Liberal Democrats | Suzette Hibbert | unopposed | |||
| Liberal Democrats hold | Swing | ||||
| Party | Candidate | Votes | % | ± | |
|---|---|---|---|---|---|
| Liberal Democrats | Joe Tucker | 416 | 47.5 | -8.1 | |
| Conservative | Jim Pile | 373 | 42.6 | -1.8 | |
| Green | Micky Darling | 87 | 9.9 | +9.9 | |
| Majority | 43 | 4.9 | -6.3 | ||
| Turnout | 876 | 58.0 | +2.7 | ||
| Liberal Democrats hold | Swing | ||||
| Party | Candidate | Votes | % | ± | |
|---|---|---|---|---|---|
| Conservative | Michael Harrison | 623 | |||
| Conservative | John Mathews | 611 | |||
| Liberal Democrats | Frank Edwards | 495 | |||
| Liberal Democrats | Brian Macbeth | 470 | |||
| Green | Ricky Knight | 450 | |||
| Green | Amanda Wycherley | 281 | |||
| Turnout | 2,930 | 43.6 | +7.5 | ||
| Conservative hold | Swing | ||||
| Conservative gain from Liberal Democrats | Swing | ||||
| Party | Candidate | Votes | % | ± | |
|---|---|---|---|---|---|
| Conservative | Richard Edgell | unopposed | |||
| Conservative hold | Swing | ||||
| Party | Candidate | Votes | % | ± | |
|---|---|---|---|---|---|
| Liberal Democrats | Brian Greenslade | 768 | |||
| Liberal Democrats | Mair Manuel | 727 | |||
| Green | L'Anne Knight | 310 | |||
| Conservative | June Pearson | 280 | |||
| Conservative | Robert Tickell | 254 | |||
| Turnout | 2,339 | 39.7 | -1.4 | ||
| Liberal Democrats hold | Swing | ||||
| Liberal Democrats hold | Swing | ||||
| Party | Candidate | Votes | % | ± | |
|---|---|---|---|---|---|
| Liberal Democrats | David Worden | 664 | |||
| Liberal Democrats | Susan Sewell | 612 | |||
| Conservative | Jeremy Yabsley | 532 | |||
| Conservative | Douglas Dowling | 430 | |||
| Green | Jackie Morningmist | 199 | |||
| Turnout | 2,437 | 37.4 | -10.6 | ||
| Liberal Democrats gain from Independent | Swing | ||||
| Liberal Democrats hold | Swing | ||||
| Party | Candidate | Votes | % | ± | |
|---|---|---|---|---|---|
| Conservative | Nancy Lewis | 511 | 58.7 | +6.7 | |
| Liberal Democrats | Kate Palmer | 360 | 41.3 | -6.7 | |
| Majority | 151 | 17.3 | +13.4 | ||
| Turnout | 871 | 48.6 | +4.3 | ||
| Conservative hold | Swing | ||||
| Party | Candidate | Votes | % | ± | |
|---|---|---|---|---|---|
| Liberal Democrats | Chris Haywood | 637 | |||
| Liberal Democrats | Colin Payne | 610 | |||
| Conservative | Kath Chugg | 199 | |||
| Green | Sarah Willoughby | 190 | |||
| Communist | Paul Dyer | 96 | |||
| Turnout | 1,732 | 28.9 | |||
| Liberal Democrats hold | Swing | ||||
| Liberal Democrats hold | Swing | ||||
References
- "North Devon". BBC News Online. Retrieved 31 July 2011.
- "Tories get control of North Devon". BBC News Online. 4 May 2007. Retrieved 2 August 2011.
- "District Elections Thursday May 3rd 2007: District Elections Results". North Devon Council. Archived from the original on 27 September 2011. Retrieved 31 July 2011.
This article is issued from Wikipedia. The text is licensed under Creative Commons - Attribution - Sharealike. Additional terms may apply for the media files.