2018 Exeter City Council election
The 2018 Exeter City Council election took place on 3 May 2018 to elect a third (13/39) of the members of Exeter City Council in England.[1] This was on the same day as other local elections. The election result left the council with the same political make up as it had before the election, with Labour in control with 29 seats and the Conservatives as the main opposition party, returning with 8.
| |||||||||||||||||||||||||||||||||||||||||||||||
All 39 seats to Exeter City Council 20 seats needed for a majority | |||||||||||||||||||||||||||||||||||||||||||||||
|---|---|---|---|---|---|---|---|---|---|---|---|---|---|---|---|---|---|---|---|---|---|---|---|---|---|---|---|---|---|---|---|---|---|---|---|---|---|---|---|---|---|---|---|---|---|---|---|
| |||||||||||||||||||||||||||||||||||||||||||||||
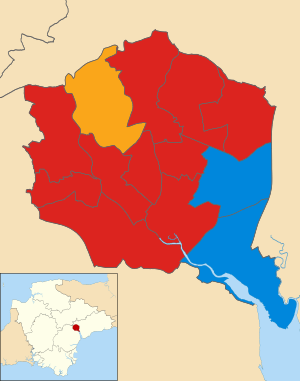 Map showing the results the 2016 Exeter City Council elections by ward. Red shows Labour seats, blue shows the Conservatives, and yellow shows the Liberal Democrats. | |||||||||||||||||||||||||||||||||||||||||||||||
Background
At the previous election in 2016 election, Labour remained in control of the council with 30 councillors out of 39. In February 2017, Labour Councillor Chris Musgrave defected to the Green Party, leaving them with 29 seats going into the election.[2]
Council composition
After the previous election, the composition of the council was:
| 30 | 8 | 1 |
| Labour | Conservative | LD |
Before this election, the composition of the council was:
| 29 | 8 | 1 | 1 |
| Labour | Conservative | LD | G |
After this election, the composition of the council was:
| 29 | 8 | 1 | 1 |
| Labour | Conservative | LD | G |
Results by ward
(*) Asterisk denotes the sitting councillor.
Alphington
| Party | Candidate | Votes | % | ± | |
|---|---|---|---|---|---|
| Labour | Bob Foale* | 1,029 | 42.77 | +3.7 | |
| Conservative | Katherine New | 933 | 38.78 | +2.0 | |
| Green | Andrew Bell | 256 | 10.64 | +0.9 | |
| Liberal Democrats | Rod Ruffle | 188 | 7.81 | -3.9 | |
| Majority | 96 | 3.99% | |||
| Turnout | 2,406 | 36.77% | |||
| Labour hold | Swing | ||||
Duryard & St.James
| Party | Candidate | Votes | % | ± | |
|---|---|---|---|---|---|
| Liberal Democrats | Kevin Mitchell* | 783 | 34.60 | +3.1 | |
| Labour | Charlie Davies | 722 | 31.90 | +2.4 | |
| Conservative | John Harvey | 541 | 23.91 | -0.7 | |
| Green | Bethany Payne | 132 | 5.83 | -6.6 | |
| Women's Equality | Bea Gare | 75 | 3.31 | N/A | |
| Democrats and Veterans | Sallie Waters | 10 | 0.44 | N/A | |
| Majority | 61 | ||||
| Turnout | 2,263 | 33.49 | |||
| Liberal Democrats hold | Swing | ||||
Exwick
| Party | Candidate | Votes | % | ± | |
|---|---|---|---|---|---|
| Labour | Rachel Sutton* | 1,278 | 57.80 | +5.1 | |
| Conservative | Elliott Malik | 593 | 26.82 | +7.2 | |
| Green | Mark Shorto | 200 | 9.05 | -4.0 | |
| Liberal Democrats | Andrew Soper | 140 | 6.33 | -5.0 | |
| Majority | 685 | ||||
| Turnout | 2,211 | 30.18 | |||
| Labour hold | Swing | ||||
Heavitree
| Party | Candidate | Votes | % | ± | |
|---|---|---|---|---|---|
| Labour | Greg Sheldon* | 1,554 | 53.75 | +7.8 | |
| Conservative | Guy Richards | 786 | 27.19 | +6.7 | |
| Green | Gill Baker | 345 | 11.93 | -8.1 | |
| Liberal Democrats | Stephen Gates | 206 | 7.13 | -3.0 | |
| Majority | 768 | ||||
| Turnout | 2,891 | 42.21 | |||
| Labour hold | Swing | ||||
Mincinglake & Whipton
| Party | Candidate | Votes | % | ± | |
|---|---|---|---|---|---|
| Labour | Judy Pattison | 1,203 | 58.45 | +9.1 | |
| Conservative | George Livesey | 603 | 29.30 | +13.8 | |
| Green | Kayleigh Powell | 129 | 6.27 | -2.8 | |
| Liberal Democrats | Matt Smith | 123 | 5.98 | -1.0 | |
| Majority | 600 | ||||
| Turnout | 2,058 | 30.98 | |||
| Labour hold | Swing | ||||
Newtown & St.Leonards
| Party | Candidate | Votes | % | ± | |
|---|---|---|---|---|---|
| Labour | Matthew Vizard* | 1,447 | 56.13 | +8.3 | |
| Conservative | Ian Watt | 628 | 24.36 | -2.5 | |
| Green | Tom Milburn | 267 | 10.36 | -3.3 | |
| Liberal Democrats | Alexandra Newcombe | 236 | 9.15 | +1.1 | |
| Majority | 819 | ||||
| Turnout | 2,578 | 36.08 | |||
| Labour hold | Swing | ||||
Pennsylvania
| Party | Candidate | Votes | % | ± | |
|---|---|---|---|---|---|
| Labour | Jane Begley | 1,435 | 47.95 | +11.8 | |
| Conservative | David Smith | 1,062 | 35.48 | -2.3 | |
| Green | Lizzie Woodman | 324 | 10.83 | -6.2 | |
| Liberal Democrats | Michael Mitchell | 172 | 5.75 | -4.0 | |
| Majority | 373 | ||||
| Turnout | 2,993 | 39.42 | |||
| Labour gain from Conservative | Swing | ||||
Pinhoe
| Party | Candidate | Votes | % | ± | |
|---|---|---|---|---|---|
| Labour | Duncan Wood* | 1,128 | 47.08 | +5.7 | |
| Conservative | Keith Sparkes | 1,057 | 44.12 | +3.8 | |
| Green | Diana Jones | 114 | 4.76 | -4.9 | |
| Liberal Democrats | Charles Cole | 97 | 4.05 | -3.0 | |
| Majority | 71 | ||||
| Turnout | 2,396 | 41.04 | |||
| Labour hold | Swing | ||||
Priory
| Party | Candidate | Votes | % | ± | |
|---|---|---|---|---|---|
| Labour | Tony Wardle* | 1,177 | 52.90 | +5.9 | |
| Conservative | Jago Brockway | 651 | 29.26 | +4.5 | |
| Green | Lynn Wetenhall | 220 | 9.89 | -2.5 | |
| Liberal Democrats | Christine Campion | 177 | 7.96 | -0.9 | |
| Majority | 526 | ||||
| Turnout | 2,225 | 34.25 | |||
| Labour hold | Swing | ||||
St Davids
| Party | Candidate | Votes | % | ± | |
|---|---|---|---|---|---|
| Labour | Luke Sills* | 1,119 | 43.41 | +10.2 | |
| Green | Diana Moore | 826 | 32.04 | +7.2 | |
| Conservative | Aric Gilinsky | 471 | 18.27 | +0.4 | |
| Liberal Democrats | James Dart | 162 | 6.28 | -22.8 | |
| Majority | 293 | ||||
| Turnout | 2,578 | 35.09 | |||
| Labour hold | Swing | ||||
St Loyes
| Party | Candidate | Votes | % | ± | |
|---|---|---|---|---|---|
| Conservative | Peter Holland | 1,299 | 52.23 | +22.4 | |
| Labour | Christine Buswell | 901 | 36.23 | +2.7 | |
| Liberal Democrats | Thomas Deakin | 167 | 6.71 | -8.0 | |
| Green | Andrew Cheesewright | 120 | 4.83 | -10.0 | |
| Majority | 398 | ||||
| Turnout | 2,487 | 36.03 | |||
| Conservative gain from Labour | Swing | ||||
St Thomas
| Party | Candidate | Votes | % | ± | |
|---|---|---|---|---|---|
| Labour | Laura Wright | 1,343 | 49.30 | +8.9 | |
| Conservative | Mason Bell | 679 | 24.93 | +12.2 | |
| Liberal Democrats | Sandy Chenore | 376 | 13.80 | -8.4 | |
| Green | Joe Levy | 292 | 10.72 | +2.7 | |
| BNP | Chris Stone | 34 | 1.25 | N/A | |
| Majority | 664 | ||||
| Turnout | 2,724 | 36.75 | |||
| Labour hold | Swing | ||||
Topsham
| Party | Candidate | Votes | % | ± | |
|---|---|---|---|---|---|
| Conservative | Catherine Pierce | 1,254 | 47.88 | +1.6 | |
| Labour | Eliot Wright | 989 | 37.76 | +1.8 | |
| Green | Jonathan Dawson | 198 | 7.56 | -9.5 | |
| Liberal Democrats | David Pugh | 178 | 6.80 | -3.3 | |
| Majority | 265 | ||||
| Turnout | 2,619 | 37.77 | |||
| Conservative hold | Swing | ||||
References
- "2018 Local Election Results". exeter.gov.uk. Exeter City Council. Archived from the original on 10 May 2018. Retrieved 10 May 2018.
- "Labour councillor joins Exeter Greens". www.greenparty.org.uk. 28 February 2017.