Vibronic spectroscopy
Vibronic spectra involve simultaneous changes in the vibrational and electronic energy states of a molecule. In the gas phase vibronic transitions are accompanied by changes in rotational energy also. Vibronic spectra of diatomic molecules have been analysed in detail;[1] emission spectra are more complicated than absorption spectra. The intensity of allowed vibronic transitions is governed by the Franck–Condon principle. Vibronic spectroscopy may provide information, such as bond-length, on electronic excited states of stable molecules. It has also been applied to the study of unstable molecules such as dicarbon, C2, in discharges, flames and astronomical objects.[2][3]
Principles
Electronic transitions are typically observed in the visible and ultraviolet regions, in the wavelength range approximately 200–700 nm (50,000–14,000 cm−1), whereas fundamental vibrations are observed below about 4000 cm−1.[note 1] When the electronic and vibrational energy changes are so different, vibronic coupling (mixing of electronic and vibrational wave functions) can be neglected and the energy of a vibronic level can be taken as the sum of the electronic and vibrational (and rotational) energies; that is, the Born–Oppenheimer approximation applies.[4] The overall molecular energy depends not only on the electronic state but also on vibrational and rotational quantum numbers, denoted v and J respectively for diatomic molecules. It is conventional to add a double prime (v", J") for levels of the electronic ground state and a single prime (v', J') for electronically excited states.
Each electronic transition may show vibrational coarse structure, and for molecules in the gas phase, rotational fine structure. This is true even when the molecule has a zero dipole moment and therefore has no vibration-rotation infrared spectrum or pure rotational microwave spectrum.[5]
It is necessary to distinguish between absorption and emission spectra. With absorption the molecule starts in the ground electronic state, and usually also in the vibrational ground state because at ordinary temperatures the energy necessary for vibrational excitation is large compared to the average thermal energy. The molecule is excited to another electronic state and to many possible vibrational states . With emission, the molecule can start in various populated vibrational states, and finishes in the electronic ground state in one of many populated vibrational levels. The emission spectrum is more complicated than the absorption spectrum of the same molecule because there are more changes in vibrational energy level.


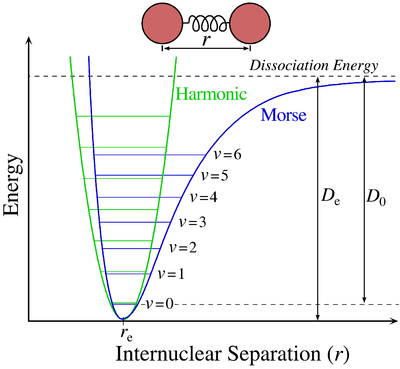
For absorption spectra, the vibrational coarse structure for a given electronic transition forms a single progression, or series of transitions with a common level, here the lower level .[6] There are no selection rules for vibrational quantum numbers, which are zero in the ground vibrational level of the initial electronic ground state, but can take any integer values in the final electronic excited state. The term values for a harmonic oscillator are given by
where v is a vibrational quantum number, ωe is the harmonic wavenumber. In the next approximation the term values are given by
where χe is an anharmonicity constant. This is, in effect, a better approximation to the Morse potential near the potential minimum. The spacing between adjacent vibrational lines decreases with increasing quantum number because of anharmonicity in the vibration. Eventually the separation decreases to zero when the molecule photo-dissociates into a continuum of states. The second formula is adequate for small values of the vibrational quantum number. For higher values further anharmonicity terms are needed as the molecule approaches the dissociation limit, at the energy corresponding to the upper (final state) potential curve at infinite internuclear distance.
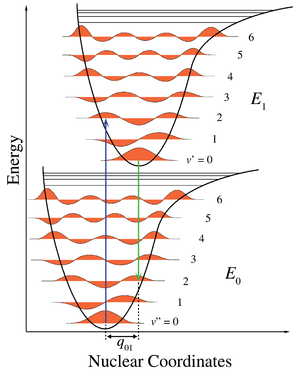
The intensity of allowed vibronic transitions is governed by the Franck–Condon principle.[7] Since electronic transitions are very fast compared with nuclear motions, vibrational levels are favored when they correspond to a minimal change in the nuclear coordinates, that is, when the transition is "vertical" on the energy level diagram. Each line has a finite linewidth, dependent on a variety of factors.[8]
Vibronic spectra of diatomic molecules in the gas phase have been analyzed in detail.[9] Vibrational coarse structure can sometimes be observed in the spectra of molecules in liquid or solid phases and of molecules in solution. Related phenomena including photoelectron spectroscopy, resonance Raman spectroscopy, luminescence, and fluorescence are not discussed in this article, though they also involve vibronic transitions.
Diatomic molecules
The vibronic spectra of diatomic molecules in the gas phase also show rotational fine structure. Each line in a vibrational progression will show P- and R- branches. For some electronic transitions there will also be a Q-branch. The transition energies, expressed in wavenumbers, of the lines for a particular vibronic transition are given, in the rigid rotor approximation, that is, ignoring centrifugal distortion, by[10]
Here B are rotational constants and J are rotational quantum numbers. (For B also, a double prime indicates the ground state and a single prime an electronically excited state.) The values of the rotational constants may differ appreciably because the bond length in the electronic excited state may be quite different from the bond length in the ground state, because of the operation of the Franck-Condon principle. The rotational constant is inversely proportional to the square of the bond length. Usually B′ < B′′ as is true when an electron is promoted from a bonding orbital to an antibonding orbital, causing bond lengthening. But this is not always the case; if an electron is promoted from a non-bonding or antibonding orbital to a bonding orbital, there will be bond-shortening and B′ > B′′.

The treatment of rotational fine structure of vibronic transitions is similar to the treatment of rotation-vibration transitions and differs principally in the fact that the ground and excited states correspond to two different electronic states as well as to two different vibrational levels. For the P-branch , so that
Similarly for the R-branch , and
Thus, the wavenumbers of transitions in both P- and R- branches are given, to a first approximation, by the single formula[10][11]
Here positive m values refer to the R-branch (with m = +J ′ = J'' +1) and negative values refer to the P-branch (with m = -J ′′). The wavenumbers of the lines in the P-branch, on the low wavenumber side of the band origin at , increase with m. In the R-branch, for the usual case that B′ < B′′, as J increases the wavenumbers at first lie increasingly on the high wavenumber side of the band origin but then start to decrease, eventually lying on the low wavenumber side. The Fortrat diagram illustrates this effect.[note 2] In the rigid rotor approximation the line wavenumbers lie on a parabola which has a maximum at
The line of highest wavenumber in the R-branch is known as the band head. It occurs at the value of m which is equal to the integer part of x, or of (x+1).
When a Q- branch is allowed for a particular electronic transition, the lines of the Q-branch correspond to the case ∆J=0, J′=J′′ and wavenumbers are given by[12]
The Q-branch then consists of a series of lines with increasing separation between adjacent lines as J increases. When B′<B′′ the Q-branch lies to lower wavenumbers relative to the vibrational line.
Predissociation
The phenomenon of predissociation occurs when an electronic transition results in dissociation of the molecule at an excitation energy less than the normal dissociation limit of the upper state. This can occur when the potential energy curve of the upper state crosses the curve for a repulsive state, so that the two states have equal energy at some internuclear distance. This allows the possibility of a radiationless transition to the repulsive state whose energy levels form a continuum, so that there is blurring of the particular vibrational band in the vibrational progression.[13]
Applications

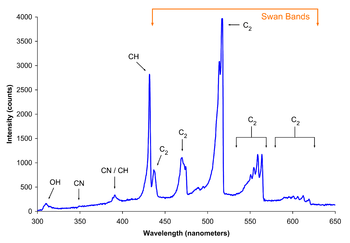
The analysis of vibronic spectra of diatomic molecules provides information concerning both the ground electronic state and the excited electronic state. Data for the ground state can also be obtained by vibrational or pure rotational spectroscopy, but data for the excited state can only be obtained from the analysis of vibronic spectra. For example, the bond length in the excited state may be derived from the value of the rotational constant B′. In addition to stable diatomic molecules, vibronic spectroscopy has been used to study unstable species, including CH, NH, hydroxyl radical, OH, and cyano radical, CN.[14] The Swan bands in hydrocarbon flame spectra are a progression in the C-C stretching vibration of the dicarbon radical, C2 for the electronic transition.[15] Vibronic bands for 9 other electronic transitions of C2 have been observed in the infrared and ultraviolet regions.[2]
Polyatomic molecules and ions

For polyatomic molecules, progressions are most often observed when the change in bond lengths upon electronic excitation coincides with the change due to a ″totally symmetric″ vibration.[note 3] This is the same process that occurs in resonance Raman spectroscopy. For example, in formaldehyde (methanal), H2CO, the n → π* transition involves excitation of an electron from a non-bonding orbital to an antibonding pi orbital which weakens and lengthens the C-O bond. This produces a long progression in the C-O stretching vibration.[16][17] Another example is furnished by benzene, C6H6. In both gas and liquid phase the band around 250 nm shows a progression in the symmetric ring-breathing vibration.[18]

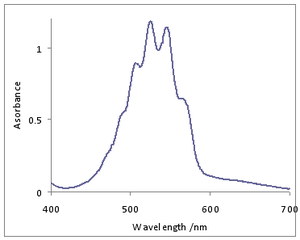
As an example from inorganic chemistry the permanganate ion, MnO−
4, in aqueous solution has an intense purple colour due to an O → Mn ligand-to-metal charge transfer band (LMCT) in much of the visible region.[19] This band shows a progression in the symmetric Mn-O stretching vibration.[20] The individual lines overlap each other extensively, giving rise to a broad overall profile with some coarse structure.
Progressions in vibrations which are not totally symmetric may also be observed.[21]
d-d electronic transitions in atoms in a centrosymmetric environment are electric-dipole forbidden by the Laporte rule. This will apply to octahedral coordination compounds of the transition metals. The spectra of many of these complexes have some vibronic character.[22] The same rule also applies to f-f transitions in centrosymmetric complexes of lanthanides and actinides. In the case of the octahedral actinide chloro-complex of uranium(IV), UCl62− the observed electronic spectrum is entirely vibronic. At the temperature of liquid helium, 4K, the vibronic structure was completely resolved, with zero intensity for the purely electronic transition, and three side-lines corresponding to the asymmetric U-Cl stretching vibration and two asymmetric Cl-U-Cl bending modes.[23] Later studies on the same anion were also able to account for vibronic transitions involving low-frequency lattice vibrations.[24]
Notes
- Energy is related to wavenumber by , where h=Planck's constant and c is the velocity of light
- When centrifugal distortion is included the R-branch lines below the vibrational origin do not coincide with P-branch lines
- In a ″totally symmetric″ vibration the lengths of all symmetrically-equivalent bonds vary in phase with each other. The symmetry of the molecule is the same in the vibrational excited state as in the vibrational ground state.
References
- Herzberg, Gerhard (1950). Molecular spectra and molecular structure (2nd. ed.). Van Nostrand.Available for download at community books
- Hollas, p. 211.
- Parsons, M. L. (1971). Flame Spectroscopy : Atlas of Spectral Lines. Springer. ISBN 9780306651564.
- Banwell and McCash, p. 162.
- Banwell and McCash, p. 163.
- Hollas, p. 214
- Hollas, p. 215.
- Hollas, pp. 30–33.
- Hollas, pp. 210–228
- Banwell and McCash, p. 171
- Straughan and Walker, p. 74
- Hollas, p. 172.
- Banwell and McCash, p. 174 illustrates a spectrum with pre-dissociation.
- Banwell and McCash, p. 176
- Gaydon, p. 259.
- Dieke, G. H.; Kistiakowsky, G. B. (1934). "The Rotational Structure of the Ultra-Violet Absorption Bands of Formaldehyde" (PDF). Proc. Natl. Acad. Sci. 18 (5): 367–372. Bibcode:1932PNAS...18..367D. doi:10.1073/pnas.18.5.367. PMID 16587697.
- Clouthier, D. J.; Ramsay, D. A. (1983). "The Spectroscopy of Formaldehyde and Thioformaldehyde". Annual Review of Physical Chemistry. 34: 31–58. Bibcode:1983ARPC...34...31C. doi:10.1146/annurev.pc.34.100183.000335.
- Hollas shows the vibration on p. 140 (Fig.6.13f) and the spectrum on p. 245
- Housecroft C. E. and Sharpe A. G. Inorganic Chemistry (2nd ed., Pearson Prentice-Hall 2005), p. 612
- Neugebauer, Johannes; Baerends, Evert Jan (2005). "Vibronic Structure of the Permanganate Absorption Spectrum from Time-Dependent Density Functional Calculations" (PDF). J. Phys. Chem. 109 (6): 1168–1179. Bibcode:2005JPCA..109.1168N. doi:10.1021/jp0456990. PMID 16833427.
- Hollas, p. 245.
- Orgel, L. E. (1966). An Introduction to Transition Metal Chemistry. Ligand field theory (2nd ed.). Methuen. p. 94.
- Satten, Robert A.; Young, Donald; Gruen, Dieter M. (1960). "Preliminary Analysis of U4+ Ion Spectra in Crystals". J. Chem. Phys. 33 (4): 1160–1171. Bibcode:1960JChPh..33.1140S. doi:10.1063/1.1731348.
- Pollack, S. A. (1963). "Application of Space‐Group Theory to the Vibrational Problem of di‐Tetramethyl Ammonium Uranium Hexachloride". J. Chem. Phys. 38 (1): 98–108. Bibcode:1963JChPh..38...98P. doi:10.1063/1.1733502.
Bibliography
- Atkins, P. W.; de Paula, J. (2006). Physical Chemistry (8th ed.). Oxford University Press. pp. 431–469. ISBN 0198700725. Chapter: Molecular Spectroscopy 2.
- Banwell, Colin N.; McCash, Elaine M. (1994). Fundamentals of molecular spectroscopy (4th ed.). McGraw-Hill. ISBN 0-07-707976-0.
- Gaydon, Alfred Gordon (1974). The spectroscopy of flames. London: Chapman and Hall. ISBN 0-470-29433-7.
- Hollas, M. J. (1996). Modern Spectroscopy (3rd ed.). Wiley. ISBN 0471965227.
- Straughan, B. P.; Walker, S. (1976). Spectroscopy. 3 (3rd ed.). Chapman and Hall. pp. 50–84. ISBN 0-412-13390-3.