Thermometric titration
A thermometric titration is one of a number of instrumental titration techniques where endpoints can be located accurately and precisely without a subjective interpretation on the part of the analyst as to their location. Enthalpy change is arguably the most fundamental and universal property of chemical reactions, so the observation of temperature change is a natural choice in monitoring their progress. It is not a new technique, with possibly the first recognizable thermometric titration method reported early in the 20th century (Bell and Cowell, 1913). In spite of its attractive features, and in spite of the considerable research that has been conducted in the field and a large body of applications that have been developed; it has been until now an under-utilized technique in the critical area of industrial process and quality control. Automated potentiometric titration systems have pre-dominated in this area since the 1970s. With the advent of cheap computers able to handle the powerful thermometric titration software, development has now reached the stage where easy to use automated thermometric titration systems can in many cases offer a superior alternative to potentiometric titrimetry.

Comparison between potentiometric and thermometric titrations.
Potentiometric titrimetry has been the predominant automated titrimetric technique since the 1970s, so it is worthwhile considering the basic differences between it and thermometric titrimetry.
Potentiometrically-sensed titrations rely on a free energy change in the reaction system. Measurement of a free energy dependent term is necessary.
- ΔG0 = -RT lnK (1)
Where:
- ΔG0 = change on free energy
- R = universal gas constant
- T = temperature in kelvins (K) or degrees Rankine (°R)
- K = equilibrium constant at temperature T
- ln is the natural logarithm function
In order for a reaction to be amenable to potentiometric titrimetry, the free energy change must be sufficient for an appropriate sensor to respond with a significant inflection (or "kink") in the titration curve where sensor response is plotted against the amount of titrant delivered.
However, free energy is just one of three related parameters in describing any chemical reaction:
- ΔH0 = ΔG0 + TΔS0 (2)
where:
- ΔH0 = change in enthalpy
- ΔG0 = change in free energy
- ΔS0 = change in entropy
- T = temperature in K
For any reaction where the free energy is not opposed by the entropy change, the enthalpy change will be significantly greater than the free energy. Thus a titration based on a change in temperature (which permits observation of the enthalpy change) will show a greater inflection than will curves obtained from sensors reacting to free energy changes alone.
Thermometric titrations
In the thermometric titration, titrant is added at a known constant rate to a titrand until the completion of the reaction is indicated by a change in temperature. The endpoint is determined by an inflection in the curve generated by the output of a temperature measuring device.
Consider the titration reaction:
- aA + bB = pP (3)
Where:
- A = the titrant, and a = the corresponding number of moles reacting
- B = the analyte, and b = the corresponding number of moles reacting
- P = the product, and p = the corresponding number of moles produced
At completion, the reaction produces a molar heat of reaction ΔHr which is shown as a measurable temperature change ΔT. In an ideal system, where no losses or gains of heat due to environmental influences are involved, the progress of the reaction is observed as a constant increase or decrease of temperature depending respectively on whether ΔHr is negative (indicating an exothermic reaction) or positive (indicating an endothermic reaction). In this context, environmental influences may include (in order of importance):

- Heat losses or gains from outside the system via the vessel walls and cover;
- Differences in the temperature between the titrant and the titrand;
- Evaporative losses from the surface of the rapidly mixed fluid;
- Heats of solution when the titrant solvent is mixed with the analyte solvent;
- Heat introduced by the mechanical action of stirring (minor influence); and
- Heat produced by the thermistor itself (very minor influence).
If the equilibrium for the reaction lies far to the right (i.e. a stoichiometric equilibrium has been achieved), then when all analyte has been reacted by the titrant continuing addition of titrant will be revealed by a sharp break in the temperature/volume curve. Figures 1a and 1b illustrate idealized examples.

The shape of experimentally obtained thermometric titration plots will vary from such idealized examples, and some of the environmental influences listed above may have impacts. Curvature at the endpoint might be observed. This can be due to insensitivity of the sensor or where thermal equilibrium at the endpoint is slow to occur. It can also occur where the reaction between titrant and titrand does not proceed to stoichiometric completion. The determinant of the degree to which a reaction will proceed to completion is the free energy change. If this is favourable, then the reaction will proceed to be completion and be essentially stoichiometric. In this case, the sharpness of the endpoint is dependent on the magnitude of the enthalpy change. If it is unfavourable, the endpoint will be rounded regardless of the magnitude of the enthalpy change. Reactions where non-stoichiometric equilibria are evident can be used to obtain satisfactory results using a thermometric titration approach. If the portions of the titration curve both prior to and after the endpoint are reasonably linear, then the intersection of tangents to these lines will accurately locate the endpoint. This is illustrated in Figure 2.
Consider the reaction for the equation aA + bB = pP which is non-stoichiometric at equilibrium. Let A represent the titrant, and B the titrand. At the beginning of the titration, the titrand B is strongly in excess, and the reaction is pushed towards completion. Under these conditions, for a constant rate of titrant addition the temperature increase is constant and the curve is essentially linear until the endpoint is approached. In a similar manner, when the titrant is in excess past the endpoint, a linear temperature response can also be anticipated. Thus intersection of tangents will reveal the true endpoint.
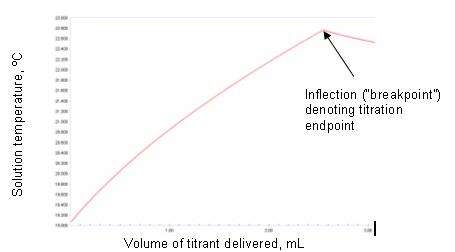
An actual thermometric titration plot for the determination of a strong base with a strong acid is illustrated in Figure 3.
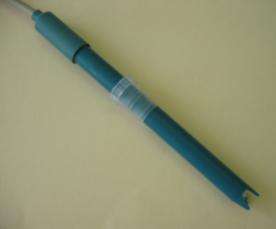
The most practical sensor for measuring temperature change in titrating solutions has been found to be the thermistor. Thermistors are small solid state devices which exhibit relatively large changes in electrical resistance for small changes in temperature. They are manufactured from sintered mixed metal oxides, with lead wires enabling connection to electrical circuitry. The thermistor is encapsulated in a suitable electrically insulating medium with satisfactory heat transfer characteristics and acceptable chemical resistance. Typically for thermistors used for chemical analysis the encapsulating medium is glass, although thermistors encapsulated in epoxy resin may be used in circumstances where either chemical attack (e.g., by acidic fluoride-containing solutions) or severe mechanical stress is anticipated. The thermistor is supported by suitable electronic circuitry to maximize sensitivity to minute changes in solution temperature. The circuitry in the Metrohm 859 Titrotherm thermometric titration interface moldule is capable of resolving temperature changes as low as 10−5 K.

A critical element in modern automated thermometric titrimetry is the ability to locate the endpoint with a high degree of reproducibility. It is clearly impractical and insufficient for modern demands of accuracy and precision to estimate the inflection by intersection of tangents. This is done conveniently by derivatization of the temperature curve. The second derivative essentially locates the intersection of tangents to the temperature curve immediately pre- and post- the breakpoint.
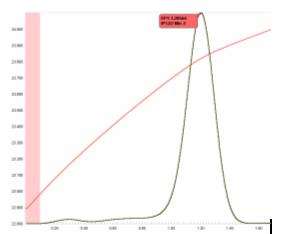
Thermistors respond quickly to small changes in temperature such as temperature gradients in the mixed titration solution, and thus the signal can exhibit a small amount of noise. Prior to derivatization it is therefore necessary to digitally smooth (or “filter”) the temperature curve in order to obtain sharp, symmetrical second derivative “peaks” which will accurately locate the correct inflection point. This is illustrated in Figure 5. The degree of digital smoothing is optimized for each determination, and is stored as a method parameter for application every time a titration for that particular analysis is run.
Because enthalpy change is a universal characteristic of chemical reactions, thermometric endpoint sensing can be applied to a wide range of titration types, e.g.
Further, since the sensor is not required to interact with the titration solution electrochemically, titrations in non-conducting media can be performed, as can titrations using reactions for which no convenient or cost-effective potentiometric sensor is available.
Thermometric titrations generally demand rapid reaction kinetics in order to obtain sharp reproducible endpoints. Where reaction kinetics are slow, and direct titrations between titrant and titrand are not possible, indirect or back-titrations often can be devised to solve the problem.
Catalytically enhanced endpoints can be used in some instances where the temperature change at the endpoint is very small and endpoints would not be detected satisfactorily by the titration software.
The suitability of a particular chemical reaction as a candidate for a thermometric titration procedure can generally be predicted on the basis of the estimated amount of analyte present in the sample and the enthalpy of the reaction. However, other parameters such as the kinetics of the reaction, the sample matrix itself, heats of dilution and losses of heat to the environment can affect the outcome. A properly designed experimental program is the most reliable way of determining the viability of a thermometric titration approach. Successful applications for thermometric titrations are generally where titrant-titrand reaction kinetics are fast, and chemical equilibria are stoichiometric or nearly so.
Where thermometric titration determinations may be recommended
- The analyst wishes to simplify the conduct of a variety of titrations by using one sensor for all. For example, a laboratory might conduct routinely acid/base, redox, complexometric, sulfate and chloride titrations. A single thermometric sensor in conjunction with an autosampler will enable all titrations to be performed in the same carousel load without having to change titration sensors. After preparation of the samples and placing in the carousel, the analyst assigns the appropriate thermometric method to the beaker position in the carousel.
- The titration environment is considered unsuitable for conventional titration sensors. For example, glass membrane pH electrodes must be kept adequately hydrated for proper operation. The use of such electrodes in substantially non-aqueous media as in the determination of trace acids in lipids and lubricating oils can lead to loss of performance as the membrane fouls and dehydrates, and/or if the reference junction is partly or completely blocked. It is often necessary to keep a number of electrodes cycling through a rejuvenation program in order to keep up with an analytical workload. Thermometric sensors have no electrochemical interaction with the titrating solution, and therefore can be used on a continuous basis with essentially no maintenance. Similarly, the potentiometric titration of sulfate with barium chloride in various industrial samples can lead to rapid degradation of the indicating barium ion selective electrode.
- A thermometric titration methodology which cannot be emulated using other types of titration sensors will deliver superior or results otherwise unobtainable by other techniques. Examples are the determination of fluoride by titration with boric acid, the analysis of orthophosphate by titration with magnesium ions, and the direct titration of aluminium with fluoride ions.
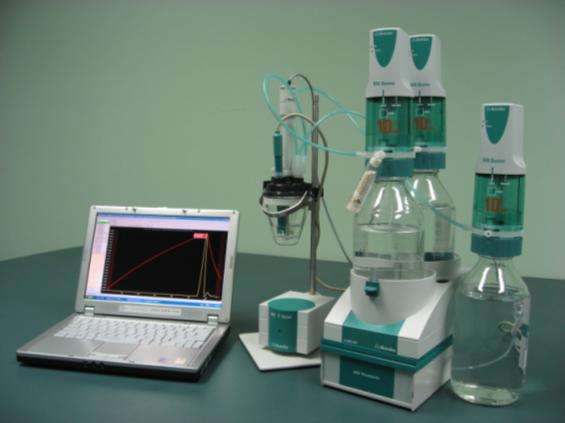
Apparatus and setup for automated thermometric titrimetry
A suitable setup for automated thermometric titrimetry comprises the following:
- Precision fluid dispensing devices – “burettes” – for adding titrants and dosing of other reagents
- Thermistor-based thermometric sensor
- Titration vessel
- Stirring device, capable of highly efficient stirring of vessel contents without splashing
- Computer with thermometric titration operating system
- Thermometric titration interface module – this regulates the data flow between the burettes, sensors and the computer
Figure 6 illustrates a modern automated thermometric titration system based on the Metrohm 859 Titrotherm interface module with Thermoprobe sensor, Metrohm 800 Dosino dispensing devices and a computer running the operational software.

Figure 7 is a schematic of the relationship between components in automated thermometric titration system.
A = dosing device
B = thermometric sensor
C = stirring device
D = thermometric titration interface module
E = computer
Types of thermometric titration
Applications for thermometric titrimetry are drawn from the major groupings, namely:
- Acid-base titration
- Redox titration
- Precipitation titration
- Complexometric titration
Because the sensor does not interact electrically or electrochemically with the solution, electrical conductance of the titrating medium is not a pre-requisite for a determination. Titrations may be carried out in completely non-conducting, non-polar media if required. Further, titrations may be carried out in turbid solutions or even suspensions of solids, and titrations where precipitates are reaction products can be contemplated. The range of possible thermometric titration applications far exceeds the actual experience of this writer, and the reader will be referred to the appropriate literature in some instances.
Acid-base titrations

Determination of fully dissociated acids and bases.
The heat of neutralization of a fully dissociated acid with a fully dissociated base is approximately –56kJ/mol. The reaction is thus strongly exothermic, and is an excellent basis for a wide range of analysis in industry. An advantage for the industrial analyst is that the use of stronger titrants (1 to 2 mol/L) permits a reduction in the amount of sample preparation, and samples can often be directly and accurately dispensed into the titration vessel prior to titration.
Titration of weak acids
Weakly dissociated acids yield sharp thermometric endpoints when titrated with a strong base. For instance, bicarbonate can be unequivocally determined in the company of carbonate by titrating with hydroxyl (Δ0Hr=-40.9 kJ/mol).

Titration of acid mixtures
Mixtures of complex acids can be resolved by thermometric titration with standard NaOH in aqueous solution. In a mixture of nitric, acetic and phosphoric acids used in the fabrication of semi-conductors, three endpoints could be predicted on the basis of the dissociation constants of the acids:
| Endpoint 1 | Endpoint 2 | Endpoint 3 |
|---|---|---|
| HNO3
(pKa = -1.3) |
HOAc
(pKa = 4.75) |
|
| H3PO4
(pKa1 = 2.12) |
H3PO4
(pKa2 = 7.21) |
H3PO4
(pKa3 = 12.36) |
The key to determine the amount of each acid present in the mixture is the ability to obtain an accurate value for the amount of phosphoric acid present, as revealed by titration of the third proton of H3PO4.
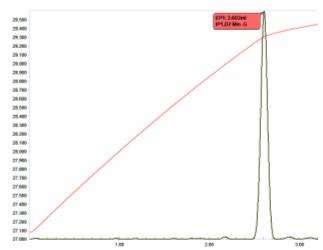
Figure 10 illustrates a titration plot of this mixture, showing 3 sharp endpoints.
Titration of complex alkaline solutions
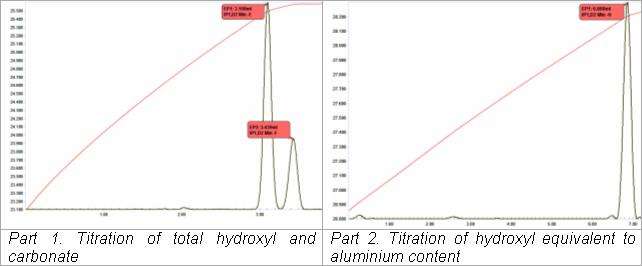
The thermometric titrimetric analysis of sodium aluminate liquor (“Bayer liquor”) in the production of alumina from bauxite is accomplished in an automated two titration sequence. This is an adaptation of a classic thermometric titration application (VanDalen and Ward, 1973). In the first titration, tartrate solution is added to an aliquot of liquor to complex aluminate, releasing one mole of hydroxyl for each mole of aluminate present. This is titrated acidimetrically along with “free” hydroxyl present and the carbonate content (as a second endpoint). The second titration is preceded by the automatic addition of fluoride solution. The alumina-tartrate complex is broken in favour of the formation of an aluminium fluoride complex and the concomitant release of three moles of hydroxyl for each mole of aluminium present, which are then titrated acidimetrically. The whole determination can be completed in less than 5 minutes.
Non-aqueous acid-base titrations
Non-aqueous acid-base titrations can be carried out advantageously by thermometric means.
Acid leach solutions from some copper mines can contain large quantities of Fe(III) as well as Cu(II). The “free acid” (sulfuric acid) content of these leach solutions is a critical process parameter. While thermometric titrimetry can determine the free acid content with modest amounts of Fe(III), in some solutions the Fe(III) content is so high as to cause serious interference. Complexation with necessarily large amounts of oxalate is undesirable due to the toxicity of the reagent. A thermometric titration was devised by diluting the aliquot with propan-2-ol and titration with standard KOH in propan-2-ol. Most of the metal content precipitated prior to the commencement of the titration, and a clear, sharp endpoint for the sulfuric acid content was obtained.

Catalyzed endpoint thermometric acid-base titrations
The determination of trace acids in organic matrices is a common analytical task assigned to titrimetry. Examples are Total Acid Number (TAN) in mineral and lubricating oils and Free Fatty Acids (FFA) in edible fats and oils. Automated potentiometric titration procedures have been granted standard method status, for example by ASTM for TAN and AOAC for FFA. The methodology is similar in both instances. The sample is dissolved in a suitable solvent mixture; say a hydrocarbon and an alcohol which also must contain a small amount of water. The water is intended to enhance the electrical conductivity of the solution. The trace acids are titrated with standard base in an alcohol. The sample environment is essentially hostile to the pH electrode used to sense the titration. The electrode must be taken out of service on a regular basis to rehydrate the glass sensing membrane, which is also in danger of fouling by the oily sample solution.
A recent thermometric titrimetric procedure for the determination of FFA developed by Cameiro et al. (2002) has been shown to be particularly amenable to automation. It is fast, highly precise, and results agree very well with those obtained by the official AOAC method. The temperature change for the titration of very weak acids such as oleic acid by 0.1 mol/L KOH in propan-2-ol is too small to yield an accurate endpoint. In this procedure, a small amount of paraformaldehyde as a fine powder is added to the titrand before the titration. At the endpoint, the first excess of hydroxyl ions catalyzes the depolymerization of paraformaldehyde. The reaction is strongly endothermic and yields a sharp inflection. The titration plot is illustrated in Figure 13. The speed of this titration coupled with its precision and accuracy makes it ideal for the analysis of FFA in biodiesel feedstocks and product.
Redox titrations
Titrations with permanganate and dichromate
Redox reactions are normally strongly exothermic, and can make excellent candidates for thermometric titrations. In the classical determination of ferrous ion with permanganate, the reaction enthalpy is more than double that of a strong acid/strong base titration:Δ0Hr = −123.9 kJ/mol of Fe. The determination of hydrogen peroxide by permanganate titration is even more strongly exothermic at Δ0Hr = −149.6 kJ/mol H2O2
Titrations with thiosulfate
In the determination of hypochlorite (for example in commercial bleach formulations), a direct titration with thiosulfate can be employed without recourse to an iodometric finish.
- ClO− + H2O + 2e− ↔ Cl− + 2OH−
- 2S2O32− ↔ S4O62− + 2e−
- 2S2O32− +ClO− +H2O ↔ S4O62− +Cl− +2OH−
Thermometric iodometric titrations employing thiosulfate as a titrant are also practical, for example in the determination of Cu(II). In this instance, it has been found advantageous to incorporate the potassium iodide reagent with the thiosulfate titrant in such proportions that iodine is released into solution just prior to its reduction by thiosulfate. This minimizes iodine losses during the course of the titration.
Titrations with hypochlorite
While relatively unstable and requiring frequent standardization, sodium hypochlorite has been used in a very rapid thermometric titration method for the determination of ammonium ion. This is an alternative to the classical approach of ammonia distillation from basic solution and consequent acid-base titration. The thermometric titration is carried out in bicarbonate solution containing bromide ion (Brown et al., 1969).

Complexometric (EDTA) titrations
Thermometric titrations employing sodium salts of ethylenediaminetetra-acetic acid (EDTA) have been demonstrated for the determination of a range of metal ions. Reaction enthalpies are modest, so titrations are normally carried out with titrant concentrations of 1 mol/L. This necessitates the use of the tetra-sodium salt of EDTA rather than the more common di-sodium salt which is saturated at a concentration of only approximately 0.25 mol/L.
An excellent application is the sequential determination of calcium and magnesium. Although calcium reacts exothermically with EDTA (heat of chelation ~-23.4 kJ/mol), magnesium reacts endothermically with a heat of chelation of ~+20.1 kJ/mol. This is illustrated in the titration plot of EDTA with calcium and magnesium in sea water (Figure 14). Following the solution temperature curve, the breakpoint for the calcium content (red-tagged endpoint) is followed by a region of modest temperature rise due to competition between the heats of dilution of the titrant with the solution, and the endothermic reaction of Mg2+ and EDTA. The breakpoint for the consumption of Mg2+ (blue-tagged endpoint) by EDTA is revealed by upswing in temperature caused purely by the heat of dilution.

Direct EDTA titrations with metal ions are possible when reaction kinetics are fast, for example zinc, copper, calcium and magnesium. However, with slower reaction kinetics such as those exhibited by cobalt and nickel, back-titrations are used. Titrations for cobalt and nickel are carried out in an ammoniacal environment; buffered with ammonia:ammonium chloride solution. An excess of EDTA is added, and is back-titrated with Cu(II) solution. It is postulated that the breakpoint is revealed by the difference in reaction enthalpies between the formation of the Cu-EDTA complex, and that for the formation of the Cu-amine complex.

A catalyzed endpoint procedure to determine trace amounts of metal ions in solution (down to approximately 10 mg/L) employs 0.01 mol/L EDTA. This has been applied to the determination of low level Cu(II) in specialized plating baths, and to the determination of total hardness in water. The reaction enthalpies of EDTA with most metal ions are often quite low, and typically titrant concentrations around 1 mol/L are employed with commensurately high amounts of titrand in order to obtain sharp, reproducible endpoints. Using a catalytically indicated endpoint, very low EDTA titrant concentrations can be used. A back-titration is used. An excess of EDTA solution is added. The excess of EDTA is back-titrated with a suitable metal ion such as Mn2+ or Cu2+. At the endpoint, the first excess of metal ion catalyzes a strongly exothermic reaction between a polyhdric phenol (such as resorcinol) and hydrogen peroxide.
Precipitation titrations
Thermometric titrimetry is particularly suited to the determination of a range of analytes where a precipitate is formed by reaction with the titrant. In some cases, an alternative to traditional potentiometric titration practice can be offered. In other cases, reaction chemistries may be employed for which there is no satisfactory equivalent in potentiometric titrimetry.
Titrations with silver nitrate
Thermometric titrations of silver nitrate with halides and cyanide are all possible. The reaction of silver nitrate with chloride is strongly exothermic. For instance, the reaction enthalpy of Ag+ with Cl− is a high −61.2 kJ/mol. This permits convenient determination of chloride with commonly available standard 0.1 mol/L AgNO3. Endpoints are very sharp, and with care, chloride concentrations down to 15 mg/L can be analyzed. Bromide and chloride may be determined in admixture.
Titration of sulfate
Sulfate may be rapidly and easily titrated thermometrically using standard solutions of Ba2+ as titrant. Industrially, the procedure has been applied to the determination of sulfate in brine (including electrolysis brines), in nickel refining solutions and particularly for sulfate in wet process phosphoric acid, where it has proven to be quite popular. The procedure can also be used to assist in the analysis of complex acid mixtures containing sulfuric acid where resorting to titration in non-aqueous media is not feasible.
The reaction enthalpy for the formation of barium sulfate is a modest −18.8 kJ/mol. This can place a restriction on the lower limit of sulfate in a sample which can be analyzed.
Titration of aluminium with fluoride
Thermometric titrimetry offers a rapid, highly precise method for the determination of aluminium in solution. A solution of aluminium is conditioned with acetate buffer and an excess of sodium and potassium ions. Titration with sodium or potassium fluoride yields the exothermic precipitation of an insoluble alumino-fluoride salt.
- Al3+ + Na+ + 2K+ + 6F− ↔ K2NaAlF6↓
Because 6 mole of fluoride react with one mole of aluminium, the titration is particularly precise, and a coefficient of variance (CV) of 0.03 has been achieved in the analysis of alum.
When aluminium ion (say as aluminium nitrate) is employed as the titrant, fluoride can be determined using the same chemistry. This titration is useful in the determination of fluoride in complex acid mixtures used as etchants in the semi-conductor industry.
Titration of total orthophosphate
Orthophosphate ion can be conveniently thermometrically titrated with magnesium ions in the presence of ammonium ion. An aliquot of sample is buffered to approximately pH10 with an NH3/NH4Cl solution.
The reaction:
- Mg2+ + NH4+ + PO43− ↔ MgNH4PO4↓
Is exothermic. CV’s of under 0.1 have been achieved in test applications. The procedure is suitable for the determination of orthophosphate in fertilizers and other products.
Titration of nickel
Nickel can be titrated thermometrically using di-sodium dimethylglyoximate as titrant. The chemistry is analogous to the classic gravimetric procedure, but the time taken for a determination can be reduced from many hours to a few minutes. Potential interferences need to be considered.

Titration of anionic and cationic surfactants
Anionic and cationic surfactants can be determined thermometrically by titrating one type against the other. For instance, benzalkonium chloride (a quaternary type cationic surfactant) may be determined in cleaners and algaecides for swimming pools and spas by titrating with a standard solution of sodium dodecyl sulfate. Alternatively, anionic surfactants such as sodium lauryl sulfate can be titrated with cetyl pyridinium chloride.

Titration of non-ionic surfactants
When an excess of Ba2+ is added to a non-ionic surfactant of the alkyl propylene oxide derivative type, a pseudo-cationic complex is formed. This may be titrated with standard sodium tetraphenylborate. Two moles tetraphenylborate react with one mole of the Ba2+/ non-ionic surfactant complex.
Miscellaneous aqueous titrations

Titration of fluoride with boric acid
Acidic solutions of fluoride (including hydrofluoric acid) can be determined by a simple thermometric titration with boric acid.
- B(OH)3 + 3F− + 3H+ ↔ BF3 + 3H2O
The titration plot illustrated in Figure 19 shows that the endpoint is quite rounded, suggesting that the reaction might not proceed to stoichiometric equilibrium. However, since the regions of the temperature curve immediately before and after the endpoint are quite linear, the second derivative of this curve (representing the intersection of tangents) will accurately locate the endpoint. Indeed, excellent precision can be obtained with this titration, with a CV of less than 0.1.
Determination of formaldehyde
Formaldehyde can be determined in electroless copper plating solutions by the addition of an excess of sodium sulfite solution and titrating the liberated hydroxyl ion with standard acid.
- H2C=O + HSO3− + H2O → [HO-CH2-SO3−] + OH−
References
- J. M. Bell and C. F. Cowell. J. Am. Chem. Soc. 35, 49-54 (1913)
- E. VanDalen and L. G. Ward. Thermometric titration determination of hydroxide and alumina in Bayer process
solutions. Anal. Chem. 45 (13) 2248-2251, (1973)
- M. J. D. Carneiro, M. A. Feres Júnior, and O. E. S. Godinho. Determination of the acidity of oils using paraformaldehyde as a thermometric end-point indicator. J. Braz. Chem. Soc. 13 (5) 692-694 (2002)
Bibliography
- Bark, L. S. and Bark, S. M.; (1969). Thermometric titrimetry. International Series of Monographs in Analytical Chemistry Vol 33 Pergamon Press (Oxford) Library of Congress Catalog Card No. 68-57883
- Barthel, J.; (1975) Thermometric titrations. John Wiley & Sons, New York. ISBN 0-471-05448-8 Library of Congress Catalog Card No. 75-17503
- Eatough, D. J.; Christensen, J. J. & Izatt R. M. ; (1974) Experiments in thermometric titrimetry and titration calorimetry. Brigham Young University Press, Provo, Utah. ISBN 0-8425-0145-2 Library of Congress Catalog Card 74-13074
- Grime, J. K.; (1985) Analytical solution calorimetry. John Wiley & Sons, New York. ISBN 0-471-86942-2 Library of Congress Catalog Card No. 84-28424
- Vaughan, G.A.; (1973) Thermometric and enthalpimetric titrimetry. Van Nostrand Reinhold Company (London) ISBN 0-442-78385-X Library of Congress Catalog Card No. 79-186764