Stepney (UK Parliament constituency)
Stepney was a parliamentary constituency centred on the Stepney district of the East End of London. It returned one Member of Parliament (MP) to the House of Commons of the Parliament of the United Kingdom, elected by the first past the post system.
| Stepney | |
|---|---|
| Former Borough constituency for the House of Commons | |
| 1885–1918 | |
| Number of members | one |
| Created from | Tower Hamlets |
| 1950–1974 | |
| Number of members | one |
| Replaced by | Stepney and Poplar |
| Created from | Limehouse, Mile End and Whitechapel and St George's |
History
The constituency existed for two separate periods:
- it was first created under the Redistribution of Seats Act 1885, for the 1885 general election, and abolished for the 1918 general election
- from the 1950 general election until its abolition for the February 1974 general election, when it was largely replaced by the new constituency of Stepney and Poplar.
Boundaries

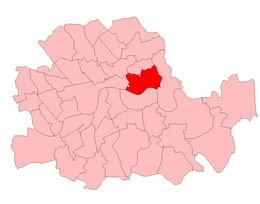
The constituency was first created in 1885, as a division of the parliamentary borough of Tower Hamlets, centred on the Stepney neighbourhood in the East End of London. The area was administered as part of the Tower division of the county of Middlesex.
In 1889 there were administrative changes. The territory of the constituency was severed from Middlesex and included in the new County of London. The lower tier of local government in the area continued to be administered by parish vestries and local boards of works.
In 1900 local government in London was rationalised. The Stepney Board of Works was abolished and the civil parish of Stepney became part of a larger Metropolitan Borough of Stepney.
In the redistribution of parliamentary seats in 1918, the Metropolitan Borough was divided between three constituencies - Limehouse, Mile End and Whitechapel and St George's. The previous Stepney constituency was abolished and largely replaced by Whitechapel and St George's.
In the next major redistribution of parliamentary seats, which took effect for the 1950 United Kingdom general election, the Stepney constituency was re-created. The 1950 version of the seat comprised the whole of the Metropolitan Borough of Stepney.
In 1965 Stepney became part of the London Borough of Tower Hamlets and Greater London. When parliamentary constituencies were next redistributed, for the February 1974 general election, the area was included in the Stepney and Poplar seat.
Members of Parliament
MPs 1885–1918
| Election | Member | Party | |
|---|---|---|---|
| 1885 | John Charles Durant | Liberal | |
| 1886 | Frederick Wootton Isaacson | Conservative | |
| 1898 | W. C. Steadman | Liberal | |
| 1900 | William Evans-Gordon | Conservative | |
| 1907 | Frederick Leverton Harris | Conservative | |
| 1910 Dec. | William Glyn-Jones | Liberal | |
| 1918 | constituency abolished | ||
Elections
Elections in the 1970s
| Party | Candidate | Votes | % | ± | |
|---|---|---|---|---|---|
| Labour | Peter Shore | 18,993 | 74.8 | -1.3 | |
| Conservative | Harry Greenway | 4,922 | 19.4 | +2.8 | |
| Communist | Solly Kaye | 1,468 | 5.8 | -1.5 | |
| Majority | 14,071 | 55.4 | -4.1 | ||
| Turnout | 25,383 | 44.9 | -5.8 | ||
| Labour hold | Swing | ||||
Elections in the 1960s
| Party | Candidate | Votes | % | ± | |
|---|---|---|---|---|---|
| Labour | Peter Shore | 23,098 | 76.1 | +4.7 | |
| Conservative | Beryl Phyllis Cooper | 5,049 | 16.6 | -4.1 | |
| Communist | Solly Kaye | 2,209 | 7.3 | -0.6 | |
| Majority | 18,049 | 59.5 | +8.8 | ||
| Turnout | 30,356 | 50.7 | -0.6 | ||
| Labour hold | Swing | ||||
| Party | Candidate | Votes | % | ± | |
|---|---|---|---|---|---|
| Labour | Peter Shore | 22,184 | 71.4 | +0.7 | |
| Conservative | Ian F Hay Davison | 6,466 | 20.7 | -1.9 | |
| Communist | Solly Kaye | 2,454 | 7.9 | +1.2 | |
| Majority | 15,818 | 50.7 | +2.5 | ||
| Turnout | 31,104 | 51.3 | -7.9 | ||
| Labour hold | Swing | ||||
Elections in the 1950s
| Party | Candidate | Votes | % | ± | |
|---|---|---|---|---|---|
| Labour | Walter Edwards | 26,875 | 70.7 | -2.3 | |
| Conservative | P Brian Calwell | 8,566 | 22.6 | +7.5 | |
| Communist | Solly Kaye | 2,548 | 6.7 | -0.9 | |
| Majority | 18,309 | 48.2 | -9.7 | ||
| Turnout | 37,989 | 59.4 | +1.6 | ||
| Labour hold | Swing | ||||
| Party | Candidate | Votes | % | ± | |
|---|---|---|---|---|---|
| Labour | Walter Edwards | 27,677 | 73.0 | -3.5 | |
| Conservative | Lillian F Sutton | 5,733 | 15.1 | -1.1 | |
| Communist | Solly Kaye | 2,888 | 7.6 | +0.3 | |
| Liberal | Fred Winckless | 1,615 | 4.3 | New | |
| Majority | 21,944 | 57.9 | -2.4 | ||
| Turnout | 37,913 | 57.8 | -13.1 | ||
| Labour hold | Swing | ||||
| Party | Candidate | Votes | % | ± | |
|---|---|---|---|---|---|
| Labour | Walter Edwards | 35,849 | 76.5 | +6.5 | |
| Conservative | Martin Herbert Bernhard Solomon | 7,586 | 16.2 | +3.1 | |
| Communist | Ted Bramley | 3,436 | 7.3 | -5.2 | |
| Majority | 28,263 | 60.3 | +3.4 | ||
| Turnout | 46,871 | 70.9 | -1.6 | ||
| Labour hold | Swing | ||||
| Party | Candidate | Votes | % | ± | |
|---|---|---|---|---|---|
| Labour | Walter Edwards | 33,475 | 70.0 | N/A | |
| Conservative | M. H. B. Solomon | 6,238 | 13.1 | N/A | |
| Communist | Phil Piratin | 5,991 | 12.5 | N/A | |
| Liberal | J. H. Maynard | 2,105 | 4.4 | N/A | |
| Majority | 27,237 | 56.9 | N/A | ||
| Turnout | 47,809 | 72.5 | N/A | ||
| Labour hold | Swing | N/A | |||
Elections in the 1910s
| Party | Candidate | Votes | % | ± | |
|---|---|---|---|---|---|
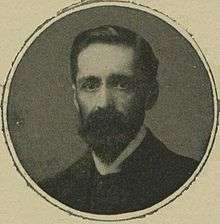
| Liberal | William Glyn-Jones | 1,926 | 51.5 | +4.5 | |
| Conservative | Walter Preston | 1,812 | 48.5 | −4.5 | |
| Majority | 114 | 3.0 | N/A | ||
| Turnout | 3,738 | 80.3 | −4.9 | ||
| Registered electors | 4,653 | ||||
| Liberal gain from Conservative | Swing | +4.5 | |||
| Party | Candidate | Votes | % | ± | |
|---|---|---|---|---|---|
| Conservative | Frederick Leverton Harris | 2,102 | 53.0 | −4.3 | |
| Liberal | William Glyn-Jones | 1,861 | 47.0 | +4.3 | |
| Majority | 241 | 6.0 | −8.6 | ||
| Turnout | 3,963 | 85.2 | +1.3 | ||
| Registered electors | 4,653 | ||||
| Conservative hold | Swing | −4.3 | |||
Elections in the 1900s
| Party | Candidate | Votes | % | ± | |
|---|---|---|---|---|---|
| Conservative | Frederick Leverton Harris | 2,299 | 63.0 | +5.7 | |
| Lib-Lab | Ben Cooper | 1,350 | 37.0 | −5.7 | |
| Majority | 949 | 26.0 | +11.4 | ||
| Turnout | 3,649 | 64.9 | −19.0 | ||
| Registered electors | 5,621 | ||||
| Conservative hold | Swing | +5.7 | |||
| Party | Candidate | Votes | % | ± | |
|---|---|---|---|---|---|
| Conservative | William Evans-Gordon | 2,490 | 57.3 | −4.5 | |
| Liberal | Durham Stokes | 1,853 | 42.7 | +4.5 | |
| Majority | 637 | 14.6 | −9.0 | ||
| Turnout | 4,343 | 83.9 | +7.3 | ||
| Registered electors | 5,176 | ||||
| Conservative hold | Swing | -4.5 | |||
| Party | Candidate | Votes | % | ± | |
|---|---|---|---|---|---|
| Conservative | William Evans-Gordon | 2,783 | 61.8 | +6.2 | |
| Lib-Lab | W. C. Steadman | 1,718 | 38.2 | −6.2 | |
| Majority | 1,065 | 23.6 | +12.4 | ||
| Turnout | 4,501 | 76.6 | +6.8 | ||
| Registered electors | 5,878 | ||||
| Conservative hold | Swing | +6.2 | |||
Elections in the 1890s
| Party | Candidate | Votes | % | ± | |
|---|---|---|---|---|---|
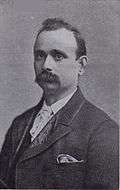
| Lib-Lab | W. C. Steadman | 2,492 | 50.2 | +5.8 | |
| Conservative | William Evans-Gordon | 2,472 | 49.8 | −5.8 | |
| Majority | 20 | 0.4 | N/A | ||
| Turnout | 4,964 | 77.7 | +7.9 | ||
| Registered electors | 6,387 | ||||
| Lib-Lab gain from Conservative | Swing | +5.8 | |||
| Party | Candidate | Votes | % | ± | |
|---|---|---|---|---|---|
| Conservative | Frederick Isaacson | 2,346 | 55.6 | +4.6 | |
| Liberal | Willoughby Dickinson | 1,876 | 44.4 | −4.6 | |
| Majority | 470 | 11.2 | +9.2 | ||
| Turnout | 4,222 | 69.8 | −4.3 | ||
| Registered electors | 6,048 | ||||
| Conservative hold | Swing | +4.6 | |||
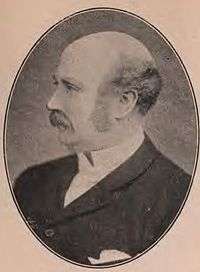
| Party | Candidate | Votes | % | ± | |
|---|---|---|---|---|---|
| Conservative | Frederick Isaacson | 2,292 | 51.0 | −5.3 | |
| Liberal | Benjamin Thomas Lindsay Thomson | 2,203 | 49.0 | +5.3 | |
| Majority | 89 | 2.0 | −10.6 | ||
| Turnout | 4,495 | 74.1 | +16.7 | ||
| Registered electors | 6,069 | ||||
| Conservative hold | Swing | -5.3 | |||
Elections in the 1880s
| Party | Candidate | Votes | % | ± | |
|---|---|---|---|---|---|
| Conservative | Frederick Isaacson | 2,237 | 56.3 | +6.4 | |
| Liberal | Robert Samuel Wright[6] | 1,735 | 43.7 | −6.4 | |
| Majority | 502 | 12.6 | N/A | ||
| Turnout | 3,972 | 57.4 | −1.5 | ||
| Registered electors | 6,925 | ||||
| Conservative gain from Liberal | Swing | +6.6 | |||
| Party | Candidate | Votes | % | ± | |
|---|---|---|---|---|---|
| Liberal | John Durant | 2,045 | 50.1 | N/A | |
| Conservative | Frederick Isaacson | 2,035 | 49.9 | N/A | |
| Majority | 10 | 0.2 | N/A | ||
| Turnout | 4,080 | 58.9 | N/A | ||
| Registered electors | 6,925 | ||||
| Liberal win (new seat) | |||||
The initial count for this election had Durant on 2,141 votes and Isaacson on 2,119 votes; a re-count then led to Durant on 2,052 votes and Isaacson on 2,051 votes. Further scrutiny then led to the above results.[5]
References
- "1964 Election results". grodt. Retrieved 27 March 2017.
- "1959 Election results". grodt. Retrieved 27 March 2017.
- "1955 Election results". grodt. Retrieved 27 March 2017.
- "1951 Election results". grodt. Retrieved 27 March 2017.
- Craig, FWS, ed. (1974). British Parliamentary Election Results: 1885-1918. London: Macmillan Press. ISBN 9781349022984.
- "Stepney Division". East London Observer. 14 August 1886. p. 4. Retrieved 11 December 2017 – via British Newspaper Archive.