Rossendale (UK Parliament constituency)
Rossendale was a parliamentary constituency in the Lancashire, England. Created in 1885, it elected one Member of Parliament (MP) to the House of Commons of the Parliament of the United Kingdom, elected by the first-past-the-post voting system. When created it comprised the districts of Rawtenstall, Bacup, and Haslingden; Ramsbottom district was added to the constituency in 1950.
| Rossendale | |
|---|---|
| Former County constituency for the House of Commons | |
 Rossendale in Lancashire, showing boundaries used from 1974-1983 | |
| County | Lancashire |
| Major settlements | Rawtenstall |
| 1885–1983 | |
| Number of members | One |
| Replaced by | Rossendale and Darwen Bury North |
| Created from | North East Lancashire |
The constituency ceased to exist with the implementation of the 1983 boundary changes and was replaced by the Rossendale and Darwen constituency. The exact nature of the changes were as follows: 9,882 electors of the Rossendale seat were transferred to Bury North. 25,918 electors were added from the abolished Darwen constituency and 5,267 from Heywood and Royton.
Boundaries
1885–1918: The Sessional Division of Rossendale, and part of the Borough of Bacup.
1918–1950: The Boroughs of Bacup, Haslingden, and Rawtenstall.
1950–1983: The Boroughs of Bacup, Haslingden, and Rawtenstall, and the Urban District of Ramsbottom.
Members of Parliament
Elections
Elections in the 1880s

| Party | Candidate | Votes | % | ± | |
|---|---|---|---|---|---|
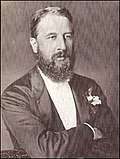
| Liberal | Spencer Cavendish | 6,060 | 58.9 | N/A | |
| Conservative | William Farrer Ecroyd | 4,228 | 41.1 | N/A | |
| Majority | 1,832 | 17.8 | N/A | ||
| Turnout | 10,288 | 89.9 | N/A | ||
| Registered electors | 11,450 | ||||
| Liberal win (new seat) | |||||
| Party | Candidate | Votes | % | ± | |
|---|---|---|---|---|---|
| Liberal Unionist | Spencer Cavendish | 5,399 | 57.8 | +16.7 | |
| Liberal | Thomas Newbigging | 3,949 | 42.2 | −16.7 | |
| Majority | 1,450 | 15.6 | N/A | ||
| Turnout | 9,348 | 81.6 | −8.3 | ||
| Registered electors | 11,450 | ||||
| Liberal Unionist gain from Liberal | Swing | +16.7 | |||
Elections in the 1890s
Cavendish succeeded to the peerage, becoming Duke of Devonshire and causing a by-election.
| Party | Candidate | Votes | % | ± | |
|---|---|---|---|---|---|
| Liberal | John Maden | 6,066 | 55.6 | +13.4 | |
| Liberal Unionist | Thomas Brooks | 4,841 | 44.4 | −13.4 | |
| Majority | 1,225 | 11.2 | N/A | ||
| Turnout | 10,907 | 93.4 | +11.8 | ||
| Registered electors | 11,679 | ||||
| Liberal gain from Liberal Unionist | Swing | +13.4 | |||
| Party | Candidate | Votes | % | ± | |
|---|---|---|---|---|---|
| Liberal | John Maden | 6,058 | 58.3 | +16.1 | |
| Conservative | Arthur Goldsmith Sparrow | 4,334 | 41.7 | −16.1 | |
| Majority | 1,724 | 16.6 | N/A | ||
| Turnout | 10,392 | 89.0 | +7.4 | ||
| Registered electors | 11,679 | ||||
| Liberal gain from Liberal Unionist | Swing | +16.1 | |||
| Party | Candidate | Votes | % | ± | |
|---|---|---|---|---|---|
| Liberal | John Maden | Unopposed | |||
| Liberal hold | |||||
Elections in the 1900s

| Party | Candidate | Votes | % | ± | |
|---|---|---|---|---|---|
| Liberal | William Mather | 5,936 | 56.5 | N/A | |
| Conservative | George Kingsbury | 4,564 | 43.5 | N/A | |
| Majority | 1,372 | 13.0 | N/A | ||
| Turnout | 10,500 | 86.4 | N/A | ||
| Registered electors | 12,148 | ||||
| Liberal hold | Swing | N/A | |||
| Party | Candidate | Votes | % | ± | |
|---|---|---|---|---|---|
| Liberal | William Mather | Unopposed | |||
| Liberal hold | |||||

| Party | Candidate | Votes | % | ± | |
|---|---|---|---|---|---|
| Liberal | Lewis Harcourt | Unopposed | |||
| Liberal hold | |||||
| Party | Candidate | Votes | % | ± | |
|---|---|---|---|---|---|
| Liberal | Lewis Harcourt | 6,881 | 59.6 | N/A | |
| Conservative | John Kebty-Fletcher | 4,662 | 40.4 | N/A | |
| Majority | 2,219 | 19.2 | N/A | ||
| Turnout | 11,543 | 90.4 | N/A | ||
| Registered electors | 12,765 | ||||
| Liberal hold | Swing | N/A | |||
Elections in the 1910s
| Party | Candidate | Votes | % | ± | |
|---|---|---|---|---|---|
| Liberal | Lewis Harcourt | 7,185 | 57.4 | −2.2 | |
| Conservative | John Kebty-Fletcher | 4,695 | 37.5 | −2.9 | |
| Women's Suffrage | Arthur Bulley | 639 | 5.1 | N/A | |
| Majority | 2,490 | 19.9 | +0.7 | ||
| Turnout | 12,519 | 94.7 | +4.3 | ||
| Registered electors | 13,217 | ||||
| Liberal hold | Swing | +0.4 | |||
| Party | Candidate | Votes | % | ± | |
|---|---|---|---|---|---|
| Liberal | Lewis Harcourt | 6,619 | 56.0 | −1.4 | |
| Conservative | Joshua Craven Hoyle | 5,206 | 44.0 | +6.5 | |
| Majority | 1,413 | 12.0 | −7.9 | ||
| Turnout | 11,825 | 89.5 | −5.2 | ||
| Registered electors | 13,217 | ||||
| Liberal hold | Swing | −4.0 | |||
General Election 1914/15: Another General Election was required to take place before the end of 1915. The political parties had been making preparations for an election to take place and by the July 1914, the following candidates had been selected;
- Liberal: Lewis Harcourt
- Unionist:
| Party | Candidate | Votes | % | ± | |
|---|---|---|---|---|---|
| Liberal | John Maden | 6,019 | 76.9 | +20.9 | |
| Independent Labour and Peace by Negotiation | Albert Taylor | 1,804 | 23.1 | N/A | |
| Majority | 4,215 | 53.8 | +41.8 | ||
| Turnout | 7,823 | 57.2 | −32.3 | ||
| Registered electors | 13,682 | ||||
| Liberal hold | Swing | N/A | |||
| Party | Candidate | Votes | % | ± | |
|---|---|---|---|---|---|
| C | Unionist | Robert Waddington | 8,907 | 39.2 | −4.8 |
| Labour | Gilbert Wright Jones | 7,984 | 35.1 | N/A | |
| Liberal | John Maden | 5,837 | 25.7 | −30.3 | |
| Majority | 923 | 4.1 | N/A | ||
| Turnout | 22,728 | 63.6 | −25.9 | ||
| Unionist gain from Liberal | Swing | +12.8 | |||
| C indicates candidate endorsed by the coalition government. | |||||
Elections in the 1920s
| Party | Candidate | Votes | % | ± | |
|---|---|---|---|---|---|
| Unionist | David Halstead | 12,881 | 42.6 | ||
| Labour | Gilbert Wright Jones | 11,029 | 36.5 | ||
| Liberal | Richard Durning Holt | 6,327 | 20.9 | ||
| Majority | 1,852 | 6.1 | |||
| Turnout | 85.0 | ||||
| Unionist hold | Swing | ||||

| Party | Candidate | Votes | % | ± | |
|---|---|---|---|---|---|
| Unionist | Robert Waddington | 11,362 | 37.6 | -5.0 | |
| Liberal | Ernest Young | 9,592 | 31.8 | +10.9 | |
| Labour | Norman Angell | 9,230 | 30.6 | -5.9 | |
| Majority | 1,770 | 5.8 | -0.3 | ||
| Turnout | 83.8 | -1.2 | |||
| Unionist hold | Swing | -8.0 | |||
| Party | Candidate | Votes | % | ± | |
|---|---|---|---|---|---|
| Unionist | Robert Waddington | 12,836 | 41.7 | ||
| Labour | James Bell | 9,951 | 32.4 | ||
| Liberal | Ernest Young | 7,958 | 25.9 | ||
| Majority | 2,885 | 9.3 | |||
| Turnout | |||||
| Unionist hold | Swing | ||||
| Party | Candidate | Votes | % | ± | |
|---|---|---|---|---|---|
| Labour | Arthur Law | 14,624 | 36.0 | +3.6 | |
| Liberal | Edwin Bayliss | 13,747 | 33.9 | +8.0 | |
| Unionist | Wilfrid Sugden | 12,225 | 30.1 | -11.6 | |
| Majority | 877 | 2.1 | 11.4 | ||
| Turnout | 87.7 | ||||
| Labour gain from Unionist | Swing | -2.2 | |||
- Furness Dean was Liberal candidate but withdrew at the last minute for health reasons.[19]
Elections in the 1930s
| Party | Candidate | Votes | % | ± | |
|---|---|---|---|---|---|
| Conservative | Ronald Cross | 16,206 | 40.1 | ||
| Liberal | William Furness Dean | 13,089 | 32.4 | ||
| Labour | Arthur Law | 11,135 | 27.5 | ||
| Majority | 3,117 | 7.7 | |||
| Turnout | 40,430 | 87.6 | |||
| Conservative gain from Labour | Swing | ||||
| Party | Candidate | Votes | % | ± | |
|---|---|---|---|---|---|
| Conservative | Ronald Cross | 15,650 | 39.4 | ||
| Labour | Evelyn Walkden | 14,769 | 37.1 | ||
| Liberal | Arthur Holgate | 9,343 | 23.5 | ||
| Majority | 881 | 2.2 | |||
| Turnout | 39,762 | 86.1 | |||
| Conservative hold | Swing | ||||
General Election 1939/40: Another General Election was required to take place before the end of 1940. The political parties had been making preparations for an election to take place and by the Autumn of 1939, the following candidates had been selected;
- Conservative: Ronald Cross
- Labour: George Walker[22]
Election in the 1940s
| Party | Candidate | Votes | % | ± | |
|---|---|---|---|---|---|
| Labour | George Walker | 15,741 | 43.6 | ||
| Conservative | Ronald Cross | 10,153 | 28.1 | ||
| Liberal | Arthur Ward Jones | 8,542 | 23.7 | ||
| Communist | William Whittaker | 1,663 | 4.6 | ||
| Majority | 5,588 | 15.5 | |||
| Turnout | 83.2 | ||||
| Labour gain from Conservative | Swing | ||||
Elections in the 1950s
| Party | Candidate | Votes | % | ± | |
|---|---|---|---|---|---|
| Labour | Tony Greenwood | 21,596 | 45.15 | ||
| Conservative | Thomas Mercer Backhouse | 19,483 | 40.73 | ||
| Liberal | LM Tomlinson | 6,757 | 14.13 | ||
| Majority | 2,113 | 4.42 | |||
| Turnout | 88.94 | ||||
| Labour hold | Swing | ||||
| Party | Candidate | Votes | % | ± | |
|---|---|---|---|---|---|
| Labour | Tony Greenwood | 24,814 | 51.74 | ||
| Conservative | Thomas Mercer Backhouse | 23,144 | 48.26 | ||
| Majority | 1,670 | 3.48 | |||
| Turnout | 88.59 | ||||
| Labour hold | Swing | ||||
| Party | Candidate | Votes | % | ± | |
|---|---|---|---|---|---|
| Labour | Tony Greenwood | 23,472 | 53.31 | ||
| Conservative | John E Parkinson | 20,561 | 46.69 | ||
| Majority | 2,911 | 6.61 | |||
| Turnout | 84.21 | ||||
| Labour hold | Swing | ||||
| Party | Candidate | Votes | % | ± | |
|---|---|---|---|---|---|
| Labour | Tony Greenwood | 20,743 | 47.52 | ||
| Conservative | James Richard Trist Holt | 18,152 | 41.59 | ||
| Liberal | Alan Cooper | 4,752 | 10.89 | ||
| Majority | 2,591 | 5.94 | |||
| Turnout | 86.30 | ||||
| Labour hold | Swing | ||||
Elections in the 1960s
| Party | Candidate | Votes | % | ± | |
|---|---|---|---|---|---|
| Labour | Tony Greenwood | 21,371 | 53.97 | ||
| Conservative | Colin Clive Baillieu | 18,230 | 46.03 | ||
| Majority | 3,141 | 7.93 | |||
| Turnout | 81.83 | ||||
| Labour hold | Swing | ||||
| Party | Candidate | Votes | % | ± | |
|---|---|---|---|---|---|
| Labour | Tony Greenwood | 21,093 | 55.40 | ||
| Conservative | Colin Clive Baillieu | 16,984 | 44.60 | ||
| Majority | 4,109 | 10.79 | |||
| Turnout | 80.40 | ||||
| Labour hold | Swing | ||||
Elections in the 1970s
| Party | Candidate | Votes | % | ± | |
|---|---|---|---|---|---|
| Conservative | Ronald Bray | 20,448 | 52.4 | ||
| Labour | Betty Boothroyd | 18,568 | 47.6 | ||
| Majority | 1,880 | 4.8 | |||
| Turnout | 78.2 | ||||
| Conservative gain from Labour | Swing | ||||
| Party | Candidate | Votes | % | ± | |
|---|---|---|---|---|---|
| Conservative | Ronald Bray | 16,040 | 38.4 | ||
| Labour | Michael Noble | 15,243 | 36.5 | ||
| Liberal | JA Hamilton | 10,478 | 25.09 | ||
| Majority | 797 | 1.91 | |||
| Turnout | 83.50 | ||||
| Conservative hold | Swing | ||||
| Party | Candidate | Votes | % | ± | |
|---|---|---|---|---|---|
| Labour | Michael Noble | 16,156 | 39.6 | ||
| Conservative | Ronald Bray | 15,953 | 39.1 | ||
| Liberal | J.A. Hamilton | 8,693 | 21.3 | ||
| Majority | 203 | 0.5 | |||
| Turnout | 40,802 | 80.9 | |||
| Labour gain from Conservative | Swing | ||||
| Party | Candidate | Votes | % | ± | |
|---|---|---|---|---|---|
| Conservative | David Trippier | 20,370 | 48.0 | +8.9 | |
| Labour | Michael Noble | 18,497 | 43.6 | +4.0 | |
| Liberal | P. Arnold | 3,534 | 8.3 | −13.0 | |
| Majority | 1,873 | 4.4 | |||
| Turnout | 42,401 | 83.8 | |||
| Conservative gain from Labour | Swing | ||||
References
- British parliamentary election results, 1885-1918 (Craig)
- British parliamentary election results, 1885-1918 (Craig)
- The Times, 25 January 1892 p7
- British parliamentary election results, 1885-1918 (Craig)
- British parliamentary election results, 1885-1918 (Craig)
- British parliamentary election results, 1885-1918 (Craig)
- The Times, 14 February 1900 p8
- British parliamentary election results, 1885-1918 (Craig)
- British parliamentary election results, 1885-1918 (Craig)
- British parliamentary election results, 1885-1918 (Craig)
- British parliamentary election results, 1885-1918 (Craig)
- The Times, 14 February 1917 p8
- British parliamentary election results, 1885-1918 (Craig)
- British Parliamentary Election Results 1918-1949, FWS Craig
- British Parliamentary Election Results 1918-1949, F W S Craig
- British Parliamentary Election Results 1918-1949, FWS Craig
- British Parliamentary Election Results 1918-1949, F W S Craig
- British Parliamentary Election Results 1918-1949, F W S Craig
- The Times House of Commons, 1931
- British Parliamentary Election Results 1918-1949, FWS Craig
- British Parliamentary Election Results 1918-1949, FWS Craig
- Report of the Annual Conference of the Labour Party, 1939
- British Parliamentary Election Results 1918-1949, F W S Craig