Regional District of Fraser-Fort George
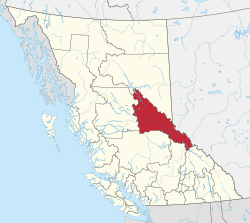
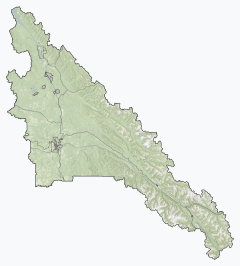
The Regional District of Fraser-Fort George (RDFFG) is a regional district located in the Central Interior of British Columbia. It is bounded by the Alberta border to the east, the Columbia-Shuswap and Thompson-Nicola Regional Districts to the south/southeast, Cariboo Regional District to the southwest, the Regional District of Bulkley-Nechako to the west, and the Peace River Regional District to the north/northeast. As of the Canada 2011 Census, the Regional District had a population of 91,879, and a land area of 51,083.73 km² (19,723.54 sq mi). The offices of the Regional District are located at Prince George.
Fraser-Fort George | |
|---|---|
| Regional District of Fraser-Fort George | |
 Upper Fraser River | |
Logo | |
Major communities | |
 Location in British Columbia | |
| Country | Canada |
| Province | British Columbia |
| Office location | Prince George |
| Government | |
| • Type | Regional district |
| • Body | Board of Directors |
| • Chair | Art Kaehn (E) |
| • Vice Chair | Lara Beckett (C) |
| • Electoral Areas |
|
| Area | |
| • Land | 50,676.10 km2 (19,566.15 sq mi) |
| Population (2016)[2] | |
| • Total | 94,506 |
| • Density | 1.86/km2 (4.8/sq mi) |
| Website | rdffg.bc.ca |
Communities
Cities
District Municipality
Villages
- McBride
- Valemount
Regional District Electoral Areas
- Fraser-Fort George A - Salmon River–Lakes
- Fraser-Fort George C - Chilako River-Nechako
- Fraser-Fort George D - Tabor Lake-Stone Creek
- Fraser-Fort George E - Woodpecker-Hixon
- Fraser-Fort George F - Willow River-Upper Fraser
- Fraser-Fort George G - Crooked River-Parsnip
- Fraser-Fort George H - Robson Valley-Canoe
Indian Reserves
NB Indian Reserves are not part of municipal or regional district governance and are outside the regional district's jurisdiction, and also counted separately in the census figures.
- Fort George (Shelley) Indian Reserve No. 2
- McLeod Lake Indian Reserve No. 1
- Parsnip Indian Reserve No. 5
Demographics
| Ethnic groups in Fraser-Fort George RD (2016) Source: | Population | % | |
|---|---|---|---|
| Ethnic group | European | 69,660 | 75% |
| Aboriginal | 13,785 | 14.8% | |
| South Asian | 2,640 | 2.8% | |
| Filipino | 1,180 | 1.3% | |
| Chinese | 965 | 1% | |
| Black | 755 | 0.8% | |
| Southeast Asian | 280 | 0.3% | |
| Latin American | 275 | 0.3% | |
| Japanese | 255 | 0.3% | |
| Korean | 170 | 0.2% | |
| Arab | 130 | 0.1% | |
| West Asian | 85 | 0.1% | |
| Multiple minorities | 150 | 0.2% | |
| Visible minority, n.i.e. | 90 | 0.1% | |
| Total population | 94,506 | 100% | |
(Statistics Canada, 2011)
- Population: 91,879 (39,237 private dwellings)
References
- "Board of Directors". Retrieved 2019-07-09.

