RTS Index
The RTS Index "Russia Trading System" (abbreviated: RTSI, Russian: Индекс РТС) is a free-float capitalization-weighted index of 50 Russian stocks traded on the Moscow Exchange, calculated in the US dollars. The list of stocks is reviewed every three months.
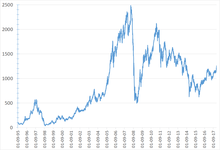
The RTS Index value is calculated in a real-time mode. The index was introduced on September 1, 1995 with a base value of 100.[1] The RTSI peaked on 19 May 2008 at 2,498.10 points, and fell to 492.59 on 23 January 2009; on 29 December 2017 the RTS Index closed at 1,154.43.
In addition to the RTS Index, Moscow Exchange also computes and publishes the RTS Standard Index (RTSSTD), RTS-2 Index, RTS Siberia Index and seven sectoral indexes (Telecommunication, Financial, Metals & Mining, Oil & Gas, Industrial, Consumer & Retail, and Electric Utilities). The RTS Standard and RTS-2 are compiled similarly to the RTS Index, from a list of top 15 large-cap stocks and 50+ second-tier stocks, respectively.
Annual Returns
The following table shows the annual development of the RTS Index since 1995.[2][3]
| Year | Closing level | Change in Index in points |
Change in Index in % |
|---|---|---|---|
| 1995 | 82.92 | ||
| 1996 | 200.50 | 117.58 | 141.80 |
| 1997 | 396.86 | 196.36 | 97.94 |
| 1998 | 58.93 | −337.93 | −85.15 |
| 1999 | 175.26 | 116.33 | 197.40 |
| 2000 | 143.29 | −31.97 | −18.24 |
| 2001 | 260.05 | 116.76 | 81.49 |
| 2002 | 359.07 | 99.02 | 38.08 |
| 2003 | 567.25 | 208.18 | 57.98 |
| 2004 | 614.11 | 46.86 | 8.26 |
| 2005 | 1,125.60 | 511.49 | 83.29 |
| 2006 | 1,921.92 | 796.32 | 70.75 |
| 2007 | 2,290.51 | 368.59 | 19.18 |
| 2008 | 631.89 | −1,658.62 | −72.41 |
| 2009 | 1,444.61 | 812.72 | 128.62 |
| 2010 | 1.770.26 | 325.65 | 22.54 |
| 2011 | 1,380.49 | −389.77 | −22.02 |
| 2012 | 1,530.41 | 149.92 | 10.61 |
| 2013 | 1,442.73 | −87.68 | −5.73 |
| 2014 | 790.71 | −652.02 | −45.19 |
| 2015 | 757.04 | −33.67 | −4.26 |
| 2016 | 1,152.33 | 395.29 | 52.22 |
| 2017 | 1,154.43 | 2.10 | 0.18 |
| 2018 | 1,066.13 | −88.30 | −7.65 |
| 2019 | 1,548.92 | 482.79 | 45.82 |
Components
From September 22, 2017 the composition of the RTS Index is the following:[4]
See also
References
- RTS Index Facts via Wikinvest
- "Historical data: RTS Index USD - Russia (^RTS)".
- "RTS Index (RTSI.ME) Historical Data - Yahoo Finance". finance.yahoo.com. Retrieved 2020-01-21.
- "Moscow Exchange Indices Constituents (MICEX and RTS Indices) valid from March 17, 2017". Moscow Exchange.