Opinion polling for the 1979 United Kingdom general election
In the run-up to the 1979 United Kingdom general election, various organisations carry out opinion polling to gauge voting intention. Results of such polls are displayed in this article.
The date range for these opinion polls are from the October 1974 general election until 3 May 1979.
Graphical summaries
The chart below depicts opinion polls conducted for the 1979 United Kingdom general election using a 15-poll moving average.
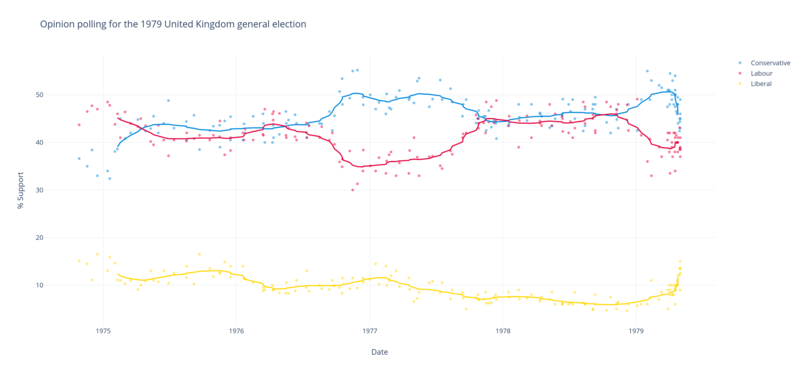
Conservatives
Labour
Liberals
National Poll Results
All data is from UK Polling Report.[1]
1979
| Survey End Date | Polling Organisation/Client | Con | Lab | Lib | Lead |
|---|---|---|---|---|---|
| 3 May | General election results | 43.9% | 36.9% | 13.8% | 7% |
| 2 May | Gallup/Telegraph | 49% | 38.5% | 9% | 10.5% |
| 2 May | NOP/Daily Mail | 46% | 39% | 12.5% | 7% |
| 2 May | Gallup/Telegraph | 43% | 41% | 13.5% | 2% |
| 2 May | MORI/Evening Standard | 45% | 37% | 15% | 8% |
| 1 May | MORI/Express | 44.4% | 38.8% | 13.5% | 5.6% |
| 1 May | Marplan/Sun | 45% | 38.5% | 9% | 6.5% |
| 30 Apr | NOP/Daily Mail | 42.4% | 43.1% | 12.2% | 0.7% |
| 26 Apr | MORI/Express | 44% | 41% | 12% | 3% |
| 25 Apr | Gallup/Sunday Telegraph | 48% | 40% | 10.5% | 8% |
| 25 Apr | Research Srv/Observer | 49.5% | 38% | 10% | 11.5% |
| 25 Apr | Marplan/Sun | 48% | 40% | 10% | 8% |
| 23 Apr | MORI/Express | 46% | 40% | 11% | 6% |
| 21 Apr | Gallup/Telegraph | 46.5% | 41.5% | 10% | 5% |
| 19 Apr | Marplan/Sun | 50% | 40% | 9% | 10% |
| 18 Apr | Gallup/Sunday Telegraph | 47.5% | 42% | 9% | 5.5% |
| 18 Apr | Marplan/Sun | 51% | 41% | 6% | 10% |
| 18 Apr | Research Srv/Observer | 54% | 34% | 9.5% | 20% |
| 17 Apr | MORI/Express | 50% | 38% | 10% | 12% |
| 14 Apr | NOP/Daily Mail | 48% | 42% | 8% | 6% |
| 11 Apr | Research Srv/Observer | 53% | 37% | 8% | 16% |
| 9 Apr | Gallup/Telegraph | 50% | 40% | 8% | 10% |
| 9 Apr | MORI/Express | 49% | 39% | 10% | 10% |
| 4 Apr | Research Srv/Observer | 54.5% | 33.5% | 9% | 21% |
| 3 Apr | NOP/Daily Mail | 48% | 42% | 8% | 6% |
| 2 Apr | MORI/Express | 51% | 38% | 10% | 13% |
| 29 Mar | MORI/Thames | 51% | 42% | 5% | 9% |
| 28 Mar | Gallup/Telegraph | 47.5% | 40.5% | 9% | 7% |
| 12 Mar | Gallup/Telegraph | 51.5% | 37% | 8.5% | 14.5% |
| 5 Mar | MORI | 52% | 39% | 7% | 13% |
| 12 Feb | Gallup/Telegraph | 53% | 33% | 11% | 20% |
| 8 Feb | NOP | 49% | 40.7% | 7.4% | 8.3% |
| 1 Feb | MORI | 55% | 36% | 6% | 19% |
| 15 Jan | Gallup/Telegraph | 49% | 41.5% | 6% | 7.5% |
| 4 Jan | NOP | 42.5% | 49.1% | 5.7% | 6.6% |
1978
| Survey End Date | Polling Organisation/Client | Con | Lab | Lib | Lead |
|---|---|---|---|---|---|
| 11 Dec | Gallup/Telegraph | 48% | 42.5% | 6% | 5.5% |
| 7 Dec | NOP | 44.7% | 47.9% | 4.6% | 3.2% |
| 13 Nov | Gallup/Telegraph | 43% | 48% | 6.5% | 5% |
| 9 Nov | NOP | 44.8% | 46.8% | 6.2% | 2% |
| 8 Nov | MORI | 47% | 46% | 5% | 1% |
| 23 Oct | Gallup/Telegraph | 42% | 47.5% | 7.5% | 5.5% |
| 12 Oct | NOP | 44.2% | 48.5% | 4.7% | 4.3% |
1977
1976
1975
1974
gollark: --choose 100 bee uncounterbee
gollark: --choose 100 bee counterbee
gollark: -- is the test instance of ABR.
gollark: --choose 100 bee counterbee
gollark: --choose 100 bee counterbee
References
- "UK Polling Report". ukpollingreport.co.uk. Retrieved 2019-12-16.
| General elections | |||||||||
|---|---|---|---|---|---|---|---|---|---|
| Leadership approval | |||||||||
| European elections | |||||||||
| Referendums |
| ||||||||
| Issues | |||||||||
| Devolved legislatures |
| ||||||||
This article is issued from Wikipedia. The text is licensed under Creative Commons - Attribution - Sharealike. Additional terms may apply for the media files.