Oklahoma's 5th congressional district
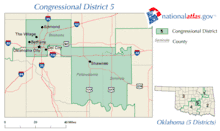
Oklahoma's 5th congressional district is a congressional district in the U.S. state of Oklahoma. It borders all of the other congressional districts in the state except the 1st district. It is densely populated and covers almost all of Oklahoma County (except a small sliver located in the 4th district) and all of Pottawatomie and Seminole counties.
| Oklahoma's 5th congressional district | |||
|---|---|---|---|
.tif.png) Oklahoma's 5th congressional district - since January 3, 2013. | |||
| Representative |
| ||
| Area | 2,073.9[1] sq mi (5,371 km2) | ||
| Distribution |
| ||
| Population (2017) | 818,162[2] | ||
| Median income | $50,441[3] | ||
| Ethnicity |
| ||
| Cook PVI | R+10[4] | ||
Principal cities in the district include Oklahoma City (the state capital), Edmond, Shawnee, and Seminole.
The district is currently represented by Democrat Kendra Horn. In 2018, Horn defeated Republican Steve Russell in his second bid for reelection, marking the first time a Democrat had won the seat in 44 years.[5]
History
Prior to the opening of the 116th Congress on January 3, 2019, the district had been held by a Republican since January 23, 1975, when Democrat John Jarman changed political parties.[6] Before Jarman, the seat had leaned Democratic since 1931.
Donald Trump received 53.2 percent of the vote in this district in 2016.
Kendra Horn received 50.7 percent of the vote in 2018.
Demographics
According to the 2000 Census, the district is 87.53 percent urban, 26.17 percent non-white, and has a population that is 8.26 percent Latino and 6.76 percent foreign-born.[7] Only 2.74 percent of adults working in the district commute using public transportation, on a bike or on foot. 8.49 percent of adults aged 25 and older in the district have a Master's, PhD or Professional Degree.[7]
Recent election results from state-wide races
| Year | Office | District winner and results |
|---|---|---|
| 2000 | President | Bush 62% - 38% |
| 2004 | President | Bush 64% - 36% |
| 2008 | President | McCain 59% - 41% |
| 2012 | President | Romney 59.2% - 40.8% |
| 2016 | President | Trump 53.2% - 39.8%[8] |
List of members representing the district
| Name | Party | Years | Congress | Electoral history |
|---|---|---|---|---|
| District created | November 16, 1907 | |||
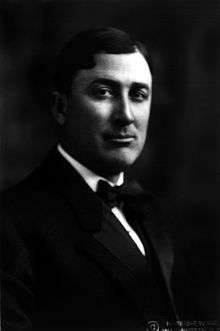 Scott Ferris |
Democratic | November 16, 1907 – March 3, 1915 |
60th 61st 62nd 63rd |
Elected in 1907. Re-elected in 1908. Re-elected in 1910. Re-elected in 1912. Redistricted to the 6th district. |
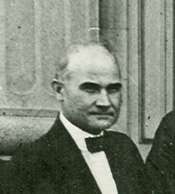 Joseph Bryan Thompson |
Democratic | March 4, 1915 – September 18, 1919 |
64th 65th 66th |
Redistricted from the at-large district and re-elected in 1914. Re-elected in 1916. Re-elected in 1918. Died. |
| Vacant | September 18, 1919 – November 8, 1919 | |||
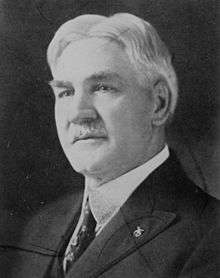 John W. Harreld |
Republican | November 8, 1919 – March 3, 1921 |
66th | Elected to finish Thompson's term Retired to run for U.S. Senator. |
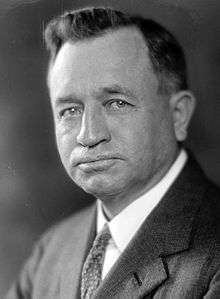 Fletcher B. Swank |
Democratic | March 4, 1921 – March 3, 1929 |
67th 68th 69th 70th |
Elected in 1920. Re-elected in 1922. Re-elected in 1924. Re-elected in 1926. Lost re-election. |
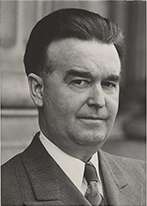 Ulysses S. Stone |
Republican | March 4, 1929 – March 3, 1931 |
71st | Elected in 1928. Lost re-election. |
 Fletcher B. Swank |
Democratic | March 4, 1931 – January 3, 1935 |
72nd 73rd |
Elected again in 1930. Re-elected in 1932. Lost renomination. |
 Joshua B. Lee |
Democratic | January 3, 1935 – January 3, 1937 |
74th | Elected in 1934. Retired. |
.jpg) Robert P. Hill |
Democratic | January 3, 1937 – October 29, 1937 |
75th | Elected in 1936. Died. |
| Vacant | October 29, 1937 – December 10, 1937 | |||
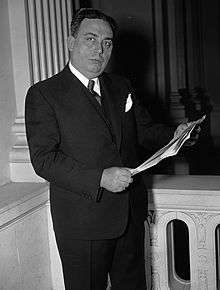 Gomer Griffith Smith |
Democratic | December 10, 1937 – January 3, 1939 |
75th | Elected to finish Hill's term.[9] Retired. |
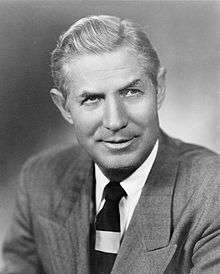 Mike Monroney |
Democratic | January 3, 1939 – January 3, 1951 |
76th 77th 78th 79th 80th 81st |
Elected in 1938. Re-elected in 1940. Re-elected in 1942. Re-elected in 1944. Re-elected in 1946. Re-elected in 1948. Retired to run for U.S. Senator. |
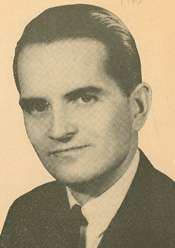 John Jarman |
Democratic | January 3, 1951 – January 3, 1975 |
82nd 83rd 84th 85th 86th 87th 88th 89th 90th 91st 92nd 93rd |
Elected in 1950. Re-elected in 1952. Re-elected in 1954. Re-elected in 1956. Re-elected in 1958. Re-elected in 1960. Re-elected in 1962. Re-elected in 1964. Re-elected in 1966. Re-elected in 1968. Re-elected in 1970. Re-elected in 1972. Re-elected in 1974. Retired. |
| Republican | January 24, 1975 – January 3, 1977 | |||
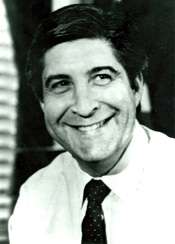 Mickey Edwards |
Republican | January 3, 1977 – January 3, 1993 |
95th 96th 97th 98th 99th 100th 101st 102nd |
Elected in 1976. Re-elected in 1978. Re-elected in 1980. Re-elected in 1982. Re-elected in 1984. Re-elected in 1986. Re-elected in 1988. Re-elected in 1990. Lost renomination. |
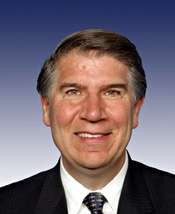 Ernest Istook |
Republican | January 3, 1993 – January 3, 2007 |
103rd 104th 105th 106th 107th 108th 109th |
Elected in 1992. Re-elected in 1994. Re-elected in 1996. Re-elected in 1998. Re-elected in 2000. Re-elected in 2002. Re-elected in 2004. Retired to run for Governor of Oklahoma. |
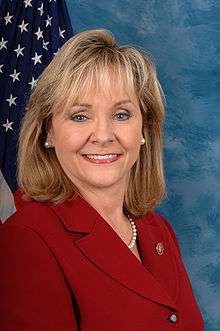 Mary Fallin |
Republican | January 3, 2007 – January 3, 2011 |
110th 111th |
Elected in 2006. Re-elected in 2008. Retired to run for Governor of Oklahoma. |
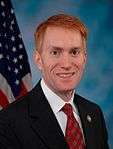 James Lankford |
Republican | January 3, 2011 – January 3, 2015 |
112th 113th |
Elected in 2010. Re-elected in 2012. Retired to run for U.S. Senator. |
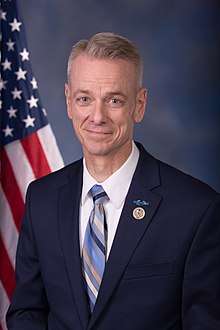 Steve Russell |
Republican | January 3, 2015 – January 3, 2019 |
114th 115th |
Elected in 2014. Re-elected in 2016. Lost re-election. |
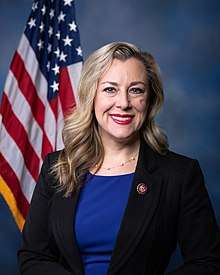 Kendra Horn |
Democratic | January 3, 2019 – present |
116th | Elected in 2018. |
Historical district boundaries
Recent election results
2006
| Party | Candidate | Votes | % | |
|---|---|---|---|---|
| Republican | Mary Fallin | 108,936 | 60.38 | |
| Democratic | David Hunter | 67,293 | 37.30 | |
| Independent | Matthew Horton Woodson | 4,196 | 2.33 | |
| Total votes | 180,425 | 100.00 | ||
| Republican hold | ||||
2008
| Party | Candidate | Votes | % | |
|---|---|---|---|---|
| Republican | Mary Fallin (incumbent) | 171,925 | 65.89 | |
| Democratic | Steven L. Perry | 88,996 | 34.11 | |
| Total votes | 260,921 | 100.00 | ||
| Republican hold | ||||
2010
| Party | Candidate | Votes | % | |
|---|---|---|---|---|
| Republican | James Lankford | 123,236 | 62.53 | |
| Democratic | Billy Coyle | 68,074 | 34.53 | |
| Independent | Clark Duffe | 3,067 | 1.56 | |
| Independent | Dave White | 2,728 | 1.38 | |
| Total votes | 197,105 | 100 | ||
| Republican hold | ||||
2012
| Party | Candidate | Votes | % | |
|---|---|---|---|---|
| Republican | James Lankford (incumbent) | 153,603 | 58.7 | |
| Democratic | Tom Guild | 97,504 | 37.3 | |
| Modern Whig | Pat Martin | 5,394 | 2.1 | |
| Libertarian | Robert T. Murphy | 5,176 | 2.0 | |
| Total votes | 261,677 | 100.0 | ||
| Republican hold | ||||
2014
| Party | Candidate | Votes | % | |
|---|---|---|---|---|
| Republican | Steve Russell | 95,632 | 60.1 | |
| Democratic | Al McAffrey | 57,790 | 36.3 | |
| Independent | Robert T. Murphy | 2,176 | 1.4 | |
| Independent | Tom Boggs | 2,065 | 1.3 | |
| Independent | Buddy Ray | 1,470 | 0.9 | |
| Total votes | 159,133 | 100.0 | ||
| Republican hold | ||||
2016
| Party | Candidate | Votes | % | |
|---|---|---|---|---|
| Republican | Steve Russell (incumbent) | 160,184 | 57.1 | |
| Democratic | Al McAffrey | 103,273 | 36.8 | |
| Libertarian | Zachary Knight | 17,113 | 6.1 | |
| Total votes | 280,570 | 100.0 | ||
| Republican hold | ||||
2018
| Party | Candidate | Votes | % | |
|---|---|---|---|---|
| Democratic | Kendra Horn | 121,149 | 50.7 | |
| Republican | Steve Russell (incumbent) | 117,811 | 49.3 | |
| Total votes | 238,960 | 100.0 | ||
| Democratic gain from Republican | ||||
References
- https://www2.census.gov/geo/maps/cong_dist/cd113/cd_based/ST40/CD113_OK05.pdf
- https://www.census.gov/mycd/?st=40&cd=05
- https://www.census.gov/mycd/?st=40&cd=05
- "Partisan Voting Index – Districts of the 115th Congress" (PDF). The Cook Political Report. April 7, 2017. Retrieved April 7, 2017.
- "Kendra Horn upsets Steve Russell in an Oklahoma City stunner". NewsOK.com. November 6, 2018. Retrieved November 6, 2018.
- "Congressman leaves Democratic Party". Lodi News-Sentinel. Google News Archives. United Press International. January 24, 1975. p. 9.
- Rep. Mary Fallin: District Demographics, That's My Congress (accessed May 11, 2010).
- https://www.dailykos.com/stories/2012/11/19/1163009/-Daily-Kos-Elections-presidential-results-by-congressional-district-for-the-2012-2008-elections
- http://bioguide.congress.gov/scripts/biodisplay.pl?index=S000543
- "Official Results - Federal, State, Legislative and Judicial Races - General Election — November 6, 2012". Oklahoma State Election Board. November 6, 2012. Retrieved October 15, 2019.
- "Official Results - Federal, State, Legislative and Judicial Races - General Election — November 4, 2014". Oklahoma State Election Board. November 4, 2014. Retrieved January 6, 2015.
- "Official Results - General Election — November 8, 2016". Oklahoma State Election Board. November 8, 2016. Retrieved December 1, 2016.
- "Official Results - General Election — November 6, 2018" (PDF). Oklahoma State Election Board. November 6, 2018. Retrieved October 15, 2019.
- Martis, Kenneth C. (1989). The Historical Atlas of Political Parties in the United States Congress. New York: Macmillan Publishing Company.
- Martis, Kenneth C. (1982). The Historical Atlas of United States Congressional Districts. New York: Macmillan Publishing Company.
- Congressional Biographical Directory of the United States 1774–present