Mont-Joli
Mont-Joli is a city in the La Mitis Regional County Municipality within the Bas-Saint-Laurent region of Quebec, Canada. It is the county seat. The city is located east of Rimouski near the south shore of the Saint Lawrence River.
Mont-Joli | |
|---|---|
City | |
 | |
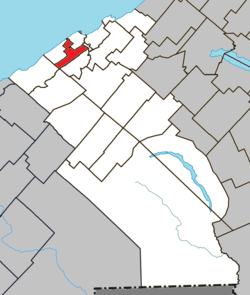 Location within La Mitis RCM | |
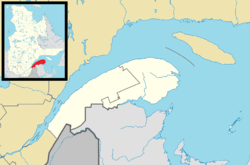 Mont-Joli Location in eastern Quebec | |
| Coordinates: 48.58°N 68.18°W[1] | |
| Country | |
| Province | |
| Region | Bas-Saint-Laurent |
| RCM | La Mitis |
| Constituted | 13 June 2001 |
| Government | |
| • Mayor | Martin Soucy |
| • Federal riding | Avignon—La Mitis—Matane—Matapédia |
| • Prov. riding | Matane-Matapédia |
| Area | |
| • Total | 24.30 km2 (9.38 sq mi) |
| • Land | 24.45 km2 (9.44 sq mi) |
| There is an apparent contradiction between two authoritative sources | |
| Elevation | 75 m (246 ft) |
| Population (2016)[3] | |
| • Total | 6,281 |
| • Density | 272.6/km2 (706/sq mi) |
| • Pop 2011–2016 | |
| • Dwellings | 3,138 |
| Time zone | UTC−5 (EST) |
| • Summer (DST) | UTC−4 (EDT) |
| Postal code(s) | G5H 1W8 |
| Area code(s) | 418 and 581 |
| Highways | |
| Website | www |
History
In 1867, the main condition for New Brunswick and Nova-Scotia entering into the Canadian Confederation was, to be linked to the rest of the country by the railway. In 1868, work began on the Intercolonial Railway and the authorities decided to have the railway turn at Saint-Octave-de-Métis in Gaspésie. However, this village, because of its rugged landscape, was not suitable to receive the train station and maintenance shops. The engineers turned to the higher 2nd farming rank of Sainte-Flavie, and the train station was named Sainte-Flavie-Station. In 1880, Sainte-Flavie-Station became separate and was named Mont-Joli, the name which the first settlers had used to describe the area.
On 13 June 2001, the neighbouring municipality of Saint-Jean-Baptiste (not to be confused with a different Saint-Jean-Baptiste in the Montérégie region) merged with Mont-Joli.[4]
Demographics
According to the Canada 2011 Census:
- Population: 6 281
- % Change (2011–2016): -5.8
- Dwellings: 3,138
- Area (km²): 24.455 km²
- Density (persons per km²): 272.6
Transportation
Mont-Joli is the easternmost end of Autoroute 20, whose segment connects with the city of Rimouski. Route 132 runs through the centre of Mont-Joli as part of a loop that circumnavigates the Gaspé Peninsula; it is about 3 km (2 mi) southeast of Sainte-Flavie, where Route 132 intersects with itself.
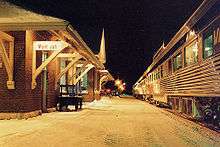
Mont-Joli Airport is the only airport with scheduled service in the Bas-Saint-Laurent region. Mont-Joli is also served by the Mont-Joli railway station.
Notables
- Joseph-Adalbert Landry: One of the inventors of the snowauto, patented in 1923
- Bertrand Dandonneau: Inventor of tights
- René Dupéré: Composer for Cirque du Soleil
- Robert Piché: Airline pilot in Mont-Joli, involved in the 236 Air Transat incident
- Donald Dufresne: Ex-NHL hockey player and assistant manager to the Rimouski Océanic
- Pierre Labrie: Writer
- Micheline Morisset: Writer
- Gervais Rioux: Olympic cyclist (Seoul, 1988)
- Gaétan D'Amours: Mr. Québec 1960, Mr. Canada 1961, Mr. America 1961, Mr. Universe 1967 (5th place)
- Claudine Desrosiers: Researcher for worker relations
- Jacques Lelièvre: Karting pilot
- Danielle Doyer: Politician
- Tommy Gagnon: Musician, music group Delta 20
- Maurice Lamontagne: Economist and Canadian Senator
Climate
| Climate data for Mont Joli | |||||||||||||
|---|---|---|---|---|---|---|---|---|---|---|---|---|---|
| Month | Jan | Feb | Mar | Apr | May | Jun | Jul | Aug | Sep | Oct | Nov | Dec | Year |
| Record high °C (°F) | 13.0 (55.4) |
12.4 (54.3) |
20.0 (68.0) |
29.1 (84.4) |
33.3 (91.9) |
35.1 (95.2) |
35.9 (96.6) |
33.3 (91.9) |
32.2 (90.0) |
26.7 (80.1) |
21.8 (71.2) |
16.7 (62.1) |
35.9 (96.6) |
| Average high °C (°F) | −7.9 (17.8) |
−6.1 (21.0) |
−0.9 (30.4) |
5.9 (42.6) |
13.6 (56.5) |
19.8 (67.6) |
22.6 (72.7) |
21.6 (70.9) |
16.7 (62.1) |
9.5 (49.1) |
2.7 (36.9) |
−3.7 (25.3) |
7.8 (46.1) |
| Daily mean °C (°F) | −12.2 (10.0) |
−10.5 (13.1) |
−4.9 (23.2) |
2.0 (35.6) |
8.6 (47.5) |
14.4 (57.9) |
17.5 (63.5) |
16.5 (61.7) |
12.1 (53.8) |
5.8 (42.4) |
−0.4 (31.3) |
−7.3 (18.9) |
3.5 (38.2) |
| Average low °C (°F) | −16.5 (2.3) |
−14.9 (5.2) |
−8.9 (16.0) |
−2.0 (28.4) |
3.5 (38.3) |
9.0 (48.2) |
12.3 (54.1) |
11.5 (52.7) |
7.4 (45.3) |
2.0 (35.6) |
−3.5 (25.7) |
−10.8 (12.6) |
−0.9 (30.4) |
| Record low °C (°F) | −33.3 (−27.9) |
−31.1 (−24.0) |
−29.4 (−20.9) |
−19.9 (−3.8) |
−12.2 (10.0) |
−1.1 (30.0) |
0.8 (33.4) |
1.8 (35.2) |
−5.0 (23.0) |
−8.4 (16.9) |
−18.3 (−0.9) |
−30.6 (−23.1) |
−33.3 (−27.9) |
| Average precipitation mm (inches) | 76.0 (2.99) |
60.1 (2.37) |
62.2 (2.45) |
59.7 (2.35) |
84.4 (3.32) |
81.9 (3.22) |
88.3 (3.48) |
89.9 (3.54) |
78.6 (3.09) |
86.6 (3.41) |
83.3 (3.28) |
82.2 (3.24) |
933.2 (36.74) |
| Average rainfall mm (inches) | 7.7 (0.30) |
6.4 (0.25) |
12.8 (0.50) |
36.9 (1.45) |
82.3 (3.24) |
81.9 (3.22) |
88.3 (3.48) |
89.9 (3.54) |
78.6 (3.09) |
82.7 (3.26) |
47.6 (1.87) |
17.0 (0.67) |
632.1 (24.87) |
| Average snowfall cm (inches) | 76.2 (30.0) |
60.0 (23.6) |
52.6 (20.7) |
23.3 (9.2) |
2.0 (0.8) |
0.0 (0.0) |
0.0 (0.0) |
0.0 (0.0) |
0.0 (0.0) |
4.3 (1.7) |
36.4 (14.3) |
69.8 (27.5) |
324.6 (127.8) |
| Average precipitation days (≥ 0.2 mm) | 20.1 | 15.5 | 14.3 | 12.4 | 14.0 | 12.7 | 13.5 | 12.7 | 12.4 | 14.7 | 15.3 | 19.0 | 176.6 |
| Average rainy days (≥ 0.2 mm) | 2.1 | 1.5 | 3.6 | 8.6 | 13.8 | 12.7 | 13.5 | 12.7 | 12.4 | 14.0 | 8.7 | 3.3 | 106.9 |
| Average snowy days (≥ 0.2 cm) | 19.6 | 14.8 | 12.3 | 6.1 | 0.75 | 0.0 | 0.0 | 0.0 | 0.0 | 1.6 | 9.1 | 17.8 | 82.05 |
| Source: Environment Canada[5] | |||||||||||||
See also
- List of cities in Quebec
References
- Reference number 79930 of the Commission de toponymie du Québec (in French)
- Geographic code 09077 in the official Répertoire des municipalités (in French)
- "(Code 2409077) Census Profile". 2011 census. Statistics Canada. 2012.
- http://www.toponymie.gouv.qc.ca/ct/ToposWeb/fiche.aspx?no_seq=56863
- Environment Canada Canadian Climate Normals 1981–2010, accessed 18 November 2019
External links
| Wikimedia Commons has media related to Mont-Joli. |
Adjacent Municipal Subdivisions | ||||||||||
|---|---|---|---|---|---|---|---|---|---|---|
| ||||||||||
| Cities & Towns | |
|---|---|
| Municipalities |
|
| Parishes |
|
| Villages | |
| Unorganized territories | |
| |
| Authority control |
|
|---|