List of Parliamentary constituencies in Wales
Wales is divided into forty Parliamentary constituencies which elect Members of Parliament to the House of Commons of the United Kingdom. After the General Election of December 2019, 22 of the Welsh constituencies are represented by Labour MPs, 14 by Conservative MPs, and 4 by Plaid Cymru MPs. [1]
The same constituencies are used for elections to the Welsh Parliament. The same boundaries make up the National Assembly for Wales constituencies.
Constituencies
‡Labour †Conservative ₪Plaid Cymru ¤Liberal Democrat *Brexit Party
| Constituency | Electorate[2] | Majority[3] | Member of Parliament[3] | Nearest opposition[3] | Map | ||
|---|---|---|---|---|---|---|---|
| Aberavon | 50,750 | 10,490 | Stephen Kinnock‡ | Charlotte Lang† | 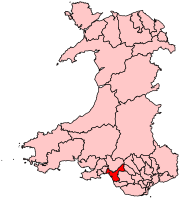 | ||
| Aberconwy | 44,699 | 2,034 | Robin Millar† | Emily Owen ‡ | 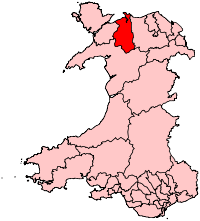 | ||
| Alyn and Deeside | 62,789 | 213 | Mark Tami‡ | Sanjoy Sen† | 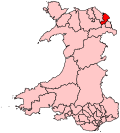 | ||
| Arfon | 42,215 | 2,781 | Hywel Williams₪ | Steffie Williams Roberts‡ | 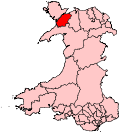 | ||
| Blaenau Gwent | 50,739 | 8,647 | Nick Smith‡ | Richard Taylor* |  | ||
| Brecon and Radnorshire | 55,490 | 7,131 | Fay Jones† | Jane Dodds¤ | 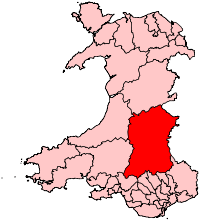 | ||
| Bridgend | 63,303 | 1,157 | Jamie Wallis† | Madeleine Moon‡ |  | ||
| Caerphilly | 63,166 | 6,833 | Wayne David‡ | Jane Pratt† |  | ||
| Cardiff Central | 64,037 | 17,179 | Jo Stevens‡ | Meirion Jenkins† |  | ||
| Cardiff North | 68,438 | 6,982 | Anna McMorrin‡ | Mo Ali† |  | ||
| Cardiff South | 78,837 | 12,737 | Stephen Doughty‡ | Philippa Broom† | 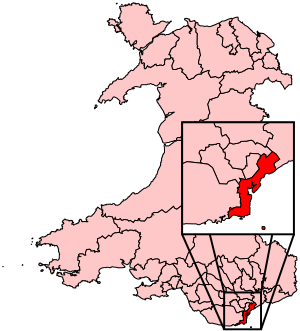 | ||
| Cardiff West | 68,508 | 10,986 | Kevin Brennan‡ | Carolyn Webster† | 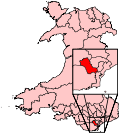 | ||
| Carmarthen East and Dinefwr | 57,419 | 1,809 | Jonathan Edwards₪ | David Darkin† | 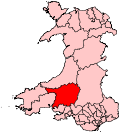 | ||
| Carmarthen West and South Pembrokeshire | 59,158 | 7,745 | Simon Hart† | Marc Tierney‡ | 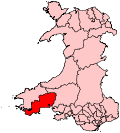 | ||
| Ceredigion | 56,250 | 6,329 | Ben Lake₪ | Amanda Jenner¤ | 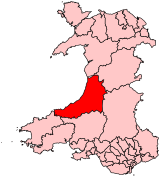 | ||
| Clwyd South | 53,919 | 1,239 | Simon Baynes† | Susan Elan Jones‡ | 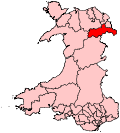 | ||
| Clwyd West | 57,714 | 6,747 | David Jones† | Jo Thomas‡ | 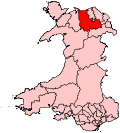 | ||
| Cynon Valley | 51,134 | 8,822 | Beth Winter‡ | Pauline Church† | 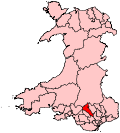 | ||
| Delyn | 54,560 | 865 | Rob Roberts† | David Hanson‡ | 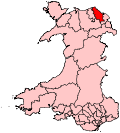 | ||
| Dwyfor Meirionnydd | 44,362 | 4,740 | Liz Saville-Roberts₪ | Tomos Davies† | 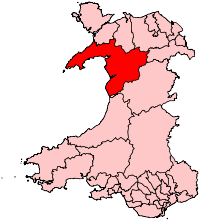 | ||
| Gower | 61,762 | 1,837 | Tonia Antoniazzi‡ | Francesca O'Brien† | 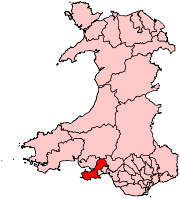 | ||
| Islwyn | 55,423 | 5,464 | Christopher James Evans‡ | Gavin Chambers† | 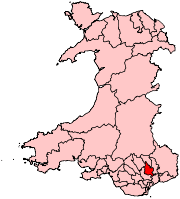 | ||
| Llanelli | 60,518 | 4,670 | Nia Griffith‡ | Tamara Reay† | 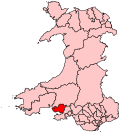 | ||
| Merthyr Tydfil and Rhymney | 56,322 | 10,606 | Gerald Jones‡ | Sara Jones† |  | ||
| Monmouth | 67,098 | 9,982 | David Davies† | Yvonne Murphy‡ | 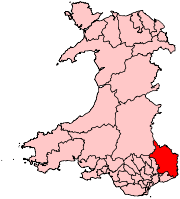 | ||
| Montgomeryshire | 48,997 | 12,138 | Craig Williams† | Kishan Devani¤ | 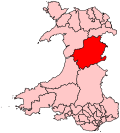 | ||
| Neath | 56,419 | 5,637 | Christina Rees‡ | Jon Burns† | 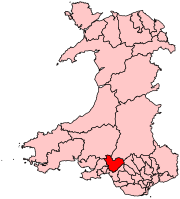 | ||
| Newport East | 58,554 | 1,992 | Jessica Morden‡ | Mark Brown† | 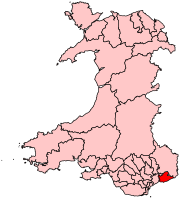 | ||
| Newport West | 66,657 | 902 | Ruth Jones‡ | Matthew Evans† |  | ||
| Ogmore | 57,581 | 7,805 | Chris Elmore‡ | Sadie Vidal† | 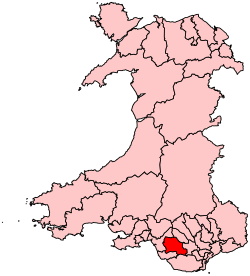 | ||
| Pontypridd | 60,327 | 5,887 | Alex Davies-Jones‡ | Sam Trask† |  | ||
| Preseli Pembrokeshire | 59,606 | 5,062 | Stephen Crabb† | Philippa Thompson‡ | 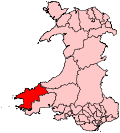 | ||
| Rhondda | 50,262 | 11,440 | Chris Bryant‡ | Hannah Jarvis | 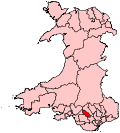 | ||
| Swansea East | 58,450 | 11,440 | Carolyn Harris‡ | Denise Howard† | 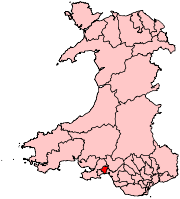 | ||
| Swansea West | 57,078 | 8,116 | Geraint Davies‡ | James Price† |  | ||
| Torfaen | 62,330 | 3,742 | Nick Thomas-Symonds‡ | Graham Smith† |  | ||
| Vale of Clwyd | 56,649 | 1,827 | James Davies† | Chris Ruane‡ | 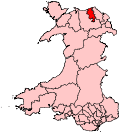 | ||
| Vale of Glamorgan | 76,508 | 3,562 | Alun Cairns† | Belinda Loveluck-Edwards‡ | 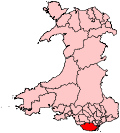 | ||
| Wrexham | 49,737 | 2,131 | Sarah Atherton† | Mary Wimbury‡ |  | ||
| Ynys Môn (Anglesey) | 51,925 | 1,968 | Virginia Crosbie† | Mary Roberts‡ |  | ||
Proposed boundary changes
The Boundary Commission for Wales submitted their final proposals in respect of the Sixth Periodic Review of Westminster Constituencies (the 2018 review) in September 2018. Although the proposals were immediately laid before Parliament they were not brought forward by the Government for approval. Accordingly, they did not come into effect for the 2019 election which took place on 12 December 2019, and which was contested using the constituency boundaries in place since 2010.
Under the terms of the Parliamentary Voting System and Constituencies Act 2011, the Sixth Review was based on reducing the total number of MPs from 650 to 600 and a strict electoral parity requirement that the electorate of all constituencies should be within a range of 5% either side of the electoral quota.
On 24 March 2020, the Minister of State for the Cabinet Office, Chloe Smith, issued a written statement to Parliament setting out the Government's thinking with regard to parliamentary boundaries. They propose to bring forward primary legislation to remove the statutory obligation to implement the 2018 Boundary Review recommendations, as well as set the framework for future boundary reviews in time for the next review which is due to begin in early 2021 and report no later than October 2023. It is proposed that the number of constituencies now remains at the current level of 650, rather than being reduced to 600, while retaining the requirement that the electorate should be no more than +/- 5% from the electoral quota.[4]
Results history
Primary data source: House of Commons research briefing - General election results from 1918 to 2019[5]
2019
The number of votes cast for each political party who fielded candidates in constituencies comprising Wales in the 2019 general election were as follows:
| Party | Votes | % | Change from 2017 | Seats | Change from 2017 |
|---|---|---|---|---|---|
| Labour | 632,035 | 40.9% | 22 | ||
| Conservative | 557,234 | 36.1% | 14 | ||
| Plaid Cymru | 153,265 | 9.9% | 4 | 0 | |
| Liberal Democrats | 92,171 | 6.0% | 0 | 0 | |
| Brexit | 83,908 | 5.4% | new | 0 | 0 |
| Greens | 15,828 | 1.0% | 0 | 0 | |
| Others | 9,916 | 0.6% | 0 | 0 | |
| Total | 1,544,357 | 100.0 | 40 |
Percentage votes
Key:
CON - Conservative Party, including National Liberal Party up to 1966
LAB - Labour Party
LIB - Liberal Party up to 1979; SDP-Liberal Alliance 1983 & 1987; Liberal Democrats from 1992
PC - Plaid Cymru
UKIP/Br - UK Independence Party 2010 to 2017 (included in Other up to 2005 and in 2019); Brexit Party in 2019
Green - Green Party of England and Wales (included in Other up to 2005)
Seats
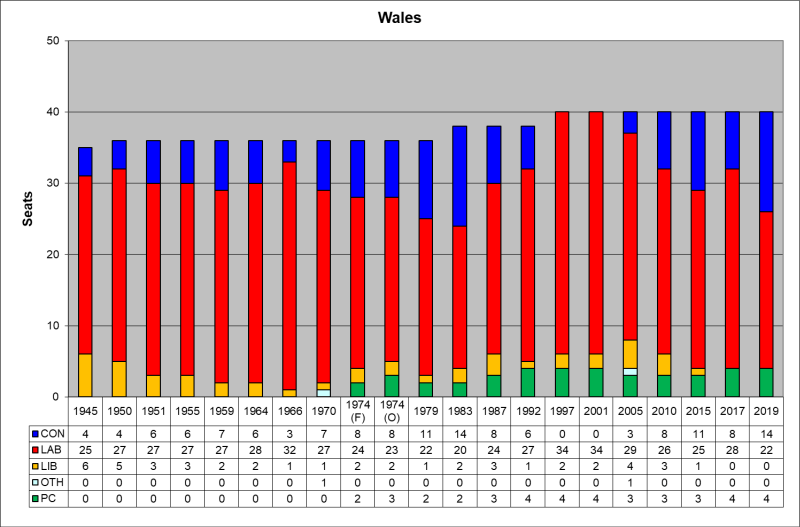
CON - Conservative Party, including National Liberal Party up to 1966
LAB - Labour Party
LIB - Liberal Party up to 1979; SDP-Liberal Alliance 1983 & 1987; Liberal Democrats from 1992
OTH - 1970 - Independent (S. O. Davies); 2005 - Independent (Peter Law)
PC - Plaid Cymru
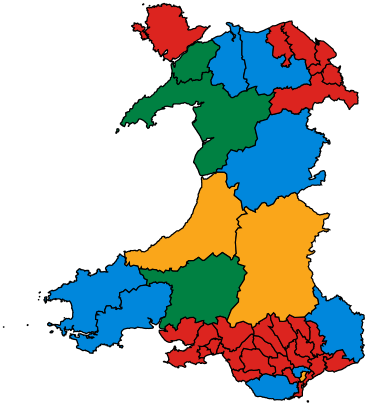
Maps
 2010
2010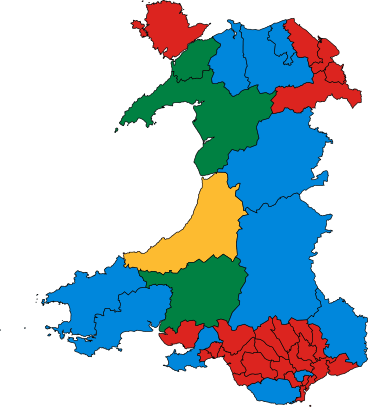 2015
2015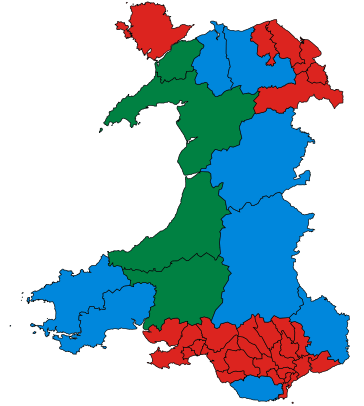 2017
2017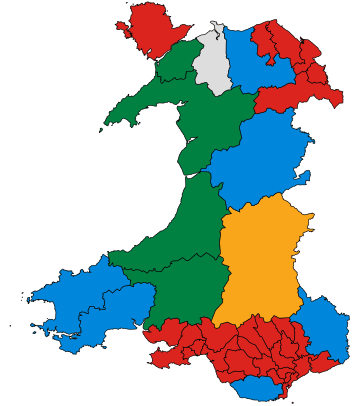 2019 by-elections
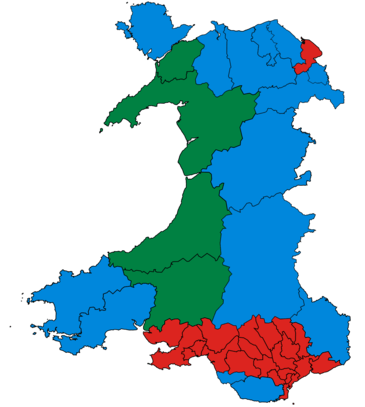 December 2019
These are maps of the results of the last four general elections in Wales and changes in 2019 following a by-election and a change of affiliation.
- Red represents the Labour Party's MPs.
- Blue represents the Conservative Party's MPs.
- Amber represents the Liberal Democrats' MPs.
- Green represents Plaid Cymru's MPs.
- Grey represents Independent MPs.
2019 by-elections
*Two by-elections were held in 2019:
See also
- List of Parliamentary constituencies in Clwyd
- List of Parliamentary constituencies in Dyfed
- List of Parliamentary constituencies in Gwent
- List of Parliamentary constituencies in Gwynedd
- List of Parliamentary constituencies in Mid Glamorgan
- List of Parliamentary constituencies in Powys
- List of Parliamentary constituencies in South Glamorgan
- List of Parliamentary constituencies in West Glamorgan
- National Assembly for Wales constituencies and electoral regions
References
- "Wales 2019 results". Election 2019 Results. BBC. Retrieved 15 December 2019.
- Baker, Carl; Uberoi, Elise; Cracknell, Richard (28 January 2020). "General Election 2019: full results and analysis". Cite journal requires
|journal=(help) - "BBC Elections 2019 results". BBC Elections. 15 December 2019.
- "Update: Strengthening Democracy:Written statement - HCWS183". UK Parliament. Retrieved 20 April 2020.
- Watson, Christopher; Uberoi, Elise; Loft, Philip (17 April 2020). "General election results from 1918 to 2019". Cite journal requires
|journal=(help)