List of Indian states and union territories by literacy rate
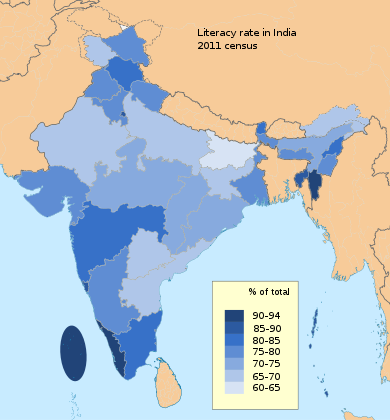
Literacy rate in India is uneven and as such, different states and union territories of India have differences in their literacy rates. The following table shows the details from 1951 to 2011 census data on total literacy rate in percentage.[2][3] According to Census 2011, Kerala has the highest total literacy rate and female literacy rate whereas Lakshadweep had the highest male literacy rate. Bihar has the lowest male literacy rate, while Rajasthan has the lowest female literacy rate. Literacy figures are collected by census takers which essentially means literacy (or lack therefore) is self assessed.[2]
List
Source: Census of India, 2011[1][2]
| States/Union | 1951 | 1961 | 1971 | 1981 | 1991 | 2001 | 2011 |
| Kerala | 47.18 | 55.08 | 69.75 | 78.85 | 89.81 | 90.86 | 93.41 |
| Lakshadweep | 15.23 | 27.15 | 51.76 | 68.42 | 81.78 | 86.66 | 92.28 |
| Mizoram | 31.14 | 44.01 | 53.8 | 59.88 | 82.26 | 88.8 | 91.58 |
| Tripura | - | 20.24 | 30.98 | 50.1 | 60.44 | 73.19 | 87.75 |
| Goa | 23.48 | 35.41 | 51.96 | 65.71 | 75.51 | 82.01 | 87.40 |
| Daman and Diu | - | - | - | - | 71.2 | 78.18 | 87.07 |
| Puducherry | - | 43.65 | 53.38 | 65.14 | 74.74 | 81.24 | 86.55 |
| Chandigarh | - | - | 70.43 | 74.8 | 77.81 | 81.94 | 86.43 |
| Delhi | - | 61.95 | 65.08 | 71.94 | 75.29 | 81.67 | 86.34 |
| Andaman and Nicobar Islands | 30.3 | 40.07 | 51.15 | 63.19 | 73.02 | 81.3 | 86.27 |
| Himachal Pradesh | - | - | - | - | 63.86 | 76.48 | 83.78 |
| Maharashtra | 27.91 | 35.08 | 45.77 | 57.24 | 64.87 | 76.88 | 82.91 |
| Sikkim | - | - | 17.74 | 34.05 | 56.94 | 68.81 | 82.20 |
| Tamil Nadu | - | 36.39 | 45.4 | 54.39 | 62.66 | 73.45 | 80.33 |
| Nagaland | 10.52 | 21.95 | 33.78 | 50.28 | 61.65 | 66.59 | 80.11 |
| Manipur | 12.57 | 36.04 | 38.47 | 49.66 | 59.89 | 70.5 | 79.85 |
| Uttarakhand | 18.93 | 18.05 | 33.26 | 46.06 | 57.75 | 71.62 | 79.63 |
| Gujarat | 21.82 | 31.47 | 36.95 | 44.92 | 61.29 | 69.14 | 79.31 |
| Dadra and Nagar Haveli | - | - | 18.13 | 32.9 | 40.71 | 57.63 | 77.65 |
| West Bengal | 24.61 | 34.46 | 38.86 | 48.65 | 57.7 | 68.64 | 77.08 |
| Punjab | - | - | 34.12 | 43.37 | 58.51 | 69.65 | 76.68 |
| Haryana | - | - | 25.71 | 37.13 | 55.85 | 67.91 | 76.64 |
| Karnataka | - | 29.8 | 36.83 | 46.21 | 56.04 | 66.6 | 75.60 |
| Meghalaya | - | 26.92 | 29.49 | 42.05 | 49.1 | 62.56 | 75.48 |
| Odisha | 15.8 | 21.66 | 26.18 | 33.62 | 49.09 | 63.08 | 96.08 |
| Assam | 18.53 | 32.95 | 33.94 | - | 52.89 | 63.25 | 73.18 |
| Chhattisgarh | 9.41 | 18.14 | 24.08 | 32.63 | 42.91 | 64.66 | 71.04 |
| Madhya Pradesh | 13.16 | 21.41 | 27.27 | 38.63 | 44.67 | 63.74 | 70.63 |
| Uttar Pradesh | 12.02 | 20.87 | 23.99 | 32.65 | 40.71 | 56.27 | 69.72 |
| Jammu and Kashmir | - | 12.95 | 21.71 | 30.64 | - | 55.52 | 68.72 |
| Andhra Pradesh | 14.42 | 21.19 | 24.57 | 35.66 | 44.08 | 60.47 | 67.66 |
| Jharkhand | 12.93 | 21.14 | 23.87 | 35.03 | 41.39 | 53.56 | 67.63 |
| Rajasthan | 8.5 | 18.12 | 22.57 | 30.11 | 38.55 | 60.41 | 67.06 |
| Arunachal Pradesh | - | 7.13 | 11.29 | 25.55 | 41.59 | 54.34 | 66.95 |
| Bihar | 13.49 | 21.95 | 23.17 | 32.32 | 37.49 | 47 | 63.82 |
| ALL | 18.33 | 28.3 | 34.45 | 43.57 | 52.21 | 64.84 | 74.04 |
Notes
1. Literacy rates for 1951, 1961 and 1971 Censuses relate to population aged five years and above. The rates for the 1981, 1991, 2001 and 2011 Censuses relate to the population aged seven years and above. The literacy rate for 1951 in case of West Bengal relates to Total Population including 0-4 age group. Literacy rate for 1951 in respect of Chhattisgarh, Madhya Pradesh and Manipur are based on sample population.
2. India and Manipur figures exclude those of the three sub-divisions viz., Mao Maram, Paomata and Purul of Senapati district of Manipur as census results of 2001 in these three sub-divisions were cancelled due to technical and administrative reasons.
Source: Office of the Registrar General and Census Commissioner, Ministry of Home Affairs, Government of India.
References
- "Ranking of states and union territories by literacy rate: 2011" (PDF). Government of India.
- "Census 2011, Chapter 6 (State of Literacy), p.14" (PDF). Government of India.
- "India at a glance". Government of India.