Killeen–Temple–Fort Hood metropolitan area
Killeen–Temple–Fort Hood is a metropolitan statistical area in Central Texas that covers three counties: Bell, Coryell, and Lampasas. As of the 2019 census estimate, the MSA had a population of 460,303.[2]
Killeen–Temple–Fort Hood | |
|---|---|
Metropolitan Statistical Area | |
 Downtown Temple at Main Street, Temple | |
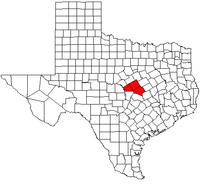 Map of Texas highlighting the Killeen-Temple-Fort Hood Metropolitan Area. | |
| Country | |
| State | |
| Principal cities | |
| Area | |
| • Total | 2,815.93 sq mi (7,293.2 km2) |
| Population (2019)[1] | |
| • Total | 460,303(120th) |
| • Density | 160/sq mi (60/km2) |
| Time zone | UTC-6 (CST) |
| • Summer (DST) | UTC-5 (CDT) |
Referring to the Dallas–Fort Worth metroplex in North Texas, locals sometimes refer to this area as the Centroplex.
Communities
Places with at least 20,000 but less than 75,000 people
Places with 1,000 to 20,000 people
Places with less than 1,000 people
Demographics
| Historical populations | |||
|---|---|---|---|
| Census | Pop. | %± | |
| 1960 | 118,058 | — | |
| 1970 | 159,794 | 35.4% | |
| 1980 | 214,656 | 34.3% | |
| 1990 | 255,301 | 18.9% | |
| 2000 | 330,714 | 29.5% | |
| 2010 | 405,300 | 22.6% | |
As of the census[3] of 2000, there were 330,714 people, 112,111 households, and 82,648 families residing within the MSA. The racial makeup of the MSA was 65.09% White, 19.81% African American, 0.76% Native American, 2.28% Asian, 0.46% Pacific Islander, 7.91% from other races, and 3.69% from two or more races. Hispanic or Latino of any race were 15.66% of the population.
The median income for a household in the MSA was $36,349 and the median income for a family was $40,386. Males had a median income of $27,529 versus $21,396 for females. The per capita income for the MSA was $16,271.
See also
- List of cities in Texas
- Texas census statistical areas
- List of Texas metropolitan areas
- Texas Triangle
References
- "Table 1. Annual Estimates of the Population of Metropolitan and Micropolitan Statistical Areas: April 1, 2010 to July 1, 2012". 2012 Population Estimates. United States Census Bureau, Population Division. Archived from the original on July 22, 2014. Retrieved 2014-03-15.
- Estimates of Resident Population Change and Rankings for Metropolitan Statistical Areas in the United States and Puerto Rico: July 1, 2018 to July 1, 2019 (CBSA-MET-EST2019-ANNCHG) Source: U.S. Census Bureau, Population Division Release Date: March 2020
- "U.S. Census website". United States Census Bureau. Retrieved 2008-01-31.