KOSPI
The Korea Composite Stock Price Index or KOSPI (코스피지수) is the index of all common stocks traded on the Stock Market Division—previously, Korea Stock Exchange—of the Korea Exchange. It is the representative stock market index of South Korea, like the S&P 500 in the United States.
| KOSPI | |
| Hangul | 코스피지수 |
|---|---|
| Hanja | 코스피指數 |
| Revised Romanization | Koseupi jisu |
| McCune–Reischauer | K'osŭp'i chisu |
KOSPI was introduced in 1983 with the base value of 100 as of 4 January 1980. It is calculated based on market capitalization. As of 2007, KOSPI's daily volume is hundreds of millions of shares or (trillions of won).
History
KOSPI (한국종합주가지수 Hanguk jonghap juga jisu) was introduced in 1983, replacing Dow-style KCSPI (Korea Composite Stock Price Index).
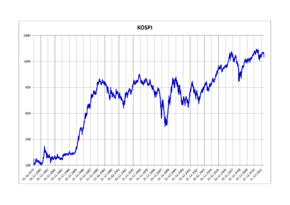
For years, KOSPI moved below 1,000, peaking above 1,000 in April 1989, November 1994, and January 2000.
On 17 June 1998, KOSPI recorded its largest one-day percentage gain of 8.50% (23.81 points), recovering from the bottom of the Asian financial crisis.
On 12 September 2001, KOSPI had its largest one-day percentage drop of 12.02% (64.97 points) just after 9/11.
On 28 February 2005, KOSPI closed at 1,011.36, plunging to 902.88 in April. However, unlike previous bull traps, it kept moving upward, breaking the long-standing 1,000-point resistance level.
In November 2005, the index's Korean name was officially changed to Koseupi jisu (코스피지수).
On 24 July 2007, KOSPI broke 2,000 level for the first time. On July 25 it closed at 2,004.22.
On 20 August 2007, the index recovered 93.20 (5.69%), its largest one-day point gain, after the U.S. Federal Reserve lowered the discount rate. On October 16, 2008, the index dropped 126.50 (9.44%), after the Dow Jones Industrial Average dropped 7.87%.
Record values
| Category | All-time highs | |
|---|---|---|
| Closing | 2,598.19 | 29 January 2018 |
| Intraday | 2,607.10 | 29 January 2018 |
Starting with 24 February 2020[1], the index has been dropping continuously during the Coronavirus pandemic. As of 15 March, the KOSPI closed at 1,771.44, prompting the Financial Supervisory Commission to impose a six-month ban on short-selling, the first such drastic action in nearly nine years.[2]
Annual Returns
The following table shows the annual development of the KOSPI since 1981.[3][4]
| Year | Closing level | Change in index in points |
Change in index in % |
|---|---|---|---|
| 1981 | 131.30 | ||
| 1982 | 128.99 | −2.31 | −1.76 |
| 1983 | 121.21 | −6.03 | −7.78 |
| 1984 | 142.46 | 21.25 | 17.53 |
| 1985 | 163.37 | 20.91 | 14.68 |
| 1986 | 272.61 | 109.24 | 66.87 |
| 1987 | 525.11 | 252.50 | 92.62 |
| 1988 | 907.20 | 382.09 | 72.76 |
| 1989 | 909.72 | 2.52 | 0.28 |
| 1990 | 696.11 | −213.61 | −23.48 |
| 1991 | 610.92 | −85.19 | −12.24 |
| 1992 | 678.44 | 67.52 | 11.05 |
| 1993 | 866.18 | 187.74 | 27.67 |
| 1994 | 1027.37 | 161.19 | 18.61 |
| 1995 | 882.94 | −144.43 | −14.06 |
| 1996 | 651.22 | −231.72 | −26.24 |
| 1997 | 376.31 | −274.91 | −42.21 |
| 1998 | 562.46 | 187.31 | 49.93 |
| 1999 | 1,028.07 | 465.61 | 82.78 |
| 2000 | 504.62 | −523.45 | −50.92 |
| 2001 | 693.70 | 189.08 | 37.47 |
| 2002 | 627.55 | −66.15 | −9.54 |
| 2003 | 810.71 | 183.16 | 29.19 |
| 2004 | 895.92 | 85.21 | 10.51 |
| 2005 | 1,379.37 | 483.45 | 53.96 |
| 2006 | 1,434.46 | 55.09 | 3.99 |
| 2007 | 1,897.13 | 462.67 | 32.25 |
| 2008 | 1,124.47 | −772.66 | −40.73 |
| 2009 | 1,682.77 | 558.30 | 49.65 |
| 2010 | 2,041.66 | 358.89 | 21.33 |
| 2011 | 1,825.74 | −215.92 | −10.58 |
| 2012 | 1,997.05 | 171.31 | 9.38 |
| 2013 | 2,011.34 | 14.29 | 0.74 |
| 2014 | 1,915.59 | −95.75 | −4.76 |
| 2015 | 1,961.31 | 45.72 | 2.39 |
| 2016 | 2,026.46 | 65.15 | 3.32 |
| 2017 | 2,467.49 | 441.03 | 21.76 |
| 2018 | 2,041.04 | −426.45 | −17.28 |
| 2019 | 2,197.67 | 156.63 | 7.67 |
Components
As of August 2020, KOSPI has over 880 components. Top 9 stocks by market capitalization are:
- Samsung Electronics (005930)
- SK Hynix (000660)
- LG Chem (051910)
- Naver (035420)
- Samsung Biologics (207940)
- Celltrion (068270)
- Hyundai Motor (005380)
- Samsung SDI (006400)
- Kakao (035720)
Other indices
- KOSPI 200, KOSPI 100, and KOSPI 50
- LargeCap, MidCap, and SmallCap indices based on market capitalization
- KOGI corporate governance index
- KODI dividend index
- Industry indices like chemicals, electrical & electronic equipments, transport equipment, or banks.
- KRX 100 and other KRX indices which take into account both stock markets of Korea Exchange (KRX) — Stock Market Division and KOSDAQ Division
KOSPI 200
The KOSPI 200 index consists of 200 big companies of the Stock Market Division. The base value of 100 was set on 3 January 1990. It has over 70% market value of the KOSPI, and so moves along with the KOSPI index. KOSPI 200 is important because it is listed on futures and option markets and is one of the most actively traded indices in the world. The KOSPI is calculated as current market capitalization (at the time of comparison) divided by base market capitalization (as of 4 January 1980).
That is: Current index = Current total market cap of constituents × 100 / Base Market Capitalization[5]
Its all-time low is 31.96, reached on 16 June 1998, during the financial crisis. It closed above 200 for the first time on 24 April 2007.
KRX 100
KRX 100 is the index of 100 companies listed on Korea Exchange, including KOSDAQ's big companies. It's meant to replace KOSPI 200 as the key futures index, but has not been very successful to date.
KRX derivatives products
- Stock Index Products: KOSPI 200 Futures, KOSPI 200 Options, STAR Futures
- Individual Equity Products: Individual Equity Futures, Individual Equity Options
- Interest Rate Products: 3-Year Korea Treasury Bond Futures (KTB3), 5-Year Korea Treasury Bond Futures (KTB5), 10-Year Korea Treasury Bond Futures (KTB10), MSB Futures
- Currency Products: USD Futures, USD Options, Japanese Yen Futures, Euro Futures
- Commodity Products: Gold Futures, Lean Hog Futures
Investment procedures for foreigners
To trade futures and options contracts listed on KRX, a foreign investor may designate custodian banks as standing proxies (through custodian bank agreements and standing proxy agreements to facilitate trading).
A custodian bank as a standing proxy opens accounts at foreign exchange banks and futures companies, deposits, and withdrawals investors' money and monitors investors' properties for them. A foreign investor should designate foreign exchange banks through a foreign currency exchange agreement to execute his foreign exchange transactions and transfers. Most foreign exchange banks also do custodian bank and standing proxy operations. A foreign investor should designate securities and futures companies to trade futures and options traded on KRX.
See also
- KOSDAQ
- Hang Seng Index
- SENSEX
- Nikkei 225
- CNX Nifty
- SSE Composite
- TAIEX
References
- Huang, Eustance (23 February 2020). "South Korea stocks drop nearly 4% as country raises coronavirus alert to 'highest level'". CNBC.
- Kirk, Donald (15 March 2020). "Coronavirus Hits South Korean Markets Despite Easing Of Crisis". Forbes.
- "Historical data: KOSPI Index - South Korea (^KOSPI)".
- "KOSPI Composite Index (South Korea) Yearly Stock Returns". www.1stock1.com. Retrieved 20 January 2020.
- KOSPI 200 weighting methodology via Wikinvest