Iowa's 7th congressional district
Iowa's 7th congressional district is a former congressional district in Iowa. It was eliminated after the 1970 election, leaving Iowa with six congressional districts. The state has since been reduced to four congressional districts.
Redistricting
The 7th District was reformed for the 1932 election and Iowa dropped its 10th and 11th districts. Cassius C. Dowell ran for and won the 6th Congressional District, while Otha D. Wearin took over the 7th Congressional District. The district was eliminated as a result of the 1970 census. All of the district was then put in the 5th congressional district, with the exception of Crawford and Monona counties which were put in the 6th district.
List of representatives
| Representative | Party | Term | Cong ress |
District Residence (County) | Note |
|---|---|---|---|---|---|
District created |
March 4, 1873 | ||||
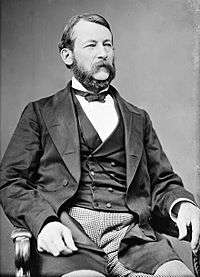 |
Republican | March 4, 1873 – March 3, 1877 | 43rd 44th |
Polk | |
 |
Republican | March 4, 1877 – March 3, 1879 | 45th | Madison | |
 |
Greenback | March 4, 1879 – March 3, 1881 | 46th | Polk | |
 |
Republican | March 4, 1881 – July 13, 1884 | 47th 48th |
Polk | Resigned after being appointed US Ambassador to Germany |
Vacant |
July 13, 1884 - December 2, 1884 | ||||
 |
Republican | December 2, 1884 – March 3, 1885 | 48th | Polk | |
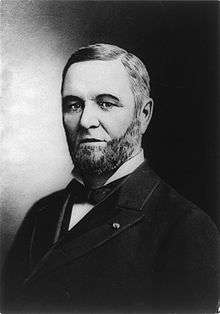 |
Republican | March 4, 1885 – October 3, 1890 | 49th 50th 51st |
Dallas | Resigned after being appointed US Ambassador to Brazil |
Vacant |
October 3, 1890 - November 4, 1890 | ||||
 |
Republican | November 4, 1890 – March 3, 1891 | 51st | Marion | |
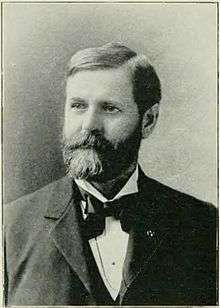 |
Republican | March 4, 1891 – March 3, 1911 | 52nd 53rd 54th 55th 56th 57th 58th 59th 60th 61st |
Polk | |
 |
Republican | March 4, 1911 – March 3, 1915 | 62nd 63rd |
Polk | |
 |
Republican | March 4, 1915 – March 3, 1933 | 64th 65th 66th 67th 68th 69th 70th 71st 72nd |
Polk | Redistricted to the 6th district |
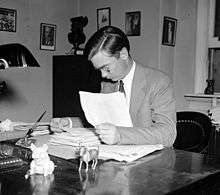 |
Democratic | March 4, 1933 – January 3, 1939 | 73rd 74th 75th |
Mills | |
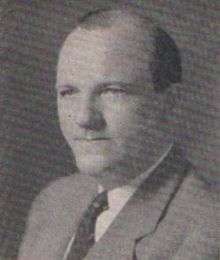 |
Republican | January 3, 1939 – January 3, 1965 | 76th 77th 78th 79th 80th 81st 82nd 83rd 84th 85th 86th 87th 88th |
Audubon | |
 |
Democratic | January 3, 1965 – January 3, 1967 | 89th | Carroll | |
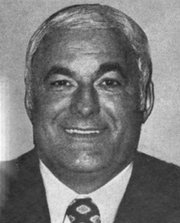 |
Republican | January 3, 1967 – January 3, 1973 | 90th 91st 92nd |
Mills | Redistricted to the 5th district |
District eliminated |
January 3, 1973 | ||||
Election History
| Year [1]
|
Party Affiliation | Winner | Number of Votes | Party Affiliation | Loser | Number of Votes | Percentage of Votes |
|---|---|---|---|---|---|---|---|
| 1920 | Republican | Cassius C. Dowell | 41,644 | Socialist | Charles Gay | 1,272 | 97% - 3% |
| 1922 | Republican | Cassius C. Dowell | 34,012 | Democrat | Winfred E. Robb | 19,987 | 62% - 36% |
| 1924 | Republican | Cassius C. Dowell | 66,550 | Democrat | William M. Wade | 18,454 | 78% - 22% |
| 1926 | Republican | Cassius C. Dowell | 34,159 | Democrat | William M. Wade | 10,255 | 77% - 23% |
| 1928 | Republican | Cassius C. Dowell | 72,404 | N/A | N/A | 0 | 100% - 0% |
| 1930 | Republican | Cassius C. Dowell | 36,715 | Democrat | Carl Evans | 11,372 | 76% - 24% |
| 1932 | Democrat | Otha D. Wearin | 57,803 | Republican | Charles Edward Swanson | 44,925 | 56% - 43% |
| 1934 | Democrat | Otha D. Wearin | 51,395 | Republican | Charles Edward Swanson | 47,508 | 52% - 48% |
| 1936 | Democrat | Otha D. Wearin | 61,398 | Republican | Henry K. Peterson | 59,834 | 50% - 49% |
| 1938 | Republican | Ben F. Jensen | 54,922 | Democrat | Roger F. Warin | 37,992 | 59% - 41% |
| 1940 | Republican | Ben F. Jensen | 71,633 | Democrat | Ernest M. Miller | 50,644 | 59% - 41% |
| 1942 | Republican | Ben F. Jensen | 49,086 | Democrat | Jess Alton | 27,409 | 64% - 36% |
| 1944 | Republican | Ben F. Jensen | 66,905 | Democrat | Albert McGinn | 41,802 | 62% - 38% |
| 1946 | Republican | Ben F. Jensen | 40,152 | Democrat | Philip A. Allen | 23,567 | 63% - 37% |
| 1948 | Republican | Ben F. Jensen | 59,173 | Democrat | W. A. Byers | 44,857 | 57% - 43% |
| 1950 | Republican | Ben F. Jensen | 55,291 | Democrat | James A. Hart | 33,617 | 62% - 38% |
| 1952 | Republican | Ben F. Jensen | 82,462 | Democrat | Thomas J. Keleher | 39,999 | 67% - 33% |
| 1954 | Republican | Ben F. Jensen | 51,022 | Democrat | Elmer G. Carlson | 33,492 | 60% - 40% |
| 1956 | Republican | Ben F. Jensen | 64,967 | Democrat | John L. Jensen | 52,389 | 55% - 45% |
| 1958 | Republican | Ben F. Jensen | 41,053 | Democrat | Ellsworth O. Hays | 38,660 | 52% - 48% |
| 1960 | Republican | Ben F. Jensen | 66,037 | Democrat | Duane Orton | 52,214 | 56% - 44% |
| 1962 | Republican | Ben F. Jensen | 56,341 | Democrat | Ed Peters | 44,171 | 56% - 44% |
| 1964 | Democrat | John R. Hansen | 78,243 | Republican | Ben F. Jensen | 67,942 | 54% - 46% |
| 1966 | Republican | William J. Scherle | 64,217 | Democrat | John R. Hansen | 44,529 | 59% - 41% |
| 1968 | Republican | William J. Scherle | 64,217 | Democrat | Richard C. Oshlo | 44,529 | 48% - 33% |
| 1970 | Republican | William J. Scherle | 53,084 | Democrat | Lou Galetich | 31,552 | 63% - 37% |
gollark: Are they overclocked to compensate or something?
gollark: Doesn't making the brains general-purpose slow down execution a bit compared to the direct-as-hardware version?
gollark: Foreign function interface...?
gollark: They eat electrons.
gollark: I think the gravity manipulation stuff in this obeys conservation of energy, so just use the really energy dense power source to explode.
References
- "Election Statistics,". 2005. Archived from the original on 2007-07-25.
- Martis, Kenneth C. (1989). The Historical Atlas of Political Parties in the United States Congress. New York: Macmillan Publishing Company.
- Martis, Kenneth C. (1982). The Historical Atlas of United States Congressional Districts. New York: Macmillan Publishing Company.
- Congressional Biographical Directory of the United States 1774–present
This article is issued from Wikipedia. The text is licensed under Creative Commons - Attribution - Sharealike. Additional terms may apply for the media files.