Galloway and Upper Nithsdale (UK Parliament constituency)
Galloway and Upper Nithsdale was a county constituency which returned one Member of Parliament (MP) to the House of Commons of the Parliament of the United Kingdom, elected by the first past the post voting system.
| Galloway and Upper Nithsdale | |
|---|---|
| Former County constituency for the House of Commons | |
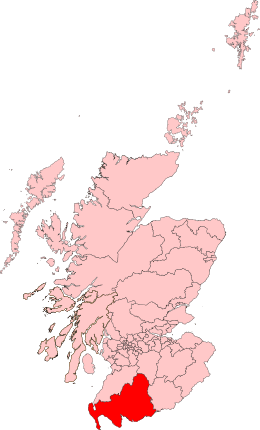
 Boundary of Galloway and Upper Nithsdale in Scotland for the 2001 general election | |
| 1983–2005 | |
| Replaced by | Dumfries and Galloway |
| Created from | Galloway and Dumfries[1] |
The constituency was created for the 1983 general election (partly replacing the former Galloway constituency), and abolished for the 2005 general election, when it was replaced by Dumfries and Galloway.
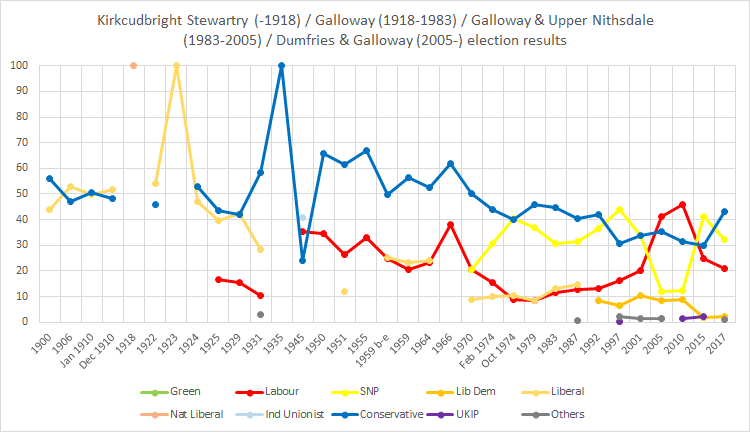
The constituency was notable in being the only seat in all of Scotland won by the Conservative Party at the 2001 general election, and was one of the very few seats that changed hands in that election.
Boundaries
1983–1997: Stewartry District, Wigtown District, and the Nithsdale District electoral divisions of Kirkconnel, Mabie, Mid Nithsdale, and Sanquhar and Queensberry.
1997–2005: Stewartry District, Wigtown District, and the Nithsdale District electoral divisions of Queensberry, Upper Nithsdale, and West Nithsdale.
Members of Parliament
| Election | Member [2] | Party | |
|---|---|---|---|
| 1983 | Ian Lang | Conservative | |
| 1997 | Alasdair Morgan | SNP | |
| 2001 | Peter Duncan | Conservative | |
| 2005 | constituency abolished | ||
Election results

Elections of the 1980s
| Party | Candidate | Votes | % | ± | |
|---|---|---|---|---|---|
| Conservative | Ian Lang | 17,579 | 44.7 | -1.0 | |
| SNP | George Thompson | 12,118 | 30.8 | -2.0 | |
| Liberal | Gerald Douglas | 5,129 | 13.0 | +3.4 | |
| Labour | Malcolm Miller | 4,464 | 11.4 | -0.5 | |
| Majority | 5,461 | 13.9 | N/A | ||
| Turnout | 39,290 | 75.8 | N/A | ||
| Conservative win (new seat) | |||||
| Party | Candidate | Votes | % | ± | |
|---|---|---|---|---|---|
| Conservative | Ian Lang | 16,592 | 40.4 | −4.3 | |
| SNP | Stephen Norris | 12,919 | 31.5 | +0.7 | |
| Liberal | John McKercher | 6,001 | 14.6 | +1.6 | |
| Labour | James Gray | 5,298 | 12.9 | +1.5 | |
| Independent | Dan Kenny | 230 | 0.6 | New | |
| Majority | 3,673 | 8.9 | -5.0 | ||
| Turnout | 41,040 | 76.8 | +1.0 | ||
| Conservative hold | Swing | ||||
Elections of the 1990s
| Party | Candidate | Votes | % | ± | |
|---|---|---|---|---|---|
| Conservative | Ian Lang | 18,681 | 42.0 | +1.6 | |
| SNP | Matt Brown | 16,213 | 36.5 | +5.0 | |
| Labour | John Dowson | 5,766 | 13.0 | +0.1 | |
| Liberal Democrats | John McKerchar | 3,826 | 8.6 | −6.0 | |
| Majority | 2,468 | 5.5 | -3.4 | ||
| Turnout | 44,486 | 81.7 | +4.9 | ||
| Conservative hold | Swing | ||||
| Party | Candidate | Votes | % | ± | |
|---|---|---|---|---|---|
| SNP | Alasdair Morgan | 18,449 | 43.9 | +7.5 | |
| Conservative | Ian Lang | 12,825 | 30.5 | −11.5 | |
| Labour | Katy Clark | 6,861 | 16.3 | +3.4 | |
| Liberal Democrats | John McKerchar | 2,700 | 6.4 | −2.2 | |
| Independent | Robert Wood | 566 | 1.4 | New | |
| Referendum | Alan Kennedy | 428 | 1.0 | New | |
| UKIP | Joseph Smith | 189 | 0.4 | New | |
| Majority | 5,624 | 13.4 | N/A | ||
| Turnout | 42,018 | 79.7 | −2.0 | ||
| SNP gain from Conservative | Swing | ||||
Elections of the 2000s
| Party | Candidate | Votes | % | ± | |
|---|---|---|---|---|---|
| Conservative | Peter Duncan | 12,222 | 34.0 | +3.5 | |
| SNP | Malcolm Fleming | 12,148 | 33.8 | −10.1 | |
| Labour | Thomas Sloan | 7,258 | 20.2 | +3.9 | |
| Liberal Democrats | Neil Wallace | 3,698 | 10.3 | +3.9 | |
| Scottish Socialist | Andy Harvey | 588 | 1.6 | New | |
| Majority | 74 | 0.2 | N/A | ||
| Turnout | 35,914 | 67.4 | −12.3 | ||
| Conservative gain from SNP | Swing | ||||
References
- "'Galloway and Upper Nithsdale', June 1983 up to May 1997". ElectionWeb Project. Cognitive Computing Limited. Archived from the original on 12 March 2016. Retrieved 11 March 2016.
- Leigh Rayment's Historical List of MPs – Constituencies beginning with "G" (part 1)
- "Election Data 1983". Electoral Calculus. Archived from the original on 15 October 2011. Retrieved 28 June 2017.
- "Election Data 1987". Electoral Calculus. Archived from the original on 15 October 2011. Retrieved 28 June 2017.
- "Election Data 1992". Electoral Calculus. Archived from the original on 15 October 2011. Retrieved 28 June 2017.
- "Election Data 1997". Electoral Calculus. Archived from the original on 15 October 2011. Retrieved 28 June 2017.
- "Election Data 2001". Electoral Calculus. Archived from the original on 15 October 2011. Retrieved 28 June 2017.