Economy of Oregon
The economy of the U.S. state of Oregon is made up of a number of sectors. During the 1990s and 2000s, Oregon has attempted to transition its economy from one based on natural resources to one based on a mix of manufacturing, services, and high technology.[8]
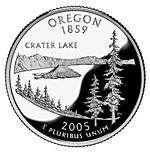
 The Oregon State version of the U.S. Quarter features Crater Lake. | |
| Statistics | |
|---|---|
GDP per capita | $45,049 (2016)[1] |
Population below poverty line | 15.5% (2008-2012) [2] |
| 0.4586[3] | |
Labor force | 1,972,700 (8/2014) [4] |
| Unemployment | 3.4% (5/2017) [5] |
| Public finances | |
| Revenues | $7,475.135 million[6] |
| Expenses | $5,889 million[7] |
In the 1980s, hard times hit Oregon's main resource sectors: timber, fishing, and agriculture. Efforts by the state government to diversify the state economy led to the growth of Oregon's high tech sector, based in the three counties surrounding Portland, Oregon, but rural counties were left out. The tech bust of the early 2000s caused Oregon to lose many of the 43,000 jobs lost between 2000 and 2003. Between 2004 and 2007, Oregon's and the nation's economies grew based on increases in construction and services. Construction alone added 21,000 jobs during the period.[8]
The Gross Domestic Product (GDP) of Oregon in 2008 was $161.6 billion; it is United States' 26th wealthiest state by GDP. The state's per capita personal income in 2008 was $38,801.[9] As of July 2015, the state's unemployment rate is 5.9%. Oregon ranks 37th in the nation for unemployment.[10]
History

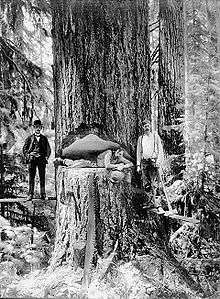
The fur trade was Oregon's first major industry. Beginning in the 1840s, settlers began displacing Native Americans and setting up farms. Though growth was slow for the coastal region there was rapid growth in the Willamette Valley and Portland in particular. With the discovery of gold in 1861-62 in Baker county and Grant County in Eastern Oregon had begun establishing itself as a major shipping hub with a focus on wheat. With the railroad's arrival to Oregon, Portland has sealed its position as the economic center of the state.[11] In the following decades, loggers and salmon fishers joined the miners.[12]
With the coming of the First World War, the state's shipyard industry and timber trades continued to expand rapidly again, especially in Portland. In the 1930s, the Works Projects Administration and the Civilian Conservation Corps introduced through the New Deal would construct many projects throughout the state including Timberline Lodge on Mt. Hood and many hydroelectric dams along Oregon's rivers.[11] The Bonneville Dam, built from 1933-1937 provided low cost electricity that helped fuel development of industries such as aluminum plants, like Wah Chang Corporation located in Albany. The power, food, and lumber provided by Oregon helped fuel the development of the West, although the periodic fluctuations in the nation's building industry have hurt the state's economy on multiple occasions. That coupled with needs of World War II food production, shipbuilding and the lumber were also greatly enhanced throughout the state.[11]
Exports
20% of the manufacturing jobs in Oregon rely on exports which totaled $19.4 billion in 2009 with over 40% of the total going to countries in Asia.[13]
The largest countries receiving exports from Oregon in 2009 were:[13]
- Canada ($2.8 billion)
- China ($2.5 billion)
- Japan ($2 billion)
- Malaysia ($2 billion)
- South Korea ($1.3 billion)
The state's top exports in 2009 by category were:[13]
- computer and electronic products ($6.8 billion)
- machinery manufactures ($1.1 billion)
See also
References
- "Per Capita Personal Income in Oregon". stlouisfed.org. 22 March 2018. Retrieved 18 April 2018.
- "Archived copy". Archived from the original on 2016-02-24. Retrieved 2016-05-27.CS1 maint: archived copy as title (link)
- "U.S. Census website". United States Census Bureau. Retrieved 2016-08-18.
- http://research.stlouisfed.org/fred2/data/ORLFN.txt
- "Oregon jobless rate hits another all-time low: 3.7 percent". oregonlive.com. Retrieved 18 April 2018.
- https://www.census.gov/govs/statetax/1038orstax.html
- "Archived copy". Archived from the original on 2011-08-23. Retrieved 2011-10-10.CS1 maint: archived copy as title (link)
- "Oregon's Economy: Overview". Oregon State Archives. Retrieved 2009-03-11.
- "Gross domestic product by state." Archived 2010-07-07 at the Wayback Machine Bureau of Economic Analysis.
- "Unemployment Rates for States." BLS.gov
- "Culture: History and Economy". Welcome to Oregon.
- "World war I and the Oregon Experience: the Oregon economy". Oregon State Archives. Retrieved 2009-03-11.
- Office of the United States Trade Representative (February 2010). "Oregon". Executive Office of the President of the United States. Retrieved 2010-07-25.
