Cosío
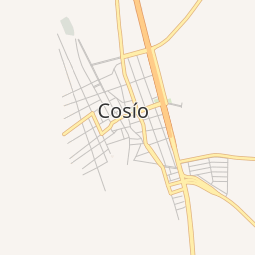
Cosío is a municipality and town in the Mexican state of Aguascalientes. It stands at 22°22′N 102°18′W. The municipal seat is the town of Cosío. As of 2010, the town of Cosío had a population of 4,898.[1]
Cosío | |
|---|---|
Municipality | |
 Coat of arms | |
Interactive map | |
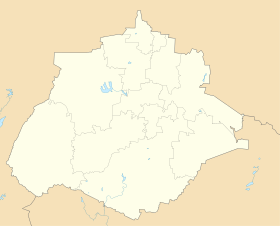 Cosío Location in Mexico Cosío Cosío (Mexico) | |
| Coordinates: 22°22′N 102°18′W | |
| Country | |
| State | Aguascalientes |
| Municipal seat | Cosío |
| Area | |
| • Total | 129.21 km2 (49.89 sq mi) |
| Population (2015) | |
| • Total | 15,577 |
| • Density | 120/km2 (310/sq mi) |
Demographics
As of 2010, the municipality had a total population of 15,042.[1]
As of 2010, the town of Cosío had a population of 4,898.[1] Other than the town of Cosío, the municipality had 85 localities, the largest of which (with 2010 populations in parentheses) were: La Punta (2,416), El Refugio de Providencia (Providencia) (1,377), El Salero (1,229), and Santa María de la Paz (1,026), classified as rural.[1]
Climate
| Climate data for Cosío (1951–2010) | |||||||||||||
|---|---|---|---|---|---|---|---|---|---|---|---|---|---|
| Month | Jan | Feb | Mar | Apr | May | Jun | Jul | Aug | Sep | Oct | Nov | Dec | Year |
| Record high °C (°F) | 28.0 (82.4) |
32.0 (89.6) |
32.0 (89.6) |
34.0 (93.2) |
36.0 (96.8) |
36.0 (96.8) |
34.0 (93.2) |
32.0 (89.6) |
31.5 (88.7) |
32.0 (89.6) |
31.0 (87.8) |
28.0 (82.4) |
36.0 (96.8) |
| Average high °C (°F) | 21.0 (69.8) |
22.8 (73.0) |
25.6 (78.1) |
27.6 (81.7) |
29.4 (84.9) |
28.7 (83.7) |
26.8 (80.2) |
26.4 (79.5) |
25.8 (78.4) |
25.1 (77.2) |
23.6 (74.5) |
21.5 (70.7) |
25.4 (77.7) |
| Daily mean °C (°F) | 12.5 (54.5) |
13.9 (57.0) |
16.4 (61.5) |
18.8 (65.8) |
20.8 (69.4) |
21.0 (69.8) |
19.9 (67.8) |
19.6 (67.3) |
19.1 (66.4) |
17.5 (63.5) |
14.9 (58.8) |
13.1 (55.6) |
17.3 (63.1) |
| Average low °C (°F) | 4.0 (39.2) |
5.1 (41.2) |
7.1 (44.8) |
10.1 (50.2) |
12.3 (54.1) |
13.4 (56.1) |
13.1 (55.6) |
12.7 (54.9) |
12.4 (54.3) |
10.0 (50.0) |
6.3 (43.3) |
4.7 (40.5) |
9.3 (48.7) |
| Record low °C (°F) | −5.0 (23.0) |
−4.0 (24.8) |
−0.5 (31.1) |
1.0 (33.8) |
3.0 (37.4) |
7.0 (44.6) |
8.5 (47.3) |
8.0 (46.4) |
3.5 (38.3) |
1.0 (33.8) |
−2.5 (27.5) |
−7.0 (19.4) |
−7.0 (19.4) |
| Average precipitation mm (inches) | 22.8 (0.90) |
9.5 (0.37) |
2.8 (0.11) |
8.1 (0.32) |
20.6 (0.81) |
60.0 (2.36) |
99.5 (3.92) |
82.6 (3.25) |
66.5 (2.62) |
30.2 (1.19) |
7.7 (0.30) |
11.2 (0.44) |
421.5 (16.59) |
| Average precipitation days (≥ 0.1 mm) | 2.6 | 1.5 | 1.0 | 2.0 | 4.0 | 7.9 | 11.2 | 10.0 | 8.8 | 4.7 | 1.8 | 2.5 | 58.0 |
| Source: Servicio Meteorologico Nacional[2][3] | |||||||||||||
gollark: A fun feature of python is that it actually will run `__main__.py` or something from ZIP files, and ZIP files are weird and backward and can be concatenated onto the end of another file without decoders caring much.
gollark: PNG has some mandatory header parts at the start and I don't think you could make something both a valid PNG and valid in any modern executable format.
gollark: PNG files aren't "run", they're opened and displayed by some sort of image viewer program. And no PNG has no metadata, or it's not actually a valid file. While you can mix hidden data in with the image data, computers will not randomly run that, barring some sort of extremely bad vulnerability.
gollark: It's probably going to be treated as multiple sub-objects for collision detection though.
gollark: I see.
References
- "Cosío". Catálogo de Localidades. Secretaría de Desarrollo Social (SEDESOL). Retrieved 23 April 2014.
- "Estado de Aguascalientes-Estacion: Cosio". Normales Climatologicas 1951–2010 (in Spanish). Servicio Meteorologico Nacional. Retrieved 8 May 2015.
- "Extreme Temperatures and Precipitation for Cosio 1978–2010" (in Spanish). Servicio Meteorológico Nacional. Retrieved 8 May 2015.
External links
Aguascalientes City (capital) | ||
| Municipalities and (municipal seats) |
|  |
| ||
This article is issued from Wikipedia. The text is licensed under Creative Commons - Attribution - Sharealike. Additional terms may apply for the media files.