Cold inflation pressure
Cold inflation pressure is the inflation pressure of tyres before the car is driven and the tyres warmed up. Recommended cold inflation pressure is displayed on the owner's manual and on the placard (or sticker) attached to the vehicle door edge, pillar, glovebox door or fuel filler flap. 40% of passenger cars have at least one tyre under-inflated by 6 psi or more.[1] Drivers are encouraged to make sure their tyres are adequately inflated, as under inflated tyres can greatly reduce fuel economy, increase emissions, cause increased wear on the edges of the tread surface, and can lead to overheating and premature failure of the tyre. Excessive pressure, on the other hand, may lead to impact-breaks, decreased braking performance, and cause increased wear on the center part of the tread surface.
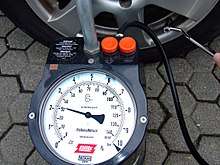
Tyre pressure is commonly measured in psi in the imperial and US customary systems, bar, which is deprecated but accepted for use with SI or the kilopascal (kPa), which is an SI unit.
Ambient temperature affects the cold tyre pressure. Cold tyre absolute pressure (gauge pressure plus atmospheric pressure) varies directly with the absolute temperature, measured in kelvin.
From physics, the ideal gas law states that PV = nRT, where P is absolute pressure, T is absolute temperature, V is the volume (assumed to be relatively constant in the case of a tyre), and nR is constant for a given number of molecules of gas. To understand this, assume the tyre was filled when it was 300 kelvins (approximately 27 degrees Celsius or 80 degrees Fahrenheit). If the temperature varies 10% (i.e., by 30 kelvins [also 30 degrees Celsius or 54 degrees Fahrenheit]), the pressure varies 10%. So if the tyre was filled at 80 °F to 32 psi (or 47 psi absolute when we add atmospheric pressure), the change would be 4.7 psi for this 30 Celsius degree change, or 0.16 psi per Celsius degree or 0.1 psi per Fahrenheit degree or 1 psi for every 10 Fahrenheit degrees. Using SI units, that would be 1.1 kPa/K.
Hence, for a tyre filled to 32 psi, the approximation usually made is that within the range of normal atmospheric temperatures and pressures: Tyre pressure increases 1 psi for each 10 Fahrenheit degree increase in temperature, or conversely decreases 1 psi for each 10 Fahrenheit degree decrease in temperature and in SI units, tire pressure increases 1.1 kPa for each 1 Celsius degree increase in temperature, or conversely decreases 1.1 kPa for each 1 Celsius degree decrease in temperature. For tyres that need inflation greater than 32psi it might be easier to use a Rule of Thumb of 2% pressure change[2] for a change of 10 degrees Fahrenheit. From the table below, one can see that these are only approximations:
Variation of tyre pressure with temperature in Fahrenheit and Celsius
(Assuming atmospheric pressure is 14.696 psi, or 101.3 kPA.)[3]
| Pressure at 20°C (68°F) |
10 psi | 20 psi | 30 psi | 40 psi | 50 psi | 60 psi | 70 psi | 80 psi | 90 psi | 100 psi | |
|---|---|---|---|---|---|---|---|---|---|---|---|
| 104°F | 11.7 psi | 22.4 psi | 33.1 psi | 43.7 psi | 54.4 psi | 65.1 psi | 75.8 psi | 86.5 psi | 97.1 psi | 107.8 psi | 40°C |
| 86°F | 10.8 psi | 21.2 psi | 31.5 psi | 41.9 psi | 52.2 psi | 62.5 psi | 72.9 psi | 83.2 psi | 93.6 psi | 103.9 psi | 30°C |
| 68°F | 10.0 psi | 20.0 psi | 30.0 psi | 40.0 psi | 50.0 psi | 60.0 psi | 70.0 psi | 80.0 psi | 90.0 psi | 100.0 psi | 20°C |
| 50°F | 9.2 psi | 18.8 psi | 28.5 psi | 38.1 psi | 47.8 psi | 57.5 psi | 67.1 psi | 76.8 psi | 86.4 psi | 96.1 psi | 10°C |
| 32°F | 8.3 psi | 17.6 psi | 26.9 psi | 36.3 psi | 45.6 psi | 54.9 psi | 64.2 psi | 73.5 psi | 82.9 psi | 92.2 psi | 0°C |
| 14°F | 7.5 psi | 16.4 psi | 25.4 psi | 34.4 psi | 43.4 psi | 52.4 psi | 61.3 psi | 70.3 psi | 79.3 psi | 88.3 psi | −10°C |
| −4°F | 6.6 psi | 15.3 psi | 23.9 psi | 32.5 psi | 41.2 psi | 49.8 psi | 58.4 psi | 67.1 psi | 75.7 psi | 84.3 psi | −20°C |
| −22°F | 5.8 psi | 14.1 psi | 22.4 psi | 30.7 psi | 39.0 psi | 47.3 psi | 55.5 psi | 63.8 psi | 72.1 psi | 80.4 psi | −30°C |
| −40°F | 4.9 psi | 12.9 psi | 20.8 psi | 28.8 psi | 36.8 psi | 44.7 psi | 52.7 psi | 60.6 psi | 68.6 psi | 76.5 psi | −40°C |
| Pressure at 20°C (68°F) |
69 kPa | 138 kPa | 207 kPa | 276 kPa | 345 kPa | 414 kPa | 483 kPa | 551 kPa | 620 kPa | 689 kPa | |
| 104°F | 81 kPa | 154 kPa | 228 kPa | 301 kPa | 375 kPa | 449 kPa | 522 kPa | 596 kPa | 670 kPa | 743 kPa | 40°C |
| 86°F | 75 kPa | 146 kPa | 217 kPa | 289 kPa | 360 kPa | 431 kPa | 502 kPa | 574 kPa | 645 kPa | 716 kPa | 30°C |
| 68°F | 69 kPa | 138 kPa | 207 kPa | 276 kPa | 345 kPa | 414 kPa | 483 kPa | 551 kPa | 620 kPa | 689 kPa | 20°C |
| 50°F | 63 kPa | 130 kPa | 196 kPa | 263 kPa | 329 kPa | 396 kPa | 463 kPa | 529 kPa | 596 kPa | 662 kPa | 10°C |
| 32°F | 57 kPa | 122 kPa | 186 kPa | 250 kPa | 314 kPa | 378 kPa | 443 kPa | 507 kPa | 571 kPa | 635 kPa | 0°C |
| 14°F | 52 kPa | 113 kPa | 175 kPa | 237 kPa | 299 kPa | 361 kPa | 423 kPa | 485 kPa | 546 kPa | 608 kPa | −10°C |
| −4°F | 46 kPa | 105 kPa | 165 kPa | 224 kPa | 284 kPa | 343 kPa | 403 kPa | 462 kPa | 522 kPa | 581 kPa | −20°C |
| −22°F | 40 kPa | 97 kPa | 154 kPa | 211 kPa | 269 kPa | 326 kPa | 383 kPa | 440 kPa | 497 kPa | 554 kPa | −30°C |
| −40°F | 34 kPa | 89 kPa | 144 kPa | 199 kPa | 253 kPa | 308 kPa | 363 kPa | 418 kPa | 473 kPa | 527 kPa | −40°C |
See also
- Direct TPMS
- Tyre-pressure gauge
- Tire-pressure monitoring system
References
- "National Automotive Sampling System Tire Pressure Special Study" (PDF). NHTSA. July 26, 2001.
- "Archived copy". Archived from the original on 2016-08-19. Retrieved 2016-06-22.CS1 maint: archived copy as title (link)
- "Tire Pressure Math".