California's 6th congressional district
California's 6th congressional district is a congressional district in the U.S. state of California.
| California's 6th congressional district | |||
|---|---|---|---|
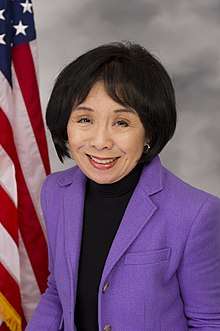
.tif.png) California's 6th congressional district - since January 3, 2013. | |||
| Representative |
| ||
| Median income | $60,661[1] | ||
| Ethnicity | |||
| Cook PVI | D+21[3] | ||
Doris Matsui, a Democrat, has represented the district since January 2013.
Currently, the 6th district encompasses the city of Sacramento and some of its suburbs. It consists of parts of Sacramento and Yolo counties.[4]
Prior to redistricting by the California Citizens Redistricting Commission of 2011, the 6th district encompassed the coastal areas north of San Francisco. It consisted of Marin County and most of Sonoma County. Cities in the district included Santa Rosa, Rohnert Park, Petaluma, Novato, San Rafael, and Mill Valley.
Election results from recent statewide races
| Year | U.S. President | U.S. Senator (Class 1) | U.S. Senator (Class 3) | Governor |
|---|---|---|---|---|
| 1992 | Clinton 55.8 - 23.5%[5] | Feinstein 66.8 - 27.0%[6] | Boxer 60.0 - 30.8%[7] | — |
| 1994 | — | Feinstein 63.7 - 29.5%[8] | Brown 51.8 - 44.2[9] | |
| 1996 | Clinton 56.9% - 28.6%[10] | — | — | — |
| 1998 | — | — | Boxer 63.5 - 32.7%[11] | Davis 66.7 - 27.8%[12] |
| 2000 | Gore 61.9 - 30.1%[13] | Feinstein 63.0 - 27.7%[14] | — | — |
| 2002 | — | — | — | Davis 53.1 - 28.6%[15] |
| 2003 | — | — | — | Recall: No 64.0 - 36.0%[16][17] |
| Bustamante 44.3 - 33.1% | ||||
| 2004 | Kerry 70.3 - 28.1%[18] | — | Boxer 68.3 - 27.5%[19] | — |
| 2006 | — | Feinstein 73.2 - 20.0%[20] | — | Angelides 46.4 - 45.9%[21] |
| 2008 | Obama 76.0 - 22.0%[22] | — | — | — |
| 2010 | — | — | Boxer 66.9 - 28.1%[23] | Brown 67.7 - 28.3%[24] |
| 2012 | Obama 69.1 - 28.3%[25] | Feinstein 71.3 - 28.7%[26] | — | — |
| 2014 | — | — | — | Brown 72.7 - 27.3%[27] |
| 2016 | Clinton 69.1 - 24.4%[28] | — | Harris 67.2 - 32.8%[29] | — |
| 2018 | — | Feinstein 56.6 - 43.4%[30] | — | Newsom 69.4 - 30.6%[31] |
List of representatives
| Representative | Party | Dates | Cong ress(es) |
Notes | Counties |
|---|---|---|---|---|---|
 |
Republican | March 4, 1885 – March 3, 1887 |
49th | Retired. | Alpine, Fresno, Inyo, Kern, Los Angeles, Mono, Monterey, San Benito, San Bernardino, San Diego, San Luis Obispo, Santa Barbara, Tulare, Ventura |
 |
Republican | March 4, 1887 – March 3, 1891 |
50th 51st |
Retired. | |
 |
Republican | March 4, 1891 – March 3, 1893 |
52nd | Redistricted to the 7th district. | |
.jpg) |
Populist | March 4, 1893 – March 3, 1895 |
53rd | Retired. | Los Angeles, Monterey, San Luis Obispo, Santa Barbara, Santa Cruz, Ventura |
 |
Republican | March 4, 1895 – March 3, 1897 |
54th | Lost re-election. | |
.jpg) |
Populist | March 4, 1897 – March 3, 1899 |
55th | Lost re-election. | |
.jpg) |
Republican | March 4, 1899 – March 3, 1901 |
56th | Retired. | |
|
Republican | March 4, 1901 – March 3, 1903 |
57th | Redistricted to the 7th district. | |
 |
Republican | March 4, 1903 – March 3, 1913 |
58th 59th 60th 61st 62nd |
Redistricted from the 7th district. Lost re-election. |
Fresno, Kings, Madera, Merced, Monterey, San Benito, San Joaquin, Santa Cruz, Stanislaus |
 |
Republican | March 4, 1913 – March 3, 1915 |
63rd | Redistricted from the 3rd district. Retired to run for U.S. Senate. |
Alameda |
 |
Progressive | March 4, 1915 – March 3, 1917 |
64th | ||
| Republican | March 4, 1917 – December 15, 1921 |
65th 66th 67th |
Died | ||
| Vacant | December 15, 1921 – November 7, 1922 | ||||
 |
Republican | November 7, 1922 – March 3, 1925 |
67th 68th |
Lost re-nomination | |
 |
Republican | March 4, 1925 – January 3, 1943 |
69th 70th 71st 72nd 73rd 74th 75th 76th 77th |
||
| January 3, 1943 – January 3, 1945 |
78th | Lost re-election. | Alameda, Contra Costa | ||
 |
Democratic | January 3, 1945 – January 3, 1953 |
79th 80th 81st 82nd |
Redistricted to the 8th district. | |
 |
Democratic | January 3, 1953 – January 3, 1955 |
83rd | Lost re-election. | Solano, Contra Costa |
 |
Republican | January 3, 1955 – January 3, 1963 |
84th 85th 86th 87th |
Redistricted to the 14th district. | |
 |
Republican | January 3, 1963 – January 3, 1967 |
88th 89th |
Redistricted from the 4th district. | San Francisco |
| January 3, 1967 – January 3, 1973 |
90th 91st 92nd |
Southeast Marin, western San Francisco | |||
| January 3, 1973 – March 5, 1974 |
93rd | Resigned to become U.S. Representative to the Organization of American States. | Marin, western San Francisco | ||
| Vacant | March 5, 1974 – June 4, 1974 | ||||
 |
Democratic | June 4, 1974 – January 3, 1975 |
93rd | Elected to finish Mailliard's term. Redistricted to the 5th district. | |
 |
Democratic | January 3, 1975 – January 3, 1983 |
94th 95th 96th 97th |
Redistricted from the 5th district. Redistricted to the 5th district. |
Most of San Francisco |
 |
Democratic | January 3, 1983 – January 3, 1993 |
98th 99th 100th 101st 102nd |
Retired after being elected U.S. Senator. | Marin, eastern San Francisco, San Mateo (Daly City), far southwestern Solano, southern Sonoma |
 |
Democratic | January 3, 1993 – January 3, 2003 |
103rd 104th 105th 106th 107th |
Retired. | Marin and southern Sonoma |
| January 3, 2003 – January 3, 2013 |
108th 109th 110th 111th 112th |
 Marin and southern Sonoma | |||
 |
Democratic | January 3, 2013 – present |
113th 114th 115th 116th |
Redistricted from the 5th district. | Portions of Sacramento and Yolo Counties, including the city of Sacramento |
Election results for representatives
|
1884 • 1886 • 1888 • 1890 • 1892 • 1894 • 1896 • 1898 • 1900 • 1902 • 1904 • 1906 • 1908 • 1910 • 1912 • 1914 • 1916 • 1918 • 1920 • 1922 (Special) • 1922 • 1924 • 1926 • 1928 • 1930 • 1932 • 1934 • 1936 • 1938 • 1940 • 1942 • 1944 • 1946 • 1948 • 1950 • 1952 • 1954 • 1956 • 1958 • 1960 • 1962 • 1964 • 1966 • 1968 • 1970 • 1972 • 1974 (Special) • 1974 • 1976 • 1978 • 1980 • 1982 • 1984 • 1986 • 1988 • 1990 • 1992 • 1994 • 1996 • 1998 • 2000 • 2002 • 2004 • 2006 • 2008 • 2010 • 2012 • 2014 • 2016 • 2018 |
1884
| Party | Candidate | Votes | % | ||
|---|---|---|---|---|---|
| Republican | Henry Markham | 17,397 | 49.1 | ||
| Democratic | R. A. Del Valle | 16,990 | 47.9 | ||
| Prohibition | Will D. Gould | 821 | 2.3 | ||
| Populist | Isaac Kinley | 237 | 0.7 | ||
| Total votes | 35,445 | 100.0 | |||
| Republican win (new seat) | |||||
1886
| Party | Candidate | Votes | % | |
|---|---|---|---|---|
| Republican | William Vandever | 18,259 | 47.3 | |
| Democratic | Joseph D. Lynch | 18,204 | 47.1 | |
| Prohibition | W. A. Harris | 2,159 | 5.6 | |
| Total votes | 38,622 | 100.0 | ||
| Republican hold | ||||
1888
| Party | Candidate | Votes | % | |
|---|---|---|---|---|
| Republican | William Vandever (incumbent) | 35,406 | 52.5 | |
| Democratic | Reel B. Terry | 29,453 | 43.7 | |
| Prohibition | J. G. Miller | 2,375 | 3.5 | |
| Know Nothing | Alfred Daggett | 150 | 0.2 | |
| Total votes | 67,384 | 100.0 | ||
| Republican hold | ||||
1890
| Party | Candidate | Votes | % | |
|---|---|---|---|---|
| Republican | William W. Bowers | 33,522 | 51.1 | |
| Democratic | W. J. Curtis | 28,904 | 44.1 | |
| Prohibition | O. R. Dougherty | 3,130 | 4.8 | |
| Total votes | 65,556 | 100.0 | ||
| Republican hold | ||||
1892
| Party | Candidate | Votes | % | |||
|---|---|---|---|---|---|---|
| Populist | Marion Cannon | 20,680 | 56.3 | |||
| Republican | Hervey Lindley | 14,271 | 38.8 | |||
| Prohibition | O. R. Dougherty | 1,805 | 4.9 | |||
| Total votes | 36,756 | 100.0 | ||||
| Populist gain from Republican | ||||||
1894
| Party | Candidate | Votes | % | |||
|---|---|---|---|---|---|---|
| Republican | James McLachlan | 18,746 | 44.3 | |||
| Democratic | George S. Patton | 11,693 | 27.6 | |||
| Populist | W. C. Bowman | 9,769 | 23.1 | |||
| Prohibition | J. E. McComas | 2,120 | 5.0 | |||
| Total votes | 42,328 | 100.0 | ||||
| Republican gain from Populist | ||||||
1896
| Party | Candidate | Votes | % | |||
|---|---|---|---|---|---|---|
| Populist | Charles A. Barlow | 24,157 | 48.9 | |||
| Republican | James McLachlan (incumbent) | 23,494 | 47.6 | |||
| Prohibition | Henry Clay Needham | 1,196 | 2.4 | |||
| Socialist Labor | Job Harriman | 542 | 1.1 | |||
| Total votes | 49,389 | 100.0 | ||||
| Populist gain from Republican | ||||||
1898
| Party | Candidate | Votes | % | |||
|---|---|---|---|---|---|---|
| Republican | Russell J. Waters | 24,050 | 52.6 | |||
| Populist | Charles A. Barlow (incumbent) | 20,499 | 44.9 | |||
| Socialist Labor | James T. Van Ransselaer | 1,132 | 2.5 | |||
| Total votes | 45,681 | 100.0 | ||||
| Republican gain from Populist | ||||||
1900
| Party | Candidate | Votes | % | |
|---|---|---|---|---|
| Republican | James McLachlan | 27,081 | 51.8 | |
| Democratic | William Graves | 19,793 | 37.9 | |
| Socialist | H. G. Wilshire | 3,674 | 7.0 | |
| Prohibition | James Campbell | 1,693 | 3.2 | |
| Total votes | 52,241 | 100.0 | ||
| Republican hold | ||||
1902
| Party | Candidate | Votes | % | |
|---|---|---|---|---|
| Republican | James C. Needham (inc.) | 17,268 | 53.5 | |
| Democratic | Gaston M. Ashe | 13,732 | 42.5 | |
| Socialist | J. L. Cobb | 815 | 2.5 | |
| Prohibition | Joel H. Smith | 466 | 1.4 | |
| Total votes | 32,281 | 100.0 | ||
| Republican hold | ||||
1904
| Party | Candidate | Votes | % | |
|---|---|---|---|---|
| Republican | James C. Needham (inc.) | 18,828 | 55.1 | |
| Democratic | William M. Conley | 13,074 | 38.2 | |
| Socialist | J. L. Cobb | 1,537 | 4.5 | |
| Prohibition | Joel H. Smith | 740 | 2.2 | |
| Total votes | 34,079 | 100.0 | ||
| Republican hold | ||||
1906
| Party | Candidate | Votes | % | |
|---|---|---|---|---|
| Republican | James C. Needham (inc.) | 18,928 | 55.6 | |
| Democratic | Harry A. Greene | 12,868 | 37.8 | |
| Socialist | Richard Kirk | 1,303 | 3.8 | |
| Prohibition | Herman E. Burbank | 964 | 2.8 | |
| Total votes | 34,063 | 100.0 | ||
| Republican hold | ||||
1908
| Party | Candidate | Votes | % | |
|---|---|---|---|---|
| Republican | James C. Needham (inc.) | 21,323 | 52.0 | |
| Democratic | Fred P. Feliz | 15,868 | 38.7 | |
| Socialist | W. M. Pattison | 2,288 | 5.6 | |
| Prohibition | James W. Webb | 1,509 | 3.7 | |
| Total votes | 40,988 | 100.0 | ||
| Republican hold | ||||
1910
| Party | Candidate | Votes | % | |
|---|---|---|---|---|
| Republican | James C. Needham (inc.) | 19,717 | 47.3 | |
| Democratic | A. L. Cowell | 18,408 | 44.2 | |
| Socialist | Richard Kirk | 2,568 | 6.2 | |
| Prohibition | Ira E. Surface | 951 | 2.3 | |
| Total votes | 41,644 | 100.0 | ||
| Republican hold | ||||
1912
| Party | Candidate | Votes | % | |
|---|---|---|---|---|
| Republican | Joseph R. Knowland (inc.) | 35,219 | 53.7 | |
| Socialist | J. Stitt Wilson | 26,234 | 40.0 | |
| Democratic | Hiram A. Luttrell | 4,135 | 6.3 | |
| Total votes | 65,588 | 100.0 | ||
| Republican hold | ||||
1914
| Party | Candidate | Votes | % | |||
|---|---|---|---|---|---|---|
| Progressive | John A. Elston | 44.4 | ||||
| Republican | George H. Derrick | 37.7 | ||||
| Socialist | Howard H. Caldwell | 13.9 | ||||
| Prohibition | Harlow E. Wolcott | 3.9 | ||||
| Total votes | 100.0 | |||||
| Progressive gain from Republican | ||||||
1916
| Party | Candidate | Votes | % | |
|---|---|---|---|---|
| Republican | John A. Elston (incumbent) | 56,520 | 64.6 | |
| Democratic | H. Avery Whitney | 19,787 | 22.6 | |
| Socialist | Luella Twining | 7,588 | 8.7 | |
| Prohibition | Harlow E. Wolcott | 3,605 | 4.1 | |
| Total votes | 87,500 | 100.0 | ||
| Republican hold | ||||
1918
| Party | Candidate | Votes | % | |
|---|---|---|---|---|
| Republican | John A. Elston (incumbent) | 59,082 | 88.4 | |
| Socialist | Luella Twining | 7,721 | 11.6 | |
| Total votes | 66,803 | 100.0 | ||
| Republican hold | ||||
1920
| Party | Candidate | Votes | % | |
|---|---|---|---|---|
| Republican | John A. Elston (incumbent) | 75,610 | 83.3 | |
| Democratic | Maynard Shipley | 15,151 | 16.7 | |
| Total votes | 90,761 | 100.0 | ||
| Republican hold | ||||
1922 (Special)
| Candidate | Votes | % | |
|---|---|---|---|
| James H. MacLafferty | ' | 68.4 | |
| Hugh W. Brunk | 31.6 | ||
| Total votes | 100.0 | ||
| Voter turnout | % | ||
1922
| Party | Candidate | Votes | % | |
|---|---|---|---|---|
| Republican | James H. MacLafferty (inc.) | 59,858 | 66.4 | |
| Democratic | Hugh W. Brunk | 22,711 | 25.2 | |
| Socialist | Elvina S. Beals | 7,616 | 8.4 | |
| Total votes | 90,185 | 100.0 | ||
| Republican hold | ||||
1924
| Party | Candidate | Votes | % | |
|---|---|---|---|---|
| Republican | Albert E. Carter | 68,547 | 57.5 | |
| Independent | John L. Davie | 42,873 | 35.9 | |
| Socialist | Herbert L. Coggins | 7,858 | 6.6 | |
| Total votes | 119,278 | 100.0 | ||
| Republican hold | ||||
1926
| Party | Candidate | Votes | % | |
|---|---|---|---|---|
| Republican | Albert E. Carter (incumbent) | 91,995 | 100.0 | |
| Republican hold | ||||
1928
| Party | Candidate | Votes | % | |
|---|---|---|---|---|
| Republican | Albert E. Carter (incumbent) | 113,579 | 100.0 | |
| Republican hold | ||||
1930
| Party | Candidate | Votes | % | |
|---|---|---|---|---|
| Republican | Albert E. Carter (incumbent) | 110,190 | 100.0 | |
| Republican hold | ||||
1932
| Party | Candidate | Votes | % | |
|---|---|---|---|---|
| Republican | Albert E. Carter (incumbent) | 75,528 | 100.0 | |
| Republican hold | ||||
1934
| Party | Candidate | Votes | % | |
|---|---|---|---|---|
| Republican | Albert E. Carter (incumbent) | 93,213 | 100.0 | |
| Republican hold | ||||
1936
| Party | Candidate | Votes | % | |
|---|---|---|---|---|
| Republican | Albert E. Carter (incumbent) | 103,712 | 91.0 | |
| Socialist | Clarence E. Rust | 8,247 | 7.2 | |
| Communist | Lloyd L. Harris | 2,021 | 1.8 | |
| Total votes | 113,980 | 100.0 | ||
| Republican hold | ||||
1938
| Party | Candidate | Votes | % | |
|---|---|---|---|---|
| Republican | Albert E. Carter (incumbent) | 118,632 | 94.4 | |
| Communist | Dave L. Saunders | 7,015 | 5.6 | |
| Total votes | 125,647 | 100.0 | ||
| Republican hold | ||||
1940
| Party | Candidate | Votes | % | |
|---|---|---|---|---|
| Republican | Albert E. Carter (incumbent) | 131,584 | 96 | |
| Communist | Clarence Paton | 5,426 | 4 | |
| Total votes | 137,010 | 100 | ||
| Republican hold | ||||
1942
| Party | Candidate | Votes | % | |
|---|---|---|---|---|
| Republican | Albert E. Carter (incumbent) | 108,585 | 92.6 | |
| Communist | Clarence Paton | 8,532 | 7.3 | |
| No party | William H. Hollander (write-in) | 185 | 0.1 | |
| Total votes | 117,302 | 100.0 | ||
| Republican hold | ||||
1944
| Party | Candidate | Votes | % | |||
|---|---|---|---|---|---|---|
| Democratic | George Paul Miller | 104,441 | 52 | |||
| Republican | Albert E. Carter (incumbent) | 96,395 | 48 | |||
| Total votes | 200,836 | 100.0 | ||||
| Democratic gain from Republican | ||||||
1946
| Party | Candidate | Votes | % | |
|---|---|---|---|---|
| Democratic | George P. Miller (incumbent) | 118,548 | 100.0 | |
| Democratic hold | ||||
1948
| Party | Candidate | Votes | % | |
|---|---|---|---|---|
| Democratic | George P. Miller (incumbent) | 194,985 | 100.0 | |
| Democratic hold | ||||
1950
| Party | Candidate | Votes | % | |
|---|---|---|---|---|
| Democratic | George P. Miller (incumbent) | 192,342 | 100.0 | |
| Democratic hold | ||||
1952
| Party | Candidate | Votes | % | ||
|---|---|---|---|---|---|
| Democratic | Robert Condon | 87,768 | 50.6 | ||
| Republican | John F. Baldwin, Jr. | 85,756 | 49.4 | ||
| Total votes | 173,524 | 100.0 | |||
| Democratic win (new seat) | |||||
1954
| Party | Candidate | Votes | % | |||
|---|---|---|---|---|---|---|
| Republican | John F. Baldwin, Jr. | 72,336 | 50.9 | |||
| Democratic | Robert Condon (incumbent) | 69,776 | 49.1 | |||
| Total votes | 142,112 | 100.0 | ||||
| Republican gain from Democratic | ||||||
1956
| Party | Candidate | Votes | % | |
|---|---|---|---|---|
| Republican | John F. Baldwin, Jr. (inc.) | 98,683 | 53.7 | |
| Democratic | H. Roberts Quinney | 84,965 | 46.3 | |
| Total votes | 183,648 | 100.0 | ||
| Republican hold | ||||
1958
| Party | Candidate | Votes | % | |
|---|---|---|---|---|
| Republican | John F. Baldwin, Jr. (inc.) | 92,669 | 51 | |
| Democratic | Howard H. Jewel | 89,192 | 49 | |
| Total votes | 181,861 | 100 | ||
| Republican hold | ||||
1960
| Party | Candidate | Votes | % | |
|---|---|---|---|---|
| Republican | John F. Baldwin, Jr. (inc.) | 128,418 | 58.7 | |
| Democratic | Douglas R. Page | 90,260 | 41.3 | |
| Total votes | 218,678 | 100.0 | ||
| Republican hold | ||||
1962
| Party | Candidate | Votes | % | |
|---|---|---|---|---|
| Republican | William S. Mailliard (inc.) | 105,762 | 58.7 | |
| Democratic | John A. O'Connell | 74,429 | 41.3 | |
| Total votes | 180,191 | 100.0 | ||
| Republican hold | ||||
1964
| Party | Candidate | Votes | % | |
|---|---|---|---|---|
| Republican | William S. Mailliard (inc.) | 125,869 | 63.6 | |
| Democratic | Thomas P. O'Toole | 71,894 | 36.3 | |
| Total votes | 197,763 | 100.0 | ||
| Republican hold | ||||
1966
| Party | Candidate | Votes | % | |
|---|---|---|---|---|
| Republican | William S. Mailliard (inc.) | 132,506 | 76.6 | |
| Democratic | Le Rue Grim | 40,514 | 23.4 | |
| Total votes | 173,020 | 100.0 | ||
| Republican hold | ||||
1968
| Party | Candidate | Votes | % | |
|---|---|---|---|---|
| Republican | William S. Mailliard (inc.) | 140,071 | 72.8 | |
| Democratic | Phillip Drath | 52,433 | 27.2 | |
| Total votes | 192,504 | 100.0 | ||
| Republican hold | ||||
1970
| Party | Candidate | Votes | % | |
|---|---|---|---|---|
| Republican | William S. Mailliard (inc.) | 96,393 | 53.3 | |
| Democratic | Russell R. Miller | 84,255 | 46.6 | |
| Total votes | 180,648 | 100.0 | ||
| Republican hold | ||||
1972
| Party | Candidate | Votes | % | |
|---|---|---|---|---|
| Republican | William S. Mailliard (inc.) | 118,197 | 52.0 | |
| Democratic | Roger Boas | 108,934 | 48.0 | |
| Total votes | 227,131 | 100.0 | ||
| Republican hold | ||||
1974 (Special)
| Party | Candidate | Votes | % | |||
|---|---|---|---|---|---|---|
| Democratic | John Burton | 50.0 | ||||
| Republican | Thomas Caylor | 21.1 | ||||
| Democratic | Terrence "T.V." McGuire | 8.7 | ||||
| Republican | Jean Wall | 5.8 | ||||
| Republican | Sean McCarthy | 5.3 | ||||
| Democratic | Alan F. Reeves | 4.1 | ||||
| Republican | Wesley Wilkes | 2.7 | ||||
| Democratic | Leslie Alan Grant | 2.1 | ||||
| Total votes | 100.0 | |||||
| Democratic gain from Republican | ||||||
1974
| Party | Candidate | Votes | % | |
|---|---|---|---|---|
| Democratic | Phillip Burton | 84,585 | 71.3 | |
| Republican | Tom Spinosa | 25,721 | 21.7 | |
| Peace and Freedom | Emily Siegel | 4,753 | 4.0 | |
| American Independent | Carl Richard Davis | 3,456 | 2.9 | |
| Total votes | 118,515 | 100.0 | ||
| Democratic hold | ||||
1976
| Party | Candidate | Votes | % | |
|---|---|---|---|---|
| Democratic | Phillip Burton (incumbent) | 86,493 | 66.1 | |
| Republican | Tom Spinosa | 35,359 | 27.0 | |
| Peace and Freedom | Emily Siegel | 6,570 | 5.0 | |
| American Independent | Raymond O. Heaps | 2,494 | 1.9 | |
| Total votes | 130,916 | 100.0 | ||
| Democratic hold | ||||
1978
| Party | Candidate | Votes | % | |
|---|---|---|---|---|
| Democratic | Phillip Burton (incumbent) | 81,801 | 68.3 | |
| Republican | Tom Spinosa | 33,515 | 27.9 | |
| American Independent | Raymond O. Heaps | 4,452 | 3.7 | |
| Total votes | 119,768 | 100.0 | ||
| Democratic hold | ||||
1980
| Party | Candidate | Votes | % | |
|---|---|---|---|---|
| Democratic | Phillip Burton (incumbent) | 93,400 | 69.3 | |
| Republican | Tom Spinosa | 34,500 | 25.6 | |
| Libertarian | Roy Childs | 6,750 | 5.0 | |
| Total votes | 134,650 | 100.0 | ||
| Democratic hold | ||||
1982
| Party | Candidate | Votes | % | |
|---|---|---|---|---|
| Democratic | Barbara Boxer | 96,379 | 52.3 | |
| Republican | Dennis McQuaid | 82,128 | 44.6 | |
| Libertarian | Howard Crieghton | 3,191 | 1.7 | |
| Peace and Freedom | Timothy-Allen Albertson | 2,366 | 1.3 | |
| Total votes | 184,064 | 100.0 | ||
| Democratic hold | ||||
1984
| Party | Candidate | Votes | % | |
|---|---|---|---|---|
| Democratic | Barbara Boxer (incumbent) | 162,511 | 67.9 | |
| Republican | Douglas Binderup | 71,011 | 29.7 | |
| Libertarian | Howard Crieghton | 5,574 | 2.3 | |
| Total votes | 239,096 | 100.0 | ||
| Democratic hold | ||||
1986
| Party | Candidate | Votes | % | |
|---|---|---|---|---|
| Democratic | Barbara Boxer (incumbent) | 142,946 | 73.8 | |
| Republican | Franklin Ernst III | 50,606 | 26.1 | |
| Total votes | 193,552 | 100.0 | ||
| Democratic hold | ||||
1988
| Party | Candidate | Votes | % | |
|---|---|---|---|---|
| Democratic | Barbara Boxer (incumbent) | 176,645 | 73.3 | |
| Republican | William Steinmetz | 64,174 | 26.6 | |
| Total votes | 240,819 | 100.0 | ||
| Democratic hold | ||||
1990
| Party | Candidate | Votes | % | |
|---|---|---|---|---|
| Democratic | Barbara Boxer (incumbent) | 137,306 | 68.1 | |
| Republican | Bill Boerum | 64,402 | 31.9 | |
| Total votes | 201,708 | 100.0 | ||
| Democratic hold | ||||
1992
| Party | Candidate | Votes | % | |
|---|---|---|---|---|
| Democratic | Lynn Woolsey | 190,322 | 65.2 | |
| Republican | Bill Filante | 98,171 | 33.6 | |
| No party | Write-in | 3,293 | 1.1 | |
| Total votes | 291,786 | 100.0 | ||
| Democratic hold | ||||
1994
| Party | Candidate | Votes | % | |
|---|---|---|---|---|
| Democratic | Lynn Woolsey (incumbent) | 137,642 | 58.1 | |
| Republican | Michael J. Nugent | 88,940 | 37.5 | |
| Libertarian | Louis Beary | 6,203 | 2.6 | |
| Peace and Freedom | Ernest K. Jones, Jr. | 4,055 | 1.7 | |
| Total votes | 236,840 | 100.0 | ||
| Democratic hold | ||||
1996
| Party | Candidate | Votes | % | |
|---|---|---|---|---|
| Democratic | Lynn Woolsey (incumbent) | 156,958 | 61.6 | |
| Republican | Duane C. Hughes | 86,278 | 33.8 | |
| Peace and Freedom | Ernest K. Jones, Jr. | 6,459 | 2.5 | |
| Natural Law | Bruce Kendall | 5,240 | 2.1 | |
| Total votes | 254,935 | 100.0 | ||
| Democratic hold | ||||
1998
| Party | Candidate | Votes | % | |
|---|---|---|---|---|
| Democratic | Lynn Woolsey (incumbent) | 158,446 | 68.0 | |
| Republican | Ken McAuliffe | 69,295 | 29.7 | |
| Natural Law | Alan R. Barreca | 5,240 | 2.2 | |
| Total votes | 232,981 | 100.0 | ||
| Democratic hold | ||||
2000
| Party | Candidate | Votes | % | |
|---|---|---|---|---|
| Democratic | Lynn Woolsey (incumbent) | 182,166 | 64.3 | |
| Republican | Ken McAuliffe | 80,169 | 28.3 | |
| Green | Justin Moscoso | 13,248 | 4.7 | |
| Libertarian | Richard O. Barton | 4,691 | 1.9 | |
| Natural Law | Alan R. Barreca | 2,894 | 1.1 | |
| Total votes | 283,118 | 100.0 | ||
| Democratic hold | ||||
2002
| Party | Candidate | Votes | % | |
|---|---|---|---|---|
| Democratic | Lynn Woolsey (incumbent) | 139,750 | 66.7 | |
| Republican | Paul L. Erickson | 62,052 | 29.7 | |
| Libertarian | Richard O. Barton | 4,936 | 2.3 | |
| Reform | Jeff Rainforth | 2,825 | 1.3 | |
| Total votes | 209,563 | 100.0 | ||
| Democratic hold | ||||
2004
| Party | Candidate | Votes | % | |
|---|---|---|---|---|
| Democratic | Lynn Woolsey (incumbent) | 226,423 | 72.7 | |
| Republican | Paul L. Erickson | 85,244 | 27.3 | |
| Total votes | 311,667 | 100.0 | ||
| Democratic hold | ||||
2006
| Party | Candidate | Votes | % | |
|---|---|---|---|---|
| Democratic | Lynn Woolsey (incumbent) | 173,190 | 70.3 | |
| Republican | Todd Hooper | 64,405 | 26.1 | |
| Libertarian | Richard W. Friesen | 9,028 | 3.6 | |
| Total votes | 246,623 | 100.0 | ||
| Democratic hold | ||||
2008
| Party | Candidate | Votes | % | |
|---|---|---|---|---|
| Democratic | Lynn Woolsey (incumbent) | 229,672 | 71.7 | |
| Republican | Mike Halliwell | 77,073 | 24.1 | |
| Libertarian | Joel R. Smolen | 13,617 | 4.2 | |
| Total votes | 320,362 | 100.0 | ||
| Democratic hold | ||||
2010
| Party | Candidate | Votes | % | |
|---|---|---|---|---|
| Democratic | Lynn Woolsey (incumbent) | 172,216 | 66% | |
| Republican | Jim Judd | 77,361 | 30% | |
| Peace and Freedom | Eugene E. Ruyle | 5,915 | 2% | |
| Libertarian | Joel R. Smolen | 5,660 | 2% | |
| Total votes | 261,152 | 100% | ||
| Democratic hold | ||||
2012
| Party | Candidate | Votes | % | |
|---|---|---|---|---|
| Democratic | Doris Matsui (Incumbent) | 160,667 | 75.1% | |
| Republican | Joseph Mc Cray, Sr. | 53,406 | 24.9% | |
| Total votes | 214,073 | 100.0% | ||
| Democratic hold | ||||
2014
| Party | Candidate | Votes | % | |
|---|---|---|---|---|
| Democratic | Doris Matsui (Incumbent) | 97,008 | 72.7% | |
| Republican | Joseph McCray Sr. | 36,448 | 27.3% | |
| Total votes | 133,456 | 100.0% | ||
| Democratic hold | ||||
2016
| Party | Candidate | Votes | % | |
|---|---|---|---|---|
| Democratic | Doris Matsui (Incumbent) | 177,565 | 75.4% | |
| Republican | Robert Evans | 57,848 | 24.6% | |
| Total votes | 235,413 | 100.0% | ||
| Democratic hold | ||||
2018
| Party | Candidate | Votes | % | ||
|---|---|---|---|---|---|
| Democratic | Doris Matsui (Incumbent) | 162,411 | 80.4% | ||
| Democratic | Jrmar Jefferson | 39,528 | 19.6% | ||
| Total votes | 201,939 | 100.00% | |||
| Democratic hold | |||||
References
- https://www.census.gov/mycd/?st=06&cd=06
- "Citizens Redistricting Commission Final Report, 2011" (PDF).
- "Partisan Voting Index – Districts of the 115th Congress" (PDF). The Cook Political Report. April 7, 2017. Retrieved April 7, 2017.
- "Maps: Final Congressional Districts". Citizens Redistricting Commission. Archived from the original on 2013-03-10. Retrieved February 24, 2013.
- https://elections.cdn.sos.ca.gov/sov/1992-general/ssov/president.pdf
- https://elections.cdn.sos.ca.gov/sov/1992-general/ssov/us-senator.pdf
- https://elections.cdn.sos.ca.gov/sov/1992-general/ssov/us-senator.pdf
- https://elections.cdn.sos.ca.gov/sov/1994-general/ssov/us-senate-congress-district.pdf
- https://elections.cdn.sos.ca.gov/sov/1994-general/ssov/governor-congress-district.pdf
- https://elections.cdn.sos.ca.gov/sov/1996-general/ssov/president-congress-district.pdf
- https://web.archive.org/web/20110929224732/http://www.sos.ca.gov/elections/sov/1998-general/ssov/sen-cd.pdf#
- https://web.archive.org/web/20110929224728/http://www.sos.ca.gov/elections/sov/1998-general/ssov/gov-cd.pdf#
- Statement of Vote (2000 President) Archived 2007-06-11 at the Wayback Machine
- Statement of Vote (2000 Senator) Archived 2007-06-11 at the Wayback Machine
- Statement of Vote (2002 Governor) Archived 2010-11-11 at the Wayback Machine
- Statement of Vote (2003 Recall Question) Archived 2011-05-20 at the Wayback Machine
- Statement of Vote (2003 Governor) Archived 2011-05-20 at the Wayback Machine
- Statement of Vote (2004 President) Archived 2010-08-01 at the Wayback Machine
- Statement of Vote (2004 Senator) Archived 2011-08-10 at the Wayback Machine
- Statement of Vote (2006 Senator) Archived 2011-08-10 at the Wayback Machine
- Statement of Vote (2006 Governor) Archived 2011-08-10 at the Wayback Machine
- California Secretary of State. Supplement to the Statement of Vote. President. Counties by Congressional District. Archived 2010-07-24 at the Wayback Machine
- https://elections.cdn.sos.ca.gov/sov/2010-general/ssov/us-senate-congressional-dists.pdf
- https://elections.cdn.sos.ca.gov/sov/2010-general/ssov/governor-congressional.pdf
- https://elections.cdn.sos.ca.gov/sov/2012-general/ssov/pres-by-congress.pdf
- https://elections.cdn.sos.ca.gov/sov/2012-general/ssov/us-senate-by-congress.pdf
- https://elections.cdn.sos.ca.gov/sov/2014-general/ssov/governor-congressional.pdf
- https://elections.cdn.sos.ca.gov/sov/2016-general/ssov/pres-by-congress.pdf
- https://elections.cdn.sos.ca.gov/sov/2016-general/ssov/us-senate-by-congress.pdf
- https://elections.cdn.sos.ca.gov/sov/2018-general/ssov/us-senate-by-congress.pdf
- https://elections.cdn.sos.ca.gov/sov/2018-general/ssov/governor-congressional.pdf
- 1920 election results
- 1922 special election results
- 1922 election results
- 1924 election results
- 1926 election results
- 1928 election results
- 1930 election results
- 1932 election results
- 1934 election results
- 1936 election results
- 1938 election results
- 1940 election results
- 1942 election results
- 1944 election results
- 1946 election results
- 1948 election results
- 1950 election results
- 1952 election results
- 1954 election results
- 1956 election results
- 1958 election results
- 1960 election results
- 1962 election results
- 1964 election results
- 1966 election results
- 1968 election results
- 1970 election results
- 1972 election results
- 1974 special election results
- 1974 election results
- 1976 election results
- 1978 election results
- 1980 election results
- 1982 election results
- 1984 election results
- 1986 election results
- 1988 election results
- 1990 election results
- 1992 election results
- 1994 election results
- 1996 election results
- 1998 election results
- 2000 election results
- 2002 election results Archived February 3, 2009, at the Wayback Machine
- 2004 election results
- 2006 election results Archived November 27, 2008, at the Wayback Machine
- California Secretary of State. 2008 election results Archived December 21, 2008, at the Wayback Machine
- "House Results Map". The New York Times.
- https://elections.cdn.sos.ca.gov/sov/2012-general/06-sov-summary.xls
- https://elections.cdn.sos.ca.gov/sov/2014-general/xls/06-summary.xls
- https://elections.cdn.sos.ca.gov/sov/2016-general/sov/csv-candidates.xls
External links
- GovTrack.us: California's 6th congressional district
- RAND California Election Returns: District Definitions (out of date)
- California Voter Foundation map - CD06 (out of date)