2018 North Indian Ocean cyclone season
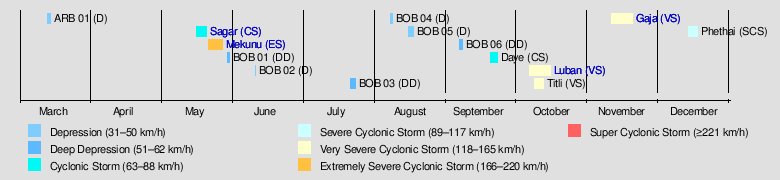
The 2018 North Indian Ocean cyclone season was the most active North Indian Ocean cyclone season since 1992, with the formation of fourteen depressions and seven cyclones. The North Indian Ocean cyclone season has no official bounds, but cyclones tend to form between April and December, with the two peaks in May and November. These dates conventionally delimit the period of each year when most tropical cyclones form in the northern Indian Ocean.
| 2018 North Indian Ocean cyclone season | |
|---|---|
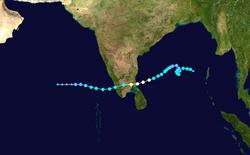
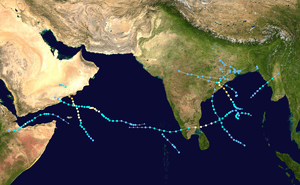 Season summary map | |
| Seasonal boundaries | |
| First system formed | March 13, 2018 |
| Last system dissipated | December 17, 2018 |
| Strongest storm | |
| Name | Mekunu |
| • Maximum winds | 175 km/h (110 mph) (3-minute sustained) |
| • Lowest pressure | 960 hPa (mbar) |
| Seasonal statistics | |
| Depressions | 14 |
| Deep depressions | 10 |
| Cyclonic storms | 7 |
| Severe cyclonic storms | 5 |
| Very severe cyclonic storms | 4 |
| Extremely severe cyclonic storms | 1 |
| Total fatalities | 343 total |
| Total damage | $4.32 billion (2018 USD) |
| Related articles | |
The scope of this article is limited to the Indian Ocean in the Northern Hemisphere, east of the Horn of Africa and west of the Malay Peninsula. There are two main seas in the North Indian Ocean — the Arabian Sea to the west of the Indian subcontinent, abbreviated ARB by the India Meteorological Department (IMD); and the Bay of Bengal to the east, abbreviated BOB by the IMD.
The official Regional Specialized Meteorological Centre in this basin is the India Meteorological Department (IMD), while the Joint Typhoon Warning Center (JTWC) and the National Meteorological Center of CMA (NMC) unofficially release full advisories. On average, three to four cyclonic storms form in this basin every season.[1][2]
Season summary
Systems
Depression ARB 01
| Depression (IMD) | |
  | |
| Duration | March 13 – March 14 |
|---|---|
| Peak intensity | 45 km/h (30 mph) (3-min) 1006 hPa (mbar) |
A trough developed near the equator in the eastern Indian Ocean on March 7. A low pressure area formed on March 10 to the southwest of Sri Lanka, in an area with warm sea surface temperatures and low wind shear. Moving into the eastern Arabian Sea, the low organized into a depression on March 13 at the low latitude of 5° N. After its formation, the depression encountered cooler, drier air, which prevented the system from strengthening beyond an intensity of 45 km/h (30 mph). Moving northwest, the depression passed between the Maldives and the Lakshadweep islands, and weakened into a remnant low pressure area on March 15.[3]
Officials advised fishermen to avoid sailing off India's southwest coast for a few days.[4] The depression produced heavy rainfall across southern India.[3] The coastal port city of Thoothukudi near the southern tip of India recorded 200 mm (7.9 in) on March 13,[3] its highest daily precipitation ever recorded. Minicoy Island in Lakshadweep received 177 mm (7.0 in) of rain from the system.[5] Heavy rainfall also occurred in Aryankavu, Kerala, and Chintamani, Karnataka.[3]
Cyclonic Storm Sagar
| Cyclonic storm (IMD) | |
| Category 1 tropical cyclone (SSHWS) | |
  | |
| Duration | May 16 – May 20 |
|---|---|
| Peak intensity | 85 km/h (50 mph) (3-min) 994 hPa (mbar) |
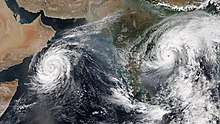
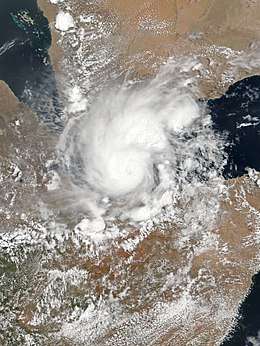
A low pressure area formed on May 14 near Socotra in the western Arabian Sea.[6] The weather system moved northwestward, steered by a ridge to the northeast and the flow of the regional geography.[7] On May 16, the India Meteorological Department (IMD) classified the low as a depression at 12:00 UTC about 200 km (125 mi) northeast of Cape Guardafui, Somalia.[6] On the same day, the JTWC designated the depression as Tropical Cyclone 01A.[8] The IMD upgraded the system to a cyclonic storm on May 17, naming it Sagar. The storm entered the Gulf of Aden that day, gradually intensifying while paralleling the coast of Yemen.[6] Sagar developed an eye on microwave imagery, a sign of an intensifying storm.[9] Late on May 18, the IMD estimated Sagar's peak intensity at 85 km/h (50 mph).[6] Around the same time, the JTWC estimated Sagar attained peak 1 minute sustained winds of 120 km/h (75 mph), while located about 165 km (105 mi) south of Aden, Yemen, or about 95 km (60 mi) north of Berbera, Somalia.[8] Sagar weakened slightly before it made landfall near Lughaya in northwestern Somaliland, with winds of 75 km/h (45 mph) according to the IMD.[6] According to the JTWC, Sagar was the strongest tropical cyclone on record to strike Somalia, with estimated 1-minute landfalling winds of 95 km/h (60 mph). The storm also made the westernmost landfall in the North Indian Ocean, surpassing a tropical storm in 1984, which took a nearly identical track to the east.[10][11] Sagar rapidly weakened over land, degenerating into a low pressure area over eastern Ethiopia on May 20.[6]
The cyclone first affected Socotra, and later the Yemeni mainland, producing locally heavy rainfall and flooding.[12] High winds from Sagar contributed to a house fire near Aden, resulting in one fatality.[13] In parts of northern Somalia and Somaliland, Sagar dropped a years' worth of heavy rainfall, or around 200 mm (7.9 in), resulting in deadly flash flooding.[14] The floods washed out farms, livestock, boats, and houses, forcing families to evacuate.[15] Roads, medical facilities, and other infrastructure were also damaged. Three people died in Puntland and another 50 people died in Somaliland due to Sagar.[16] In neighboring Djibouti, flooding from the storm damaged about 10,000 houses, with damage in the country estimated at US$30 million.[17] Two people died in the country.[18] In the Somali Region of eastern Ethiopia, Sagar produced strong winds and heavy rainfall, resulting in flooding and landslides. Near the border of SNNPR and Oromia, a landslide killed 23 people.[19][20]
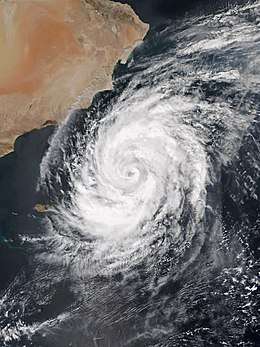
Extremely Severe Cyclonic Storm Mekunu
| Extremely severe cyclonic storm (IMD) | |
| Category 3 tropical cyclone (SSHWS) | |
  | |
| Duration | May 21 – May 27 |
|---|---|
| Peak intensity | 175 km/h (110 mph) (3-min) 960 hPa (mbar) |
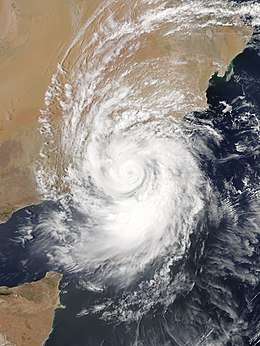
An area of convection developed to the northwest of the Maldives on May 18.[21] Over the next two days, it became better organized and the IMD reported that it had developed into a low pressure area on May 20, giving it the identifier ARB 03.[22] The system slowly drifted northwestwards into favorable environment for tropical cyclogenesis and developed good outflow.[23] The JTWC issued a TCFA on May 21 after convective bands began to wrap into the broad low-level circulation center (LLCC).[24] Around the same time, the IMD had announced that the system intensified into a depression.[25] Over the next 24 hours, the depression continued to drift further northwestwards into warm waters and faced low vertical wind shear. As a result, it continued to intensify and the JTWC began tracking it as a tropical storm.[26] Subsequently, the IMD upgraded it to a deep depression[27] and Cyclonic Storm Mekunu later the same day.[28] Multi-spectral satellite imagery revealed that Mekunu had developed an eye as early as May 23,[29] at which time the IMD upgraded it to a severe cyclonic storm.[30] Benefiting from favorable environmental conditions, the cyclone became more symmetric,[31] intensifying into a very severe cyclonic storm six hours later.[32] The cyclone continued to track northwestward under the influence of a subtropical ridge.[33] On May 25, it reached its peak intensity as an extremely severe cyclonic storm, with the JTWC estimating peak 1-minute sustained winds of 185 km/h (115 mph), equivalent to a Category 3 storm on the Saffir-Simpson scale.
Under the influence of Mekunu, Socotra received widespread rainfall leading to flash flooding and downed power lines. At least 40 people were initially reported to be missing after two ships were capsized off Socotra.[34] Mekunu made landfall on the Omani coast near the city of Salalah at peak intensity. Gusts of 67 mph (108 km/h) were recorded at the Salalah Airport before the landfall while areas in the Salalah recorded rainfall of 194 mm (7.6 in).[35] As of 31 May, at least 30 people have died in Oman and Yemen due to Mekunu, including 20 on Socotra, four in Yemen,[36] and six in Oman.[37] Insurance claims in Oman reached ﷼108 million (US$281 million).[38][39]
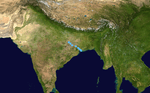
Deep Depression BOB 01
| Deep depression (IMD) | |
| Tropical storm (SSHWS) | |
  | |
| Duration | May 29 – May 30 |
|---|---|
| Peak intensity | 55 km/h (35 mph) (3-min) 992 hPa (mbar) |
Myanmar's Meteorology and Hydrology Department issued a red-code emergency alert warning on Tuesday prior to landfall.[40] Strong wind, along with torrential rain, destroyed over 500 houses in Shwe Pyi Tha township in Myanmar's Yangon region. The strong wind knocked down trees and destroyed many houses, cutting power supply in the township.[41] Temporary shelters were set up to accommodate the homeless victims with aid provided. On the same day, heavy rain and strong wind also blew off tree branches in Hmawbi, Dagon Myothit-north and other townships.[41] The local authorities have suspended the waterway of Angumaw-Sittway for three days.[41]
Depression BOB 02
| Depression (IMD) | |
  | |
| Duration | June 10 – June 10 |
|---|---|
| Peak intensity | 45 km/h (30 mph) (3-min) 988 hPa (mbar) |
Squally weather affected the maritime ports, North Bay, and adjoining coastal areas of Bangladesh. The maritime ports of Chattogram, Cox's Bazar, Mongla and Payra had been advised to keep hoisted local cautionary signal No. 3. In Patenga, 150 mm of rain was recorded within the previous two days.[42]
Deep Depression BOB 03
| Deep depression (IMD) | |
  | |
| Duration | July 21 – July 23 |
|---|---|
| Peak intensity | 55 km/h (35 mph) (3-min) 988 hPa (mbar) |
The system continued to move west-northwestward and reached western Uttar Pradesh and the Indian capital of New Delhi by July 26, causing widespread rain over the region. Meerut in Uttar Pradesh received 226 mm of rain in 24 hours, on July 27, while Delhi received 83 mm over a period of 5 days, beginning on July 26. At least 69 people were killed in Uttar Pradesh, due to heavy rains from the storm as a low-pressure area.[43][44] The river Yamuna crossed the danger level of 204.83 meters in the national capital of Delhi on July 27, and reached to 205.5 meters by July 29, nearly 70 cm above the danger level, prompting the evacuation of more than 1,500 people in Delhi.[45]
Depression BOB 04
| Depression (IMD) | |
  | |
| Duration | August 7 – August 8 |
|---|---|
| Peak intensity | 45 km/h (30 mph) (3-min) 992 hPa (mbar) |
Depression BOB 05
| Depression (IMD) | |
  | |
| Duration | August 15 – August 17 |
|---|---|
| Peak intensity | 45 km/h (30 mph) (3-min) 993 hPa (mbar) |
Deep Depression BOB 06
| Deep depression (IMD) | |
  | |
| Duration | September 6 – September 7 |
|---|---|
| Peak intensity | 55 km/h (35 mph) (3-min) 990 hPa (mbar) |
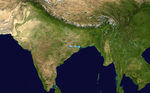
Cyclonic Storm Daye
| Cyclonic storm (IMD) | |
| Tropical storm (SSHWS) | |
  | |
| Duration | September 19 – September 22 |
|---|---|
| Peak intensity | 65 km/h (40 mph) (3-min) 992 hPa (mbar) |
On September 19, a depression formed over the east central Bay of Bengal, receiving the designation BOB 07. Soon afterward, the JTWC has issued a Tropical Cyclone Formation Alert (TCFA). Early on September 20, the storm intensified into a deep depression over the west central Bay of Bengal. The system intensified further, becoming Cyclonic Storm Daye later that day, while situated over the northwestern Bay of Bengal. Early on September 21, Daye made landfall on south Odisha, also impacting the adjoining north Andhra Pradesh coast near Gopalpur, during the morning, local time, resulting in heavy rains and strong winds of 65 to 75 km/h in various districts in the regions. Upon its landfall, Daye brought heavy to very heavy rainfall in various districts of Odisha. Following landfall, Daye weakened into a depression. Over the next two days, Daye continued moving westward, while dropping heavy amounts of rain across India. On September 22, Daye weakened into a well-marked low, with the IMD issuing its final advisory on the system.[46]
Prior to the cyclone's landfall at midnight, local time, on September 21, the government of Odisha deployed emergency teams in Malkangiri, with more teams on standby in Rayagada, Gajapati, and Puri. One NDRF team had each been deployed in Kalahandi, Rayagada, Gajapati, Puri, Nayagarh, and Kandhamal districts, with 17 boats and other emergency equipment. Local cautionary Signal Number LC-III had been kept hoisted at all ports of Odisha when the cyclone was a deep depression.[46]
Malkangiri was worst affected, with many houses submerged. Several parts of outer Malkangiri city and rural areas of the district reportedly received heavy cyclonic rains. Several houses had submerged into water, leaving many people homeless. According to reports, a maximum rainfall total of 284 mm was recorded at Malkangiri by the India Meteorological department (IMD). In Balasore District, the water was flowing above the danger level in the Jalaka River. Water level increased in the Kolab Dam and two gates were opened.[46]
The outer rainbands of the storm dropped extremely heavy rain in the southern parts of West Bengal. Digha recorded 229 mm of rain, Contai received 331 mm of rain, Diamond Harbour recorded 66 mm of rain, Midnapore received 79 mm of rain, and Halisahar recorded 51 mm of rain. Torrential rains and flash floods were also reported in Himachal Pradesh, Uttarakhand, and Punjab, resulting in at least 25 deaths. The floodgates of the famous Sukhna Lake in Chandigarh were opened, for the first time in 10 years.[46]
As Daye weakened into a low-pressure area, the storm interacted with another western disturbance to the north, leading to widespread rainfall in the northern Himalayas and the plains to the south, from September 22–24. Delhi received heavy rains between September 22–24 totaling 58.6 mm, resulting in severe waterlogging. Maximum temperatures in Delhi were up to 6 Degrees Celsius below normal. Amritsar in Punjab received large amounts of rainfall ending early on September 24, with a total of 203.0 mm, while Karnal in Haryana received one of its highest 24-hour rainfall totals in September, with a total of 142.0 mm.[46]
Very Severe Cyclonic Storm Luban
| Very severe cyclonic storm (IMD) | |
| Category 2 tropical cyclone (SSHWS) | |
  | |
| Duration | October 6 – October 15 |
|---|---|
| Peak intensity | 140 km/h (85 mph) (3-min) 978 hPa (mbar) |
On October 14, Cyclonic Storm Luban struck Yemen in the midst of a civil war and a cholera outbreak,[47] and forced 2,203 families to leave their houses, utilizing 38 schools for shelter. The storm killed 14 people in the country, and injured another 124 people, with 10 people were still missing.[48][49] Public loss in Yemen were at US$1 billion.[50]
Very Severe Cyclonic Storm Titli
| Very severe cyclonic storm (IMD) | |
| Category 3 tropical cyclone (SSHWS) | |
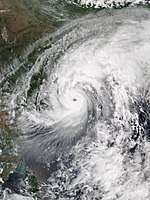  | |
| Duration | October 8 – October 12 |
|---|---|
| Peak intensity | 150 km/h (90 mph) (3-min) 970 hPa (mbar) |
On October 6, a low-pressure area formed in the Andaman Sea. Over the next two days, the disaster entered the Bay of Bengal and became a depression on October 8, receiving the designation BOB 08 from the IMD. Afterward, the storm rapidly strengthened, becoming a Very Severe Cyclonic Storm on October 9, with the strength of a Category 2 hurricane on the Saffir–Simpson scale (SSHWS).
Between 4:30 a.m. and 5:30 a.m. IST on October 11 (23:00–00:00 UTC on October 10–11), Titli made landfall near Palasa, Andhra Pradesh, at peak intensity.
Titli killed at least 77 people in Odisha and left a couple of others missing, due to heavy flooding and landslides,[51] and caused another 8 deaths in Andhra Pradesh.[52] The storm weakened into a depression before entering West Bengal, wreaking havoc in some parts of South Bengal, and bringing torrential rain and gale-force wind.[53] Damage from flooding caused by Titli totaled at ₹3,673.1 crore (US$507 million) in Andhra Pradesh,[54] and ₹3,000 crore (US$413 million) in Odisha.[55]
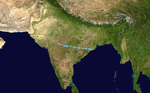
Very Severe Cyclonic Storm Gaja
| Very severe cyclonic storm (IMD) | |
| Category 1 tropical cyclone (SSHWS) | |
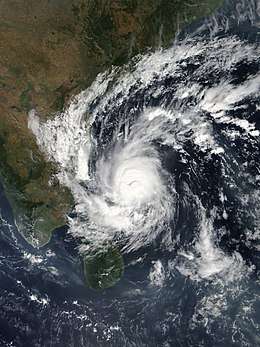  | |
| Duration | November 10 – November 19 |
|---|---|
| Peak intensity | 130 km/h (80 mph) (3-min) 976 hPa (mbar) |
On November 5, a low pressure system formed over the Gulf of Thailand. The system crossed through Southern Thailand and the Malay Peninsula on November 8. On the next day, it crossed into the Andaman Sea and lingered there, organizing further throughout the day, before intensifying into a depression over the Bay of Bengal on November 10, with the IMD designating the system as Depression BOB 09. Soon afterward, the Joint Typhoon Warning Center (JTWC) issued a Tropical Cyclone Formation Alert (TCFA) on the system. At 00:00 UTC on November 11, the deep depression strengthened into a cyclonic storm, and was named Gaja. After tracking west-southwestward for a number of days, it made landfall in southern India, on November 16. The storm survived crossing over into the Arabian Sea later that day; however, it degenerated into a remnant low in hostile conditions only several days later, on November 20. On the next day, the storm's remnants dissipated near Socotra.
In India, 52 people were killed by the storm.[56] Damage nationwide was about ₹54,000 crore (US$775 million).[57]
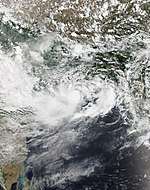
Severe Cyclonic Storm Phethai
| Severe cyclonic storm (IMD) | |
| Tropical storm (SSHWS) | |
  | |
| Duration | December 13 – December 17 |
|---|---|
| Peak intensity | 100 km/h (65 mph) (3-min) 992 hPa (mbar) |
An area of convection developed in the southern Bay of Bengal on December 13. The disturbance was forecasted having little chance to develop; however, the storm's convection persisted and organized, resulting in the storm being classified as Depression BOB 10. The depression gradually organized and intensified into a deep depression on December 14. Within 24 hours, the deep depression attained 3-minute sustained winds of 40 mph, and the storm was named Phethai. Phethai steadily strengthened and on December 16, Phethai peaked with 65 mph winds and at severe cyclonic storm status. The storm steadily weakened and made landfall at Katrenikona on December 17, with 3-minute sustained winds of 50 mph. Phethai rapidly weakened as it traversed Andhra Pradesh, and finally dissipated over a tropical rainforest south west of Kolkata.
Eight people were reported dead after Phethai,[58] and the agricultural damage in Andhra Pradesh was estimated at ₹294.54 crore (US$41.1 million).[59][60]
Storm names
Within this basin, a tropical cyclone is assigned a name when it is judged to have reached Cyclonic Storm intensity, with winds of 65 km/h (40 mph). The names were selected by members of the ESCAP/WMO panel on Tropical Cyclones between 2000 and May 2004, before the Regional Specialized Meteorological Center in New Delhi started to assign names in September 2004. There is no retirement of tropical cyclone names in this basin, as the list of names is only scheduled to be used once before a new list of names is drawn up. Should a named tropical cyclone move into the basin from the Western Pacific, then it will retain its original name. The next eight available names from the List of North Indian Ocean storm names are below.
|
|
|
Season effects
This is a table of all storms in the 2018 North Indian Ocean cyclone season. It mentions all of the season's storms and their names, duration, peak intensities (according to the IMD storm scale), damage, and death totals. Damage and death totals include the damage and deaths caused when that storm was a precursor wave or extratropical low, and all of the damage figures are in 2018 USD.
| Name | Dates active | Peak classification | Sustained wind speeds |
Pressure | Areas affected | Damage (USD) |
Deaths | Refs |
|---|---|---|---|---|---|---|---|---|
| ARB 01 | March 13 – 14 | Depression | 45 km/h (30 mph) | 1006 hPa (29.71 inHg) | South India, Maldives | None | None | |
| Sagar | May 16 – 20 | Cyclonic storm | 85 km/h (50 mph) | 994 hPa (29.35 inHg) | Yemen, Horn of Africa | $30 million | 79 | [61][62][63] |
| Mekunu | May 21 – 27 | Extremely severe cyclonic storm | 175 km/h (110 mph) | 960 hPa (28.35 inHg) | Yemen, Oman, Saudi Arabia | $1.5 billion | 31 | [36][37][64] |
| BOB 01 | May 29 – 30 | Deep depression | 55 km/h (35 mph) | 992 hPa (29.29 inHg) | Myanmar | None | 5 | [65] |
| BOB 02 | June 10 – 10 | Depression | 45 km/h (30 mph) | 988 hPa (29.18 inHg) | Bangladesh | None | None | |
| BOB 03 | July 21 – 23 | Deep depression | 55 km/h (35 mph) | 988 hPa (29.18 inHg) | East India, North India | Unknown | 69 | |
| BOB 04 | August 7 – 8 | Depression | 45 km/h (30 mph) | 992 hPa (29.29 inHg) | East India | None | None | |
| BOB 05 | August 15 – 17 | Depression | 45 km/h (30 mph) | 993 hPa (29.32 inHg) | East India, Central India, West India | Unknown | None | |
| BOB 06 | September 6 – 7 | Deep depression | 55 km/h (35 mph) | 990 hPa (29.23 inHg) | East India | Unknown | None | |
| Daye | September 19 – 22 | Cyclonic storm | 65 km/h (40 mph) | 992 hPa (29.29 inHg) | Andhra Pradesh, East India, Central India, North India | Minimal | None | |
| Luban | October 6 – 15 | Very severe cyclonic storm | 140 km/h (85 mph) | 978 hPa (28.88 inHg) | Yemen, Oman | $1 billion | 14 | [48][50] |
| Titli | October 8 – 12 | Very severe cyclonic storm | 150 km/h (90 mph) | 972 hPa (28.70 inHg) | Andhra Pradesh, Odisha, West Bengal, Bangladesh | $920 million | 85 | [51][52][54][55][66] |
| Gaja | November 10 – 19 | Very severe cyclonic storm | 130 km/h (80 mph) | 976 hPa (28.82 inHg) | Andaman Islands, Tamil Nadu (India), Sri Lanka | $775 million | 52 | [56] |
| Phethai | December 13 – 17 | Severe cyclonic storm | 100 km/h (65 mph) | 992 hPa (29.29 inHg) | East India, Northeast India | $100 million | 8 | [58] |
| Season aggregates | ||||||||
| 14 systems | March 13 – December 17 | 175 km/h (110 mph) | 960 hPa (28.35 inHg) | $4.33 billion | 343 | |||
See also
- Tropical cyclones in 2018
- 2018 Atlantic hurricane season
- 2018 Pacific hurricane season
- 2018 Pacific typhoon season
- South-West Indian Ocean cyclone seasons: 2017–18, 2018–19
- Australian region cyclone seasons: 2017–18, 2018–19
- South Pacific cyclone seasons: 2017–18, 2018–19
References
- "Annual Frequency of Cyclonic Disturbances (Maximum Wind Speed of 17 Knots or More), Cyclones (34 Knots or More) and Severe Cyclones (48 Knots or More) Over the Bay of Bengal (BOB), Arabian Sea (AS) and Land Surface of India" (PDF). India Meteorological Department. Retrieved 30 October 2015.
- RSMC — Tropical Cyclones New Delhi (2010). Report on Cyclonic Disturbances over North Indian Ocean during 2009 (PDF) (Report). India Meteorological Department. pp. 2–3. Archived from the original (PDF) on 2010-04-06. Retrieved May 24, 2011.
- Depression over southeast Arabian Sea and adjoining equatorial Indian Ocean (13-15 March, 2018): A Report (PDF) (Report). India Meteorological Department. April 2018. Retrieved July 4, 2020.
- "Depression over Southeast Arabian Sea to intensify; rainfall anticipated in Tamil Nadu and Kerala". The New Indian Express. Asian News International. March 14, 2018. Retrieved July 4, 2020.
- Waghmare, Abhishek (14 March 2018). "Why the second depression in Arabian Sea in 125 years may be a damp squib". Business Standard India – via Business Standard.
- Cyclonic Storm “Sagar” over Arabian Sea (16 – 21 May 2018): Summary (PDF) (Report). India Meteorological Department. May 2018. Retrieved June 11, 2018.
- "Tropical Cyclone 01A (One) Warning NR 001". Joint Typhoon Warning Center. May 16, 2018. Archived from the original on May 17, 2018. Retrieved May 19, 2018.
- 2018 Annual Tropical Cyclone Report (PDF) (Report). Joint Typhoon Warning Center. p. 82. Retrieved July 4, 2020.
- "Tropical Cyclone 01A (One) Warning NR 003". Joint Typhoon Warning Center. May 17, 2018. Archived from the original on May 17, 2018. Retrieved May 19, 2018.
- Henson, Bob. "Sagar Pounds Somalia; New Cyclone May Threaten Oman". Weather Underground. Retrieved 21 May 2018.
- "Tropical Cyclone Sagar Leaves 16 Dead in Middle East, East Africa - The Weather Channel".
- "Yemen Humanitarian Update Covering 15 – 21 May 2018" (PDF). United Nations Office for the Coordination of Humanitarian Affairs. May 21, 2018. ReliefWeb. Retrieved May 27, 2018.
- "One Dead as Tropical Cyclone Sagar Brings Life-Threatening Flood Threat to Somalia, Djibouti, Yemen". The Weather Channel. May 19, 2018. Retrieved May 29, 2018.
- OCHA Flash Update #3 - Tropical Cyclone Sagar. United Nations Office for the Coordination of Humanitarian Affairs (Report). May 23, 2018. ReliefWeb. Retrieved May 26, 2018.
- "OCHA Flash Update #1" (PDF). United Nations Office for the Coordination of Humanitarian Affairs. ReliefWeb. May 19, 2018. Retrieved May 19, 2018.
- OCHA Flash Update #4 Tropical Cyclone Sagar (PDF). United Nations Office for the Coordination of Humanitarian Affairs (Report). June 14, 2018. ReliefWeb. Retrieved July 3, 2018.
- UNICEF Djibouti Humanitarian Situation Report, June 2018. United Nations Children Fund (Report). June 30, 2018. ReliefWeb. Retrieved August 7, 2018.
- Djibouti: Flood Analysis and Evolution, Tropical Cyclone Sagar-18 (24 May 2018). UNOSAT (Report). May 24, 2018. ReliefWeb. Retrieved May 26, 2018.
- Ethiopia – Floods Flash Update #3, 22 May 2018. United Nations Office for the Coordination of Humanitarian Affairs (Report). May 22, 2018. ReliefWeb. Retrieved May 26, 2018.
- World Vision East Africa Hunger Crisis Situation Report: Ethiopia (PDF). World Vision (Report). June 19, 2018. ReliefWeb. Retrieved July 3, 2018.
- "Significant Tropical Weather Advisory for the Indian Ocean: 18 May 2018, 1800Z". National Oceanic and Atmospheric Administration. Archived from the original on 19 May 2018. Retrieved 25 May 2018.
- "Informatory Message: 01 (ARB 03/2018)" (PDF). India Meteorological Department. Archived from the original (PDF) on 20 May 2018. Retrieved 25 May 2018.
- "Significant Tropical Weather Advisory For The Indian Ocean Reissued: 21 May 2018, 0400Z". National Oceanic and Atmospheric Administration. Archived from the original on 21 May 2018. Retrieved 25 May 2018.
- "Tropical Cyclone Formation Alert". Joint Typhoon Warning Center. Archived from the original on 22 May 2018. Retrieved 25 May 2018.
- "Bulletin No. : 01 (ARB 03/2018)" (PDF). India Meteorological Department. Archived from the original (PDF) on 22 May 2018. Retrieved 25 May 2018.
- "Tropical Cyclone 02A (Two) Warning Nr 001". Joint Typhoon Warning Center. Archived from the original on 22 May 2018. Retrieved 25 May 2018.
- "Deep Depression ARB 03: Bulletin 04" (PDF). India Meteorological Department. Archived from the original (PDF) on 22 May 2018. Retrieved 25 May 2018.
- "Cyclonic Storm Mekunu: Bulletin 07" (PDF). India Meteorological Department. Archived from the original (PDF) on 23 May 2018. Retrieved 25 May 2018.
- "Tropical Cyclone 02A (Mekunu) Warning Nr 006". Joint Typhoon Warning Center. Archived from the original on 23 May 2018. Retrieved 25 May 2018.
- "Severe Cyclonic Storm Mekunu: Bulletin 12" (PDF). India Meteorological Department. Archived from the original (PDF) on 23 May 2018. Retrieved 25 May 2018.
- "Tropical Cyclone 02A (Mekunu) Warning Nr 007". Joint Typhoon Warning Center. Archived from the original on 24 May 2018. Retrieved 25 May 2018.
- "Very Severe Cyclonic Storm Mekunu: Bulletin 14" (PDF). India Meteorological Department. Archived from the original (PDF) on 23 May 2018. Retrieved 25 May 2018.
- "Tropical Cyclone 02A (Mekunu) Warning Nr 014". Joint Typhoon Warning Center. Archived from the original on 25 May 2018. Retrieved 25 May 2018.
- "In case you missed it: Deadly Cyclone Mekunu slams Socotra; Sinkhole opens on White House lawn". AccuWeather. Archived from the original on 26 May 2018. Retrieved 25 May 2018.
- "Tropical Cyclone Mekunu Making Historic Category 3 Landfall Near Salalah, Oman With Life-Threatening Flooding, Destructive Winds, Storm Surge". The Weather Channel. Retrieved 25 May 2018.
- "Yemen: Cyclone Mekunu - Information bulletin No.2". ReliefWeb. International Federation of Red Cross And Red Crescent Societies. Retrieved 1 June 2018.
- Gambrell, Jon. "Cyclone death toll in Oman, Yemen rises to at least 13". WHEC News. The Associated Press. Archived from the original on 28 May 2018. Retrieved 28 May 2018.
- "OMR108 million insurance claims from Mekunu loss". Times of Oman. 7 August 2018. Retrieved 8 November 2018.
- "OMR to USD Rates on 5/25/2018". Exchange Rates. Retrieved 5 July 2018.
- "Red alert cyclone warning issued for Rakhine state, Myanmar - Xinhua - English.news.cn".
- "Forecasters warn of flash floods, landslides, storm surges".
- "Cattogram city sees severe waterlogging with rains". United News of Bangladesh. 2018-06-11. Retrieved 2018-09-10.
- "58 Killed As Rain Wreaks Havoc In Uttar Pradesh".
- "UP: Sixty nine killed in rain-related incidents in four days - Times of India ►".
- Ians (29 July 2018). "Over 1000 families evacuated as Yamuna continues flowing above danger mark". The Hindu – via www.thehindu.com.
- http://www.rsmcnewdelhi.imd.gov.in/index.php?option=com_content&view=article&id=198&Itemid=540&lang=en
- Global Emergency Overview Weekly Picks, 16 October 2018. Assessment Capacities Project (Report). October 16, 2018. ReliefWeb. Retrieved October 22, 2018.
- Yemen: Cyclone Luban Flash Update #3 (21 October 2018) (PDF). United Nations Office for the Coordination of Humanitarian Affairs (Report). October 21, 2018. ReliefWeb. Retrieved October 22, 2018.
- "Yemen says 14 killed in Cyclone Luban". Associated Press. October 28, 2018. Retrieved October 30, 2018.
- "Govt. Report: Luban Storm cost US$ one billion". Debriefer. November 2, 2018. Retrieved November 8, 2018.
- "Titli toll 77; missing cases under lens". Orissa Post. October 24, 2018. Retrieved October 25, 2018.
- Stela Dey (October 11, 2018). "Cyclone Titli Live Highlights: 8 Dead In Andhra Pradesh, Bus Services Suspended". NDTV. Retrieved October 15, 2018.
- https://odishatv.in/odisha/cyclone-titli-death-toll-rises-to-61-in-odisha-328352
- "Chandrababu Naidu urges fast release of aid to rehabilitate Titli victims". ANI. October 26, 2018. Retrieved October 27, 2018.
- V Kamalakara Rao (October 24, 2018). "Support dries up for Srikakulam, Odisha after charity blitz in Kerala". Times of India. Retrieved October 25, 2018.
- Dennis S. Jesudasan (December 11, 2018). "Cyclone death toll revised from 63 to 52". The Hindu. Retrieved December 11, 2018.
- "Global Catastrophe Recap November 2018" (PDF). December 6, 2018. Retrieved December 7, 2018.
- Cyclone Phethai: 8 Died After Storm Makes Landfall, NDRF Team On Rescue & Road Clearance (video). Kanak News. December 17, 2018. Retrieved December 18, 2018.
- MN Samdani (December 19, 2018). "Crop loss worth Rs 243 crore reported due to cyclone Phethai: Andhra minister". Times of India. Retrieved December 20, 2018.
- MN Samdani (December 18, 2018). "Cyclone Phethai causes Rs 51-crore crop loss in Godavari, Krishna deltas". The New Indian Express. Retrieved December 19, 2018.
- Humanitarian Bulletin Somalia, 1 May - 3 June 2018 (PDF). United Nations Office for the Coordination of Humanitarian Affairs (Report). June 3, 2018. ReliefWeb. Retrieved June 3, 2018.
- World Vision East Africa Hunger Crisis Situation Report: Ethiopia (PDF). World Vision (Report). June 19, 2018. ReliefWeb. Retrieved July 3, 2018.
- UNICEF Djibouti Humanitarian Situation Report, June 2018. United Nations Children Fund (Report). June 30, 2018. ReliefWeb. Retrieved August 7, 2018.
- "Global Catastrophe Recap June 2018" (PDF). Retrieved July 15, 2018.
- "5 killed, 1,400 houses destroyed by cyclone in Myanmar". Xinhua.net. Retrieved 31 May 2018.
- "Global Catastrophe Recap October 2018" (PDF). Retrieved November 21, 2018.
External links
| Wikimedia Commons has media related to 2018 North Indian Ocean cyclone season. |