2018 North Carolina Senate election
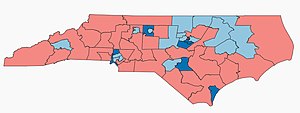
The 2018 North Carolina Senate elections elected 50 members to serve in the North Carolina Senate for a two-year term starting in January 2019. The Democratic Party gained 6 seats in this election, ending the Republican supermajority that they had held since 2011 in the State Senate.[1][2]
| ||||||||||||||||||||||||||||
All 50 seats in the North Carolina State Senate | ||||||||||||||||||||||||||||
|---|---|---|---|---|---|---|---|---|---|---|---|---|---|---|---|---|---|---|---|---|---|---|---|---|---|---|---|---|
| ||||||||||||||||||||||||||||
 Results: Democratic hold Democratic gain Republican hold | ||||||||||||||||||||||||||||
| ||||||||||||||||||||||||||||
| Elections in North Carolina | ||||||||||||||
|---|---|---|---|---|---|---|---|---|---|---|---|---|---|---|
 | ||||||||||||||
|
||||||||||||||
|
State executive
|
||||||||||||||
|
State legislature |
||||||||||||||
|
Mayoral elections
|
||||||||||||||
52.98% of registered voters cast ballots in this election, marking the highest turnout for a midterm election in North Carolina since 1990.[3][4]
Results summary
| Party | Candi- dates | Votes | Seats | ||||
|---|---|---|---|---|---|---|---|
| No. | % | No. | +/– | % | |||
| Republican Party | 50 | 1,816,854 | 48.995% | 29 | 58% | ||
| Democratic Party | 50 | 1,856,838 | 50.074% | 21 | 42% | ||
| Libertarian Party | 14 | 33,219 | 0.896% | 0 | 0% | ||
| Constitution Party | 1 | 1,301 | 0.035% | 0 | 0% | ||
| Total | 32 | 3,708,212 | 100.00% | 50 | 100.00% | ||
Results
District 01
| Party | Candidate | Votes | % | |
|---|---|---|---|---|
| Republican | Bob Steinburg | 39,815 | 53.21% | |
| Democratic | D. Cole Phelps | 35,017 | 46.79% | |
| Total votes | 74,832 | 100.00% | ||
| Republican hold | ||||
District 02
| Party | Candidate | Votes | % | |
|---|---|---|---|---|
| Republican | Norman Sanderson (incumbent) | 42,898 | 61.78% | |
| Democratic | Ginger Garner | 24,644 | 35.49% | |
| Libertarian | Tim Harris | 1,894 | 2.73% | |
| Total votes | 69,436 | 100.00% | ||
| Republican hold | ||||
District 03
| Party | Candidate | Votes | % | |
|---|---|---|---|---|
| Democratic | Erica D. Smith (incumbent) | 33,942 | 53.86% | |
| Republican | C. (Chuck) Earley, Jr. | 29,082 | 46.14% | |
| Total votes | 63,024 | 100.00% | ||
| Democratic hold | ||||
District 04
| Party | Candidate | Votes | % | |
|---|---|---|---|---|
| Democratic | Milton F. (Toby) Fitch, Jr. (incumbent) | 36,471 | 57.77% | |
| Republican | Richard Scott | 25,391 | 40.22% | |
| Libertarian | Jesse Shearin | 1,264 | 2.00% | |
| Total votes | 63,126 | 100.00% | ||
| Democratic hold | ||||
District 05
| Party | Candidate | Votes | % | |
|---|---|---|---|---|
| Democratic | Don Davis (incumbent) | 36,321 | 55.34% | |
| Republican | Kimberly Robb | 29,317 | 44.66% | |
| Total votes | 65,638 | 100.00% | ||
| Democratic hold | ||||
District 06
District 6 had the lowest number of votes cast in any district election in 2018.
| Party | Candidate | Votes | % | |
|---|---|---|---|---|
| Republican | Harry Brown (incumbent) | 27,228 | 65.07% | |
| Democratic | Joseph (Joe) Webb | 14,615 | 34.93% | |
| Total votes | 41,843 | 100.00% | ||
| Republican hold | ||||
District 07
| Party | Candidate | Votes | % | |
|---|---|---|---|---|
| Republican | Louis Milford Pate, Jr. (incumbent) | 30,329 | 53.90% | |
| Democratic | David B. Brantley | 25,940 | 46.10% | |
| Total votes | 56,269 | 100.00% | ||
| Republican hold | ||||
District 08
| Party | Candidate | Votes | % | |
|---|---|---|---|---|
| Republican | Bill Rabon (incumbent) | 55,024 | 58.55% | |
| Democratic | David W. Sink, Jr. | 36,191 | 38.51% | |
| Libertarian | Anthony H. Mascolo | 2,764 | 2.94% | |
| Total votes | 93,979 | 100.00% | ||
| Republican hold | ||||
District 09
| Party | Candidate | Votes | % | |||
|---|---|---|---|---|---|---|
| Democratic | Harper Peterson | 42,257 | 48.60% | |||
| Republican | Michael Lee (incumbent) | 42,026 | 48.33% | |||
| Libertarian | Ethan Bickley | 2,671 | 3.07% | |||
| Total votes | 86,954 | 100.00% | ||||
| Democratic gain from Republican | ||||||
District 10
| Party | Candidate | Votes | % | |
|---|---|---|---|---|
| Republican | Brent Jackson (incumbent) | 33,366 | 62.46% | |
| Democratic | Vernon R. Moore | 20,057 | 37.54% | |
| Total votes | 53,423 | 100.00% | ||
| Republican hold | ||||
District 11
| Party | Candidate | Votes | % | |
|---|---|---|---|---|
| Republican | Rick Horner (incumbent) | 45,768 | 56.49% | |
| Democratic | Albert R. Pacer | 35,258 | 43.51% | |
| Total votes | 81,026 | 100.00% | ||
| Republican hold | ||||
District 12
| Party | Candidate | Votes | % | |
|---|---|---|---|---|
| Republican | Jim Burgin | 34,931 | 60.00% | |
| Democratic | Jean Sivoli | 23,290 | 40.00% | |
| Total votes | 58,221 | 100.00% | ||
| Republican hold | ||||
District 13
| Party | Candidate | Votes | % | |
|---|---|---|---|---|
| Republican | Danny Earl Britt, Jr. (incumbent) | 31,106 | 62.50% | |
| Democratic | John Campbell | 18,661 | 37.50% | |
| Total votes | 49,767 | 100.00% | ||
| Republican hold | ||||
District 14
| Party | Candidate | Votes | % | |
|---|---|---|---|---|
| Democratic | Dan Blue (incumbent) | 55,035 | 71.36% | |
| Republican | Sandy Andrews | 19,951 | 25.87% | |
| Libertarian | Richard Haygood | 2,138 | 2.77% | |
| Total votes | 77,124 | 100.00% | ||
| Democratic hold | ||||
District 15
Incumbent Republican John Alexander sought re-election in the 18th district. Jay Chaudhuri, who has represented the 16th district since 2016, successfully sought re-election here. Brian Lewis won the highest percentage vote of any Libertarian State Senate candidate in 2018. with 3.61%.
| Party | Candidate | Votes | % | |
|---|---|---|---|---|
| Democratic | Jay J. Chaudhuri (incumbent) | 60,805 | 73.10% | |
| Republican | Alan David Michael | 19,365 | 23.28% | |
| Libertarian | Brian Lewis | 3,005 | 3.61% | |
| Total votes | 83,175 | 100.00% | ||
| Democratic hold | ||||
District 16
Incumbent Democrat Jay Chaudhuri sought re-election in the 15th district, making this an open seat. Brian Irving won the highest number of votes of any Libertarian State Senate candidate in 2018 with 3,382 votes.
| Party | Candidate | Votes | % | ||
|---|---|---|---|---|---|
| Democratic | Wiley Nickel | 63,335 | 65.28% | ||
| Republican | Paul Smith | 30,308 | 31.24% | ||
| Libertarian | Brian Irving | 3,382 | 3.49% | ||
| Total votes | 97,025 | 100.00% | |||
| Democratic win (new seat) | |||||
District 17
| Party | Candidate | Votes | % | |||
|---|---|---|---|---|---|---|
| Democratic | Sam Searcy | 50,040 | 50.60% | |||
| Republican | Tamara Barringer (incumbent) | 45,841 | 46.35% | |||
| Libertarian | Bruce Basson | 3,016 | 3.05% | |||
| Total votes | 98,897 | 100.00% | ||||
| Democratic gain from Republican | ||||||
District 18
Incumbent Republican Chad Barefoot retired. Republican John Alexander who was redistricted from the 15th district successfully sought re-election here. The election in district 18 had the highest number of votes cast of any district election in the 2018 elections.
| Party | Candidate | Votes | % | |
|---|---|---|---|---|
| Republican | John Alexander (incumbent) | 51,794 | 49.90% | |
| Democratic | Mack Paul | 49,155 | 47.35% | |
| Libertarian | Brad Hessel | 2,855 | 2.75% | |
| Total votes | 103,804 | 100.00% | ||
| Republican hold | ||||
District 19
| Party | Candidate | Votes | % | |||
|---|---|---|---|---|---|---|
| Democratic | Kirk DeViere | 29,815 | 50.37% | |||
| Republican | Wesley Meredith (incumbent) | 29,382 | 49.63% | |||
| Total votes | 59,197 | 100.00% | ||||
| Democratic gain from Republican | ||||||
District 20
| Party | Candidate | Votes | % | |
|---|---|---|---|---|
| Democratic | Floyd B. McKissick, Jr. (incumbent) | 74,205 | 83.52% | |
| Republican | Tom Stark | 12,309 | 13.85% | |
| Libertarian | Jared Erickson | 2,331 | 2.62% | |
| Total votes | 88,845 | 100.00% | ||
| Democratic hold | ||||
District 21
| Party | Candidate | Votes | % | |
|---|---|---|---|---|
| Democratic | Ben Clark (incumbent) | 33,238 | 70.94% | |
| Republican | Timothy Leever | 13,616 | 29.06% | |
| Total votes | 46,854 | 100.00% | ||
| Democratic hold | ||||
District 22
| Party | Candidate | Votes | % | |
|---|---|---|---|---|
| Democratic | Mike Woodard (incumbent) | 46,153 | 61.81% | |
| Republican | Rickey (Rick) Padgett | 26,989 | 36.14% | |
| Libertarian | Ray Ubinger | 1,527 | 2.05% | |
| Total votes | 74,669 | 100.00% | ||
| Democratic hold | ||||
District 23
| Party | Candidate | Votes | % | |
|---|---|---|---|---|
| Democratic | Valerie P. Foushee (incumbent) | 73,332 | 71.29% | |
| Republican | Tom Glendinning | 29,530 | 28.71% | |
| Total votes | 102,862 | 100.00% | ||
| Democratic hold | ||||
District 24
| Party | Candidate | Votes | % | |
|---|---|---|---|---|
| Republican | Rick Gunn (incumbent) | 42,324 | 53.86% | |
| Democratic | J. D. Wooten | 36,255 | 46.14% | |
| Total votes | 78,579 | 100.00% | ||
| Republican hold | ||||
District 25
| Party | Candidate | Votes | % | |
|---|---|---|---|---|
| Republican | Tom McInnis (incumbent) | 41,601 | 57.09% | |
| Democratic | Helen Probst Mills | 31,268 | 42.91% | |
| Total votes | 72,869 | 100.00% | ||
| Republican hold | ||||
District 26
incumbent Republican Phil Berger, who has represented the 26th district since 2003, sought re-election in the 30th district. Republican Jerry Tillman, who has represented the 29th district since 2003, successfully sought re-election here.
| Party | Candidate | Votes | % | |
|---|---|---|---|---|
| Republican | Jerry W. Tillman (incumbent) | 39,103 | 64.83% | |
| Democratic | William (Bill) McCaskill | 21,217 | 35.17% | |
| Total votes | 60,320 | 100.00% | ||
| Republican hold | ||||
District 27
| Party | Candidate | Votes | % | |||
|---|---|---|---|---|---|---|
| Democratic | Michael Garrett | 45,205 | 50.52% | |||
| Republican | Trudy Wade (incumbent) | 44,268 | 49.48% | |||
| Total votes | 89,473 | 100.00% | ||||
| Democratic gain from Republican | ||||||
District 28
This district had the largest margin of any district election in 2018.
| Party | Candidate | Votes | % | |
|---|---|---|---|---|
| Democratic | Gladys Robinson (incumbent) | 56,262 | 75.25% | |
| Republican | Clark Porter | 18,509 | 24.75% | |
| Total votes | 74,771 | 100.00% | ||
| Democratic hold | ||||
District 29
| Party | Candidate | Votes | % | |
|---|---|---|---|---|
| Republican | Eddie Gallimore | 46,974 | 71.64% | |
| Democratic | Cheraton Love | 18,594 | 28.36% | |
| Total votes | 65,568 | 100.00% | ||
| Republican hold | ||||
District 30
| Party | Candidate | Votes | % | |
|---|---|---|---|---|
| Republican | Philip E. (Phil) Berger | 43,132 | 62.63% | |
| Democratic | Jen Mangrum | 23,558 | 34.21% | |
| Libertarian | R. Michael Jordan | 2,182 | 3.17% | |
| Total votes | 68,872 | 100.00% | ||
| Republican hold | ||||
District 31
| Party | Candidate | Votes | % | |
|---|---|---|---|---|
| Republican | Joyce Krawiec (incumbent) | 54,267 | 61.00% | |
| Democratic | John Motsinger, Jr. | 34,693 | 39.00% | |
| Total votes | 88,960 | 100.00% | ||
| Republican hold | ||||
District 32
| Party | Candidate | Votes | % | |
|---|---|---|---|---|
| Democratic | Paul Lowe, Jr. (incumbent) | 47,221 | 72.88% | |
| Republican | Eric Henderson | 17,572 | 27.12% | |
| Total votes | 64,793 | 100.00% | ||
| Democratic hold | ||||
District 33
| Party | Candidate | Votes | % | |
|---|---|---|---|---|
| Republican | Carl Ford | 47,473 | 68.18% | |
| Democratic | Arin Wilhelm | 22,154 | 31.82% | |
| Total votes | 69,627 | 100.00% | ||
| Republican hold | ||||
District 34
| Party | Candidate | Votes | % | |
|---|---|---|---|---|
| Republican | Vickie Sawyer | 54,635 | 69.73% | |
| Democratic | Beniah McMiller | 23,716 | 30.27% | |
| Total votes | 78,351 | 100.00% | ||
| Republican hold | ||||
District 35
| Party | Candidate | Votes | % | |
|---|---|---|---|---|
| Republican | Todd Johnson | 49,848 | 61.51% | |
| Democratic | Caroline L. Walker | 31,188 | 38.49% | |
| Total votes | 81,036 | 100.00% | ||
| Republican hold | ||||
District 36
| Party | Candidate | Votes | % | |
|---|---|---|---|---|
| Republican | Paul R. Newton (incumbent) | 44,938 | 56.63% | |
| Democratic | Mark E. Shelley | 34,416 | 43.37% | |
| Total votes | 79,354 | 100.00% | ||
| Republican hold | ||||
District 37
| Party | Candidate | Votes | % | |
|---|---|---|---|---|
| Democratic | Jeff Jackson (incumbent) | 52,261 | 78.05% | |
| Republican | Nora Trotman | 13,395 | 20.01% | |
| Constitution | Stuart Andrew Collins | 1,301 | 1.94% | |
| Total votes | 66,957 | 100.00% | ||
| Democratic hold | ||||
District 38
| Party | Candidate | Votes | % | |
|---|---|---|---|---|
| Democratic | Mujtaba A. Mohammed | 53,563 | 81.73% | |
| Republican | Richard Rivette | 11,972 | 18.27% | |
| Total votes | 65,535 | 100.00% | ||
| Democratic hold | ||||
District 39
| Party | Candidate | Votes | % | |
|---|---|---|---|---|
| Republican | Dan Bishop (incumbent) | 49,698 | 52.89% | |
| Democratic | Chad Stachowicz | 44,273 | 47.11% | |
| Total votes | 93,971 | 100.00% | ||
| Republican hold | ||||
District 40
| Party | Candidate | Votes | % | |
|---|---|---|---|---|
| Democratic | Joyce Waddell (incumbent) | 44,773 | 75.63% | |
| Republican | Mr. Bobbie Shields | 14,426 | 24.37% | |
| Total votes | 59,199 | 100.00% | ||
| Democratic hold | ||||
District 41
| Party | Candidate | Votes | % | |||
|---|---|---|---|---|---|---|
| Democratic | Natasha Marcus | 49,459 | 56.85% | |||
| Republican | Jeff Tarte (incumbent) | 37,536 | 43.15% | |||
| Total votes | 86,995 | 100.00% | ||||
| Democratic gain from Republican | ||||||
District 42
| Party | Candidate | Votes | % | |
|---|---|---|---|---|
| Republican | Andy Wells (incumbent) | 44,323 | 66.31% | |
| Democratic | Ric Vandett | 22,522 | 33.69% | |
| Total votes | 66,845 | 100.00% | ||
| Republican hold | ||||
District 43
| Party | Candidate | Votes | % | |
|---|---|---|---|---|
| Republican | Kathy Harrington (incumbent) | 42,906 | 63.39% | |
| Democratic | Altriese Price | 22,881 | 33.80% | |
| Libertarian | Mitchell D. Bridges | 1,900 | 2.81% | |
| Total votes | 67,687 | 100.00% | ||
| Republican hold | ||||
District 44
| Party | Candidate | Votes | % | |
|---|---|---|---|---|
| Republican | Ted Alexander | 46,861 | 68.85% | |
| Democratic | David Lee Lattimore | 21,204 | 31.15% | |
| Total votes | 68,065 | 100.00% | ||
| Republican hold | ||||
District 45
| Party | Candidate | Votes | % | |
|---|---|---|---|---|
| Republican | Deanna Ballard (incumbent) | 48,998 | 65.08% | |
| Democratic | Wes Luther | 26,293 | 34.92% | |
| Total votes | 75,291 | 100.00% | ||
| Republican hold | ||||
District 46
| Party | Candidate | Votes | % | |
|---|---|---|---|---|
| Republican | Warren Daniel (incumbent) | 42,445 | 69.97% | |
| Democratic | Art Sherwood | 18,218 | 30.03% | |
| Total votes | 60,663 | 100.00% | ||
| Republican hold | ||||
District 47
| Party | Candidate | Votes | % | |
|---|---|---|---|---|
| Republican | Ralph Hise (incumbent) | 44,305 | 62.33% | |
| Democratic | David Wheeler | 26,777 | 37.67% | |
| Total votes | 71,082 | 100.00% | ||
| Republican hold | ||||
District 48
| Party | Candidate | Votes | % | |
|---|---|---|---|---|
| Republican | Chuck Edwards (incumbent) | 49,073 | 56.26% | |
| Democratic | Norm Bossert | 38,147 | 43.74% | |
| Total votes | 87,220 | 100.00% | ||
| Republican hold | ||||
District 49
| Party | Candidate | Votes | % | |
|---|---|---|---|---|
| Democratic | Terry Van Duyn (incumbent) | 61,092 | 63.70% | |
| Republican | Mark Crawford | 32,519 | 33.91% | |
| Libertarian | Lyndon John Smith | 2,290 | 2.39% | |
| Total votes | 95,901 | 100.00% | ||
| Democratic hold | ||||
District 50
| Party | Candidate | Votes | % | |
|---|---|---|---|---|
| Republican | Jim Davis (incumbent) | 48,387 | 60.30% | |
| Democratic | Bobby Kuppers | 31,851 | 39.70% | |
| Total votes | 80,238 | 100.00% | ||
| Republican hold | ||||
References
- Bonner, Lynn. "With no recount in close race, Democrats break supermajority in NC Senate". The News & Observer. Retrieved 24 June 2020.
- Larson, David (26 December 2018). "Eight years of Republican supermajority brought major changes to NC". The North State Journal. Retrieved 24 June 2020.
- NC SBE Contest Results. North Carolina Board of Elections https://er.ncsbe.gov/?election_dt=11/06/2018&county_id=0&office=NCS&contest=0. Retrieved 24 June 2020. Missing or empty
|title=(help) - Tiberii, Jeff. "Republicans Lose Supermajorities In North Carolina General Assembly". www.wunc.org. Retrieved 24 June 2020.

