2004 Sligo County Council election
An election to Sligo County Council took place on 11 June 2004 as part of that year's Irish local elections. 25 councillors were elected from five electoral divisions by PR-STV voting for a five-year term of office.
| |||||||||||||||||||||||||||||||||
All 25 seats to Sligo County Council | |||||||||||||||||||||||||||||||||
|---|---|---|---|---|---|---|---|---|---|---|---|---|---|---|---|---|---|---|---|---|---|---|---|---|---|---|---|---|---|---|---|---|---|
| |||||||||||||||||||||||||||||||||
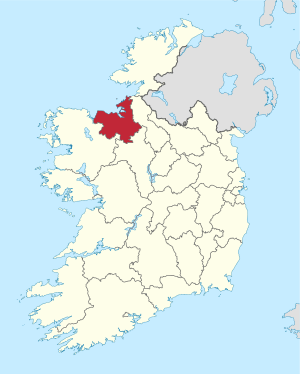 Map showing the area of Sligo County Council | |||||||||||||||||||||||||||||||||
| |||||||||||||||||||||||||||||||||
Results by party
| Party | Seats | ± | First Pref. votes | FPv% | ±% | |
|---|---|---|---|---|---|---|
| Fianna Fáil | 10 | +1 | 12,331 | 37.42% | ||
| Fine Gael | 10 | -1 | 12,115 | 36.76% | ||
| Labour Party | 3 | +1 | 3,434 | 10.42% | ||
| Sinn Féin | 1 | - | 2,546 | 7.73% | ||
| Independent | 1 | -1 | 2,529 | 7.67% | ||
| Totals | 25 | - | 32,955 | 100% | — | |
Results by Electoral Area
Ballymote
| Ballymote - 5 seats | ||||||||||||
|---|---|---|---|---|---|---|---|---|---|---|---|---|
| Party | Candidate | FPv% | Count 1 | Count 2 | Count 3 | Count 4 | Count 5 | Count 6 | Count 7 | Count 8 | ||
| Fianna Fáil | Martin Baker | 19.92 | 1,435 | |||||||||
| Fine Gael | Gerard Mullaney | 12.58 | 906 | 977 | 987 | 1,014 | 1,074 | 1,264 | ||||
| Fine Gael | Gerry Murray* | 11.38 | 820 | 828 | 831 | 843 | 891 | 946 | 963 | 1,085 | ||
| Fianna Fáil | John Sherlock | 10.79 | 777 | 802 | 863 | 948 | 998 | 1,116 | 1,124 | 1,269 | ||
| Fianna Fáil | Joe Shannon* | 9.49 | 684 | 726 | 729 | 749 | 798 | 820 | 823 | 908 | ||
| Fine Gael | Pat McGrath | 8.36 | 602 | 611 | 616 | 640 | 775 | 831 | 847 | 1,042 | ||
| Fine Gael | Thomas Walsh | 7.77 | 560 | 593 | 602 | 628 | 654 | |||||
| Independent | Alfie Parke* | 6.68 | 481 | 507 | 519 | 575 | 666 | 776 | 795 | |||
| Labour Party | Tim Mulcahy | 6.51 | 469 | 474 | 501 | 556 | ||||||
| Sinn Féin | Joe Gilmartin | 4.58 | 330 | 343 | 349 | |||||||
| Independent | Michael Scanlon | 1.94 | 140 | 142 | ||||||||
| Electorate: 10,169 Valid: 7,204 (70.84%) Spoilt: 76 Quota: 1,201 Turnout: 7,280 (71.59%) | ||||||||||||
Dromore
| Dromore - 3 seats | |||||||
|---|---|---|---|---|---|---|---|
| Party | Candidate | FPv% | Count 1 | Count 2 | Count 3 | ||
| Fianna Fáil | Joe Queenan* | 30.92 | 1,254 | ||||
| Fine Gael | Mary Barrett* | 26.50 | 1,075 | ||||
| Fine Gael | Paul Conmy* | 20.22 | 820 | 927 | 1,036 | ||
| Sinn Féin | Padraig Hallinan | 13.04 | 529 | 584 | 758 | ||
| Fianna Fáil | Gerry O'Connor | 9.32 | 378 | 455 | |||
| Electorate: 5,793 Valid: 4,056 (70.02%) Spoilt: 48 Quota: 1,015 Turnout: 4,104 (70.84%) | |||||||
Sligo Drumcliff
| Sligo Drumcliff - 6 seats | |||||||||||||
|---|---|---|---|---|---|---|---|---|---|---|---|---|---|
| Party | Candidate | FPv% | Count 1 | Count 2 | Count 3 | Count 4 | Count 5 | Count 6 | Count 7 | Count 8 | Count 9 | ||
| Fine Gael | Joe Leonard* | 18.38 | 1,411 | ||||||||||
| Fianna Fáil | Jude Devins | 15.08 | 1,158 | ||||||||||
| Fianna Fáil | Patsy Barry* | 13.55 | 1,040 | 1,157 | |||||||||
| Labour Party | Veronica Cawley | 10.59 | 813 | 839 | 919 | 930 | 938 | 994 | 1,056 | 1,236 | |||
| Fine Gael | Ita Fox* | 8.32 | 639 | 699 | 720 | 727 | 740 | 855 | 946 | 1,011 | 1,045 | ||
| Fine Gael | John Peyton | 7.45 | 572 | 630 | 639 | 646 | 654 | 690 | 745 | 794 | 809 | ||
| Sinn Féin | Des Skeffington | 7.13 | 547 | 571 | 599 | 603 | 613 | 637 | 678 | ||||
| Fianna Fáil | Seamus Kilgannon* | 6.71 | 515 | 521 | 525 | 537 | 540 | 598 | 762 | 828 | 849 | ||
| Fianna Fáil | Pádraig Branley* | 5.18 | 398 | 410 | 418 | 430 | 445 | 536 | |||||
| Fianna Fáil | Brian McHugh | 5.11 | 392 | 399 | 410 | 418 | 421 | ||||||
| Labour Party | Brian Scanlon* | 2.50 | 192 | 196 | |||||||||
| Electorate: 12,221 Valid: 7,677 (62.82%) Spoilt: 127 Quota: 1,097 Turnout: 7,804 (63.86%) | |||||||||||||
Sligo Strandhill
| Sligo Strandhill - 7 seats | ||||||||||||
|---|---|---|---|---|---|---|---|---|---|---|---|---|
| Party | Candidate | FPv% | Count 1 | Count 2 | Count 3 | Count 4 | Count 5 | Count 6 | Count 7 | Count 8 | ||
| Fine Gael | Tony McLoughlin* | 24.12 | 2,054 | |||||||||
| Labour Party | Declan Bree* | 13.47 | 1,147 | |||||||||
| Sinn Féin | Seán MacManus* | 13.39 | 1,140 | |||||||||
| Labour Party | Jim McGarry* | 9.55 | 813 | 940 | 973 | 1,004 | 1,028 | 1,067 | ||||
| Fianna Fáil | Deirdre Healy-McGowan | 9.03 | 769 | 915 | 922 | 930 | 939 | 981 | 1,010 | 1,217 | ||
| Fianna Fáil | Albert Higgins* | 8.32 | 708 | 835 | 840 | 846 | 853 | 883 | 890 | 967 | ||
| Fine Gael | Imelda Henry | 8.08 | 688 | 966 | 977 | 1,008 | 1,016 | 1,176 | ||||
| Fianna Fáil | Roddy McGuinn* | 5.79 | 493 | 567 | 578 | 587 | 598 | 607 | 622 | 681 | ||
| Fianna Fáil | Francis Cadden | 4.42 | 376 | 440 | 447 | 456 | 468 | 498 | 513 | |||
| Fine Gael | Jarlath Hunt | 2.44 | 208 | 360 | 364 | 375 | 379 | |||||
| Independent | Jim O'Sullivan | 1.39 | 118 | 139 | 143 | |||||||
| Electorate: 13,445 Valid: 8,514 (63.32%) Spoilt: 189 Quota: 1,065 Turnout: 8,703 (64.73%) | ||||||||||||
Tobercurry
| Tobercurry - 4 seats | |||||||||
|---|---|---|---|---|---|---|---|---|---|
| Party | Candidate | FPv% | Count 1 | Count 2 | Count 3 | Count 4 | Count 5 | ||
| Independent | Margaret Gormley* | 32.56 | 1,790 | ||||||
| Fianna Fáil | Aidan Colleary* | 16.68 | 917 | 984 | 1,116 | ||||
| Fine Gael | Michael Fleming* | 14.08 | 742 | 911 | 1,011 | 1,277 | |||
| Fianna Fáil | Jerry Lundy | 10.35 | 659 | 743 | 846 | 971 | 1,030 | ||
| Fine Gael | Brendan Kivlehan | 8.50 | 606 | 730 | 780 | 876 | 994 | ||
| Fine Gael | Joe Cawley* | 8.07 | 412 | 516 | 576 | ||||
| Fianna Fáil | Kieran O'Dowd | 7.56 | 372 | 514 | |||||
| Electorate: 7,418 Valid: 5,498 (74.12%) Spoilt: 76 Quota: 1,100 Turnout: 5,574 (75.14%) | |||||||||
gollark: Anyway! "Consequentialism" basically says "do whatever produces the best eventual outcome (by some metric)", so a consequentialist would probably say "well, 1 people dying is better than 5, so divert the trolley".
gollark: How ethical.
gollark: Do you do so?
gollark: You can throw a switch to make it go onto another track where it will only run over 1 person.
gollark: Basically, a runaway trolley is heading down a track where it will run over 5 people.
External links
| Preceded by 1999 Sligo County Council election |
Sligo County Council elections | Succeeded by 2009 Sligo County Council election |
This article is issued from Wikipedia. The text is licensed under Creative Commons - Attribution - Sharealike. Additional terms may apply for the media files.