2004 Kilkenny County Council election
An election to Kilkenny County Council took place on 11 June 2004 as part of that year's Irish local elections. 26 councillors were elected from five electoral divisions by PR-STV voting for a five-year term of office.
| |||||||||||||||||||||||||||||||||
All 26 seats to Kilkenny County Council | |||||||||||||||||||||||||||||||||
|---|---|---|---|---|---|---|---|---|---|---|---|---|---|---|---|---|---|---|---|---|---|---|---|---|---|---|---|---|---|---|---|---|---|
| |||||||||||||||||||||||||||||||||
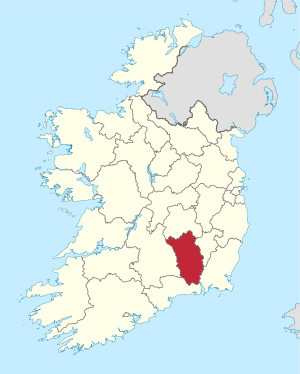 Map showing the area of Kilkenny County Council | |||||||||||||||||||||||||||||||||
| |||||||||||||||||||||||||||||||||
Results by party
| Party | Seats | ± | First Pref. votes | FPv% | ±% | |
|---|---|---|---|---|---|---|
| Fine Gael | 11 | - | 15,029 | 37.64% | ||
| Fianna Fáil | 8 | -4 | 13,690 | 34.28% | ||
| Labour Party | 5 | +4 | 5,950 | 14.90% | ||
| Green Party | 1 | +1 | 1,858 | 4.65% | ||
| Independent | 1 | -1 | 1,609 | 4.03% | ||
| Totals | 26 | - | 39,933 | 100% | — | |
Results by Electoral Area
Ballyragget
| Ballyragget - 5 seats | ||||||||||
|---|---|---|---|---|---|---|---|---|---|---|
| Party | Candidate | FPv% | Count 1 | Count 2 | Count 3 | Count 4 | Count 5 | Count 6 | ||
| Labour Party | Maurice Shortall | 22.57 | 1,789 | |||||||
| Fine Gael | Mary Hilda Cavanagh* | 18.29 | 1,450 | |||||||
| Fine Gael | Catherine Connery* | 18.20 | 1,205 | 753 | 873 | 917 | 953 | 957 | ||
| Fianna Fáil | Pat Millea* | 14.04 | 1,113 | 812 | 945 | 1,359 | ||||
| Fine Gael | Dan Brennan* | 12.14 | 962 | 859 | 876 | 908 | 957 | 962 | ||
| Fianna Fáil | Martin Carroll* | 9.97 | 790 | 756 | 965 | 1,087 | ||||
| Fianna Fáil | Seán Doherty | 7.80 | 618 | 664 | ||||||
| Electorate: 12,093 Valid: 7,927 (65.55%) Spoilt: 162 Quota: 1,322 Turnout: 8,089 (66.89%) | ||||||||||
Callan
| Callan - 3 seats | |||||
|---|---|---|---|---|---|
| Party | Candidate | FPv% | Count 1 | ||
| Fianna Fáil | Matt Doran | 29.12 | 1,468 | ||
| Fine Gael | Tom Maher* | 28.80 | 1,452 | ||
| Fine Gael | Billy Ireland* | 26.04 | 1,313 | ||
| Fianna Fáil | Eamon Walsh | 16.05 | 809 | ||
| Electorate: 8,464 Valid: 5,042 (59.57%) Spoilt: 177 Quota: 1,261 Turnout: 5,219 (61.66%) | |||||
Kilkenny
| Kilkenny - 7 seats | ||||||||||||||||||
|---|---|---|---|---|---|---|---|---|---|---|---|---|---|---|---|---|---|---|
| Party | Candidate | FPv% | Count 1 | Count 2 | Count 3 | Count 4 | Count 5 | Count 6 | Count 7 | Count 8 | Count 9 | Count 10 | Count 11 | Count 12 | Count 13 | Count 14 | ||
| Fianna Fáil | John Coonan* | 11.07 | 1,207 | 1,219 | 1,242 | 1,262 | 1,281 | 1,332 | 1,370 | |||||||||
| Fianna Fáil | Pat Fitzpatrick* | 9.93 | 1,083 | 1,088 | 1,106 | 1,144 | 1,132 | 1,160 | 1,196 | 1,317 | 1,356 | 1,357 | 1,358 | 1,422 | ||||
| Green Party | Malcolm Noonan | 9.85 | 1,074 | 1,099 | 1,142 | 1,183 | 1,287 | 1,372 | ||||||||||
| Fine Gael | Martin Brett* | 7.12 | 776 | 787 | 802 | 857 | 866 | 901 | 929 | 1,005 | 1,116 | 1,167 | 1,168 | 1,354 | 1,374 | |||
| Labour Party | Joe Cody* | 7.08 | 772 | 842 | 877 | 904 | 946 | 995 | 1,205 | 1,275 | 1,330 | 1,333 | 1,336 | 1,426 | ||||
| Progressive Democrats | Coleman Loughnane | 6.56 | 715 | 721 | 757 | 790 | 805 | 839 | 868 | 933 | 977 | 979 | 979 | 1,031 | 1,043 | 1,046 | ||
| Fianna Fáil | Michael Lanigan, Jnr* | 6.27 | 684 | 701 | 719 | 733 | 764 | 786 | 813 | 921 | 962 | 963 | 964 | 1,029 | 1,044 | 1,061 | ||
| Fine Gael | Pat Crotty | 5.94 | 648 | 655 | 665 | 693 | 699 | 725 | 753 | 778 | 901 | 901 | 901 | |||||
| Fine Gael | Paul Cuddihy* | 5.80 | 632 | 650 | 666 | 717 | 724 | 745 | 777 | 795 | 982 | 983 | 984 | 1,277 | 1,293 | 1,310 | ||
| Fine Gael | Paddy Hogan | 5.34 | 582 | 586 | 607 | 660 | 676 | 692 | 719 | 751 | ||||||||
| Fianna Fáil | John Eardly | 4.78 | 521 | 527 | 538 | 546 | 565 | 593 | 605 | |||||||||
| Sinn Féin | Tom Kiernan | 3.76 | 410 | 413 | 426 | 432 | ||||||||||||
| Independent | Teresa Mullen* | 3.67 | 400 | 410 | 442 | 473 | 507 | |||||||||||
| Labour Party | Marie Fitzpatrick | 3.61 | 394 | 448 | 465 | 479 | 508 | 553 | ||||||||||
| Fine Gael | Breda Raggett | 3.54 | 386 | 407 | 416 | |||||||||||||
| Independent | Jimmy Leahy | 3.08 | 336 | 343 | ||||||||||||||
| Labour Party | Tony Patterson | 2.60 | 283 | |||||||||||||||
| Electorate: 19,198 Valid: 10,903 (56.79%) Spoilt: 134 Quota: 1,363 Turnout: 11,086 (57.75%) | ||||||||||||||||||
Piltown
| Piltown - 6 seats | |||||||||||||
|---|---|---|---|---|---|---|---|---|---|---|---|---|---|
| Party | Candidate | FPv% | Count 1 | Count 2 | Count 3 | Count 4 | Count 5 | Count 6 | Count 7 | Count 8 | Count 9 | ||
| Fianna Fáil | Bobby Aylward* | 16.66 | 1,478 | ||||||||||
| Fine Gael | Pat Dunphy* | 12.89 | 1,144 | 1,155 | 1,169 | 1,175 | 1,183 | 1,271 | |||||
| Labour Party | Tomás Breathnach | 12.47 | 1,107 | 1,122 | 1,203 | 1,206 | 1,237 | 1,284 | |||||
| Fine Gael | Dick Dowling* | 11.72 | 1,040 | 1,058 | 1,083 | 1,097 | 1,186 | 1,218 | 1,223 | 1,224 | 1,332 | ||
| Fine Gael | Catherine Phelan-Holden | 8.07 | 716 | 744 | 763 | 874 | 906 | 956 | 959 | 960 | 1,040 | ||
| Fine Gael | John O'Dwyer | 7.72 | 685 | 693 | 721 | 758 | 800 | 806 | 807 | 807 | 858 | ||
| Sinn Féin | Kevin Dunphy | 7.57 | 672 | 680 | 719 | 731 | 751 | 800 | 804 | 804 | |||
| Fianna Fáil | Cora Long* | 5.95 | 528 | 562 | 567 | 615 | 702 | 990 | 993 | 994 | 1,156 | ||
| Fianna Fáil | Ann Blackmore* | 5.34 | 474 | 520 | 533 | 585 | 661 | ||||||
| Fianna Fáil | Margaret Haberlin | 4.45 | 395 | 407 | 429 | 461 | |||||||
| Fianna Fáil | Pat Walsh | 3.81 | 338 | 363 | 371 | ||||||||
| Green Party | John Fitzgerald | 3.35 | 297 | 302 | |||||||||
| Electorate: 14,187 Valid: 8,874 (62.55%) Spoilt: 112 Quota: 1,268 Turnout: 9,099 (64.14%) | |||||||||||||
Thomastown
| Thomastown - 5 seats | |||||||||||
|---|---|---|---|---|---|---|---|---|---|---|---|
| Party | Candidate | FPv% | Count 1 | Count 2 | Count 3 | Count 4 | Count 5 | Count 6 | Count 7 | ||
| Fine Gael | Pat O'Neill | 15.12 | 1,145 | 1,195 | 1,343 | ||||||
| Labour Party | Michael O'Brien | 12.73 | 964 | 1,071 | 1,091 | 1,094 | 1,125 | 1,202 | 1,222 | ||
| Fianna Fáil | Tom Brennan* | 11.98 | 907 | 944 | 991 | 997 | 1,155 | 1,504 | |||
| Independent | Dixie Doyle* | 11.53 | 873 | 913 | 931 | 934 | 981 | 1,140 | 1,214 | ||
| Fine Gael | Andy Cotterell* | 8.85 | 670 | 715 | 855 | 906 | 934 | 1,063 | 1,106 | ||
| Fianna Fáil | Seán Treacy | 8.79 | 666 | 693 | 711 | 714 | 870 | ||||
| Labour Party | Ann Phelan | 8.46 | 641 | 718 | 857 | 867 | 1,061 | 1,115 | 1,138 | ||
| Fianna Fáil | Joan Murphy* | 8.07 | 611 | 636 | 698 | 702 | |||||
| Fine Gael | John Meaney | 8.04 | 609 | 633 | |||||||
| Green Party | Judith Ashton | 6.43 | 487 | ||||||||
| Electorate: 12,083 Valid: 7,573 (62.67%) Spoilt: 162 Quota: 1,263 Turnout: 7,735 (64.02%) | |||||||||||
gollark: And out of preorder.
gollark: I might get the ebook whenever it's available.
gollark: In relative or absolute terms?
gollark: If you're offloading all your complex real-time computing somewhere else, then currently that means you'll probably just burn away the power savings on running your device's 4G radios and have it randomly break when bandwidth drops low enough.
gollark: The nice thing about advancing technology is that it gets more feasible as time goes on.
External links
| Preceded by 1999 Kilkenny County Council election |
Kilkenny County Council elections | Succeeded by 2009 Kilkenny County Council election |
This article is issued from Wikipedia. The text is licensed under Creative Commons - Attribution - Sharealike. Additional terms may apply for the media files.