2004 Limerick County Council election
An election to Limerick County Council took place on 11 June 2004 as part of that year's Irish local elections. 28 councillors were elected from five electoral divisions by PR-STV voting for a five-year term of office.
| |||||||||||||||||||||||||||||||||
All 28 seats to Limerick County Council | |||||||||||||||||||||||||||||||||
|---|---|---|---|---|---|---|---|---|---|---|---|---|---|---|---|---|---|---|---|---|---|---|---|---|---|---|---|---|---|---|---|---|---|
| |||||||||||||||||||||||||||||||||
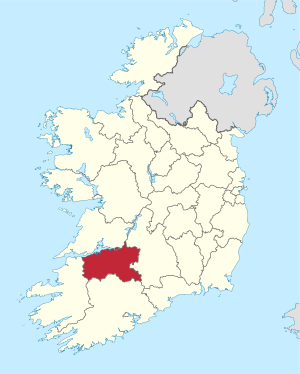 Map showing the area of Limerick County Council | |||||||||||||||||||||||||||||||||
| |||||||||||||||||||||||||||||||||
Results by party
| Party | Seats | ± | First Pref. votes | FPv% | ±% | |
|---|---|---|---|---|---|---|
| Fianna Fáil | 12 | -2 | 23,157 | 39.13% | ||
| Fine Gael | 12 | +2 | 22,841 | 38.60% | ||
| Progressive Democrats | 3 | - | 4,681 | 7.91% | ||
| Labour Party | 1 | +1 | 2,279 | 3.85% | ||
| Independent | 0 | -1 | 4,121 | 6.96% | ||
| Totals | 28 | - | 59,175 | 100% | — | |
Results by Electoral Area
Bruff
| Bruff - 7 seats | ||||||||||||||||
|---|---|---|---|---|---|---|---|---|---|---|---|---|---|---|---|---|
| Party | Candidate | FPv% | Count 1 | Count 2 | Count 3 | Count 4 | Count 5 | Count 6 | Count 7 | Count 8 | Count 9 | Count 10 | Count 11 | Count 12 | ||
| Fine Gael | Richard Butler* | 14.04 | 1,954 | |||||||||||||
| Fianna Fáil | Niall Collins | 11.49 | 1,600 | 1,637 | 1,648 | 1,657 | 1,673 | 1,685 | 1,698 | 1,768 | ||||||
| Fine Gael | Cormac Hurley* | 7.96 | 1,108 | 1,144 | 1,148 | 1,175 | 1,264 | 1,362 | 1,453 | 1,457 | 1,489 | 1,555 | 1,744 | |||
| Fianna Fáil | Leonard Enright* | 7.72 | 1,075 | 1,086 | 1,096 | 1,101 | 1,108 | 1,114 | 1,123 | 1,197 | 1,298 | 1,350 | 1,438 | 1,510 | ||
| Fianna Fáil | John Clifford* | 6.61 | 920 | 922 | 1,004 | 1,009 | 1,011 | 1,017 | 1,023 | 1,086 | 1,169 | 1,207 | 1,222 | 1,454 | ||
| Progressive Democrats | Rose Brennan* | 6.49 | 904 | 911 | 921 | 925 | 929 | 960 | 965 | 1,113 | 1,196 | 1,440 | 1,662 | 1,855 | ||
| Labour Party | Deirdre Ní Chinneide | 6.34 | 883 | 908 | 912 | 938 | 954 | 970 | 1,220 | 1,225 | 1,270 | 1,407 | 1,440 | 1,566 | ||
| Fianna Fáil | Sandra Marsh* | 5.55 | 772 | 778 | 784 | 798 | 828 | 935 | 981 | 999 | 1,025 | 1,100 | 1,131 | 1,174 | ||
| Fine Gael | Gerard Murnane | 4.76 | 663 | 678 | 736 | 747 | 782 | 786 | 792 | 801 | 860 | 899 | 1,070 | |||
| Fine Gael | Tom P. Healy | 4.53 | 631 | 665 | 668 | 675 | 694 | 695 | 704 | 802 | 848 | 866 | ||||
| Progressive Democrats | Sinead Teefy | 4.40 | 613 | 631 | 659 | 671 | 676 | 736 | 762 | 776 | 817 | |||||
| Independent | Patrick Fitzgerald | 3.99 | 556 | 560 | 562 | 623 | 636 | 642 | 658 | 680 | ||||||
| Fianna Fáil | James Cavanagh | 3.99 | 555 | 557 | 559 | 559 | 559 | 562 | 563 | |||||||
| Labour Party | Karan O'Loughlin | 3.08 | 429 | 432 | 437 | 468 | 508 | 545 | ||||||||
| Progressive Democrats | Pat Hennessy* | 2.79 | 388 | 391 | 398 | 413 | 428 | |||||||||
| Fine Gael | Tina O'Gorman | 2.41 | 335 | 342 | 343 | 351 | ||||||||||
| Independent | Denis Riordan | 1.95 | 271 | 274 | 277 | |||||||||||
| Progressive Democrats | George O'Leary | 1.90 | 264 | 264 | ||||||||||||
| Electorate: 23,618 Valid: 13,921 (58.94%) Spoilt: 253 Quota: 1,741 Turnout: 14,174 (60.01%) | ||||||||||||||||
Castleconnell
| Castleconnell - 7 seats | |||||||||||||
|---|---|---|---|---|---|---|---|---|---|---|---|---|---|
| Party | Candidate | FPv% | Count 1 | Count 2 | Count 3 | Count 4 | Count 5 | Count 6 | Count 7 | Count 8 | Count 9 | ||
| Fine Gael | Mary Jackman* | 14.60 | 2,119 | ||||||||||
| Fianna Fáil | Eddie Wade* | 14.35 | 2,083 | ||||||||||
| Progressive Democrats | Brigid Teefy* | 10.25 | 1,487 | 1,516 | 1,599 | 1,606 | 1,648 | 1,675 | 1,715 | 1,829 | |||
| Fianna Fáil | Joe Meagher* | 9.08 | 1,318 | 1,322 | 1,347 | 1,350 | 1,366 | 1,461 | 1,470 | 1,485 | 1,534 | ||
| Fianna Fáil | Noel Gleeson | 8.92 | 1,294 | 1,300 | 1,336 | 1,344 | 1,360 | 1,414 | 1,430 | 1,467 | 1,692 | ||
| Fine Gael | Kieran O'Donnell | 8.01 | 1,163 | 1,259 | 1,274 | 1,289 | 1,316 | 1,329 | 1,390 | 1,528 | 1,776 | ||
| Fianna Fáil | Noreen Ryan* | 8.01 | 1,163 | 1,184 | 1,220 | 1,226 | 1,289 | 1,311 | 1,342 | 1,405 | 1,601 | ||
| Fine Gael | Mary Harty* | 7.43 | 1,079 | 1,128 | 1,143 | 1,156 | 1,163 | 1,253 | 1,293 | 1,419 | 1,732 | ||
| Fine Gael | Paddy Hourigan* | 7.37 | 1,069 | 1,111 | 1,125 | 1,131 | 1,140 | 1,154 | 1,180 | 1,231 | |||
| Green Party | Trish Forde-Brennan | 3.71 | 539 | 564 | 569 | 604 | 619 | 624 | 842 | ||||
| Labour Party | Manus Bree | 3.27 | 474 | 490 | 494 | 522 | 538 | 546 | |||||
| Fianna Fáil | Tim Long | 2.24 | 325 | 328 | 344 | 347 | 360 | ||||||
| Fianna Fáil | Ursula Stokes | 1.62 | 235 | 246 | 262 | 266 | |||||||
| Independent | Seán Gilmour | 1.14 | 166 | 168 | 171 | ||||||||
| Electorate: 25,025 Valid: 14,514 (58.00%) Spoilt: 253 Quota: 1,815 Turnout: 14,767 (59.01%) | |||||||||||||
Kilmallock
| Kilmallock - 4 seats | ||||||||||||
|---|---|---|---|---|---|---|---|---|---|---|---|---|
| Party | Candidate | FPv% | Count 1 | Count 2 | Count 3 | Count 4 | Count 5 | Count 6 | Count 7 | Count 8 | ||
| Fianna Fáil | John Gallahue* | 17.43 | 1,715 | 1,725 | 1,803 | 1,835 | 1,896 | 1,916 | 2,196 | |||
| Fine Gael | Jim Houlihan* | 14.25 | 1,402 | 1,427 | 1,468 | 1,745 | 2,105 | |||||
| Fianna Fáil | Pat McAuliffe* | 13.78 | 1,356 | 1,376 | 1,424 | 1,470 | 1,562 | 1,600 | 1,858 | 1,928 | ||
| Progressive Democrats | Eddie Creighton* | 13.10 | 1,289 | 1,296 | 1,338 | 1,386 | 1,414 | 1,435 | 1,616 | 1,668 | ||
| Fianna Fáil | Eddie Ryan | 12.58 | 1,238 | 1,242 | 1,293 | 1,327 | 1,345 | 1,367 | 1,549 | 1,603 | ||
| Independent | Pat Heffernan | 9.32 | 917 | 950 | 1,073 | 1,146 | 1,266 | 1,301 | ||||
| Independent | Brendan Danaher | 7.17 | 706 | 723 | 753 | 813 | ||||||
| Fine Gael | Thomas Blackburne | 5.73 | 564 | 577 | 604 | |||||||
| Sinn Féin | Noel Hanley | 2.91 | 286 | 303 | ||||||||
| Labour Party | Thomas Rea | 2.03 | 200 | 207 | ||||||||
| Independent | James Coll | 1.71 | 168 | |||||||||
| Electorate: 15,225 Valid: 9,841 (64.64%) Spoilt: 161 Quota: 1,969 Turnout: 10,002 (65.69%) | ||||||||||||
Newcastle West
| Newcastle West - 5 seats | ||||||||||||||
|---|---|---|---|---|---|---|---|---|---|---|---|---|---|---|
| Party | Candidate | FPv% | Count 1 | Count 2 | Count 3 | Count 4 | Count 5 | Count 6 | Count 7 | Count 8 | Count 9 | Count 10 | ||
| Fine Gael | Patrick O'Donovan* | 13.26 | 1,485 | 1,492 | 1,518 | 1,552 | 1,566 | 1,654 | 1,707 | 1,757 | 1,932 | |||
| Fine Gael | Liam Galvin | 11.74 | 1,315 | 1,335 | 1,346 | 1,406 | 1,412 | 1,459 | 1,489 | 1,523 | 1,576 | 1,959 | ||
| Fianna Fáil | Michael J. Collins | 10.72 | 1,200 | 1,212 | 1,233 | 1,251 | 1,284 | 1,390 | 1,460 | 1,610 | 1,762 | 1,818 | ||
| Fianna Fáil | Seamus Ahern* | 10.20 | 1,142 | 1,149 | 1,152 | 1,161 | 1,170 | 1,200 | 1,223 | 1,275 | 1,305 | 1,386 | ||
| Fianna Fáil | Francis Foley | 9.35 | 1,047 | 1,056 | 1,063 | 1,102 | 1,110 | 1,153 | 1,180 | 1,261 | 1,358 | 1,574 | ||
| Fine Gael | Jerome Scanlan | 9.24 | 1,035 | 1,038 | 1,045 | 1,058 | 1,160 | 1,202 | 1,327 | 1,455 | 1,557 | 1,681 | ||
| Fine Gael | Maurice Hartnett | 7.78 | 871 | 890 | 893 | 943 | 963 | 996 | 1,014 | 1,036 | 1,075 | |||
| Independent | Joseph Mullane | 5.19 | 581 | 588 | 602 | 617 | 641 | 720 | 800 | 842 | ||||
| Fianna Fáil | Vincent Kiely | 4.88 | 547 | 548 | 551 | 555 | 606 | 624 | 661 | |||||
| Independent | Marian Collins | 4.47 | 501 | 517 | 527 | 542 | 564 | |||||||
| Independent | John Leahy | 3.78 | 423 | 425 | 427 | 433 | ||||||||
| Sinn Féin | Coireall MacCurtain | 3.66 | 410 | 416 | 497 | 510 | 605 | 623 | ||||||
| Labour Party | Denis Hobson | 2.62 | 293 | 310 | 311 | |||||||||
| Sinn Féin | Mike MacDomhnaill | 1.75 | 196 | 201 | ||||||||||
| Green Party | Eamon Collins | 1.37 | 153 | |||||||||||
| Electorate: 17,522 Valid: 11,199 (63.91%) Spoilt: 182 Quota: 1,867 Turnout: 11,381 (64.95%) | ||||||||||||||
Rathkeale
| Rathkeale- 5 seats | ||||||||
|---|---|---|---|---|---|---|---|---|
| Party | Candidate | FPv% | Count 1 | Count 2 | Count 3 | Count 4 | ||
| Fine Gael | Tom Neville* | 24.71 | 2,599 | |||||
| Fine Gael | David Naughton* | 13.05 | 1,373 | 1,595 | 1,761 | |||
| Fianna Fáil | Kevin Sheahan* | 12.85 | 1,352 | 1,434 | 1,525 | 1,824 | ||
| Fianna Fáil | John Griffin* | 10.80 | 1,136 | 1,208 | 1,283 | 1,527 | ||
| Fianna Fáil | John Cregan* | 10.30 | 1,084 | 1,131 | 1,252 | |||
| Fine Gael | John Sheahan | 10.26 | 1,079 | 1,205 | 1,381 | 1,789 | ||
| Fine Gael | Stephen Keary | 9.48 | 997 | 1,210 | 1,346 | 1,408 | ||
| Green Party | Pat Culhane | 4.87 | 512 | 576 | ||||
| Independent | Paudie Mulvihil | 3.69 | 388 | 407 | ||||
| Electorate: 16,697 Valid: 10,520 (63.01%) Spoilt: 174 Quota: 1,754 Turnout: 10,694 (64.05%) | ||||||||
gollark: I mean, he seems terrible. But the other candidates also seem terrible?
gollark: You don't even need that, anyone with an internet connection can just look up the algorithms and some implementations.
gollark: I mean, given that encryption is literally applied maths, you can't possibly stop (O NOES) bad people having access to it, only make it so *normal people* don't have convenient access to good cryptographic stuff and can be spied on easily.
gollark: I'm currently very slowly writing a blog post criticizing governments trying to do stupid things with encryption, but writing is hard.
gollark: You can't magically create a backdoor only accessible by people using it for "good reasons", and I would not trust *anyone at all* with the power to arbitrarily read people's communications.
External links
| Preceded by 1999 Limerick County Council election |
Limerick County Council elections | Succeeded by 2009 Limerick County Council election |
This article is issued from Wikipedia. The text is licensed under Creative Commons - Attribution - Sharealike. Additional terms may apply for the media files.