1998 Barnet London Borough Council election
The 1998 Barnet Council election took place on 7 May 1998 to elect members of Barnet London Borough Council in London, England. The whole council was up for election and the council stayed under no overall control.[1]
| |||||||||||||||||||||||||
All 60 seats to Barnet London Borough Council 31 seats needed for a majority | |||||||||||||||||||||||||
|---|---|---|---|---|---|---|---|---|---|---|---|---|---|---|---|---|---|---|---|---|---|---|---|---|---|
| Turnout | 35.9% | ||||||||||||||||||||||||
| |||||||||||||||||||||||||
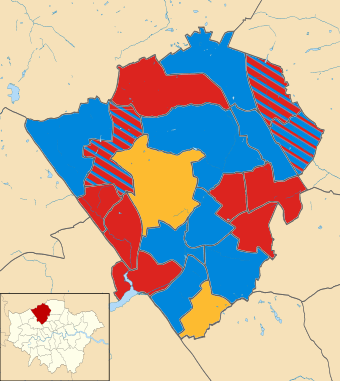 Map of the results of the 1998 Barnet London Borough council election. Conservatives in blue, Labour in red and Liberal Democrats in yellow.. | |||||||||||||||||||||||||
| |||||||||||||||||||||||||
Background
Election result
Overall turnout in the election was 35.9%.
| Party | Seats | Gains | Losses | Net gain/loss | Seats % | Votes % | Votes | +/− | |
|---|---|---|---|---|---|---|---|---|---|
| Conservative | 28 | 1 | 2 | -1 | 46.7 | ||||
| Labour | 26 | 2 | 1 | +1 | 43.3 | ||||
| Liberal Democrats | 6 | 0 | 0 | 0 | 10.0 | ||||
| Green | 0 | 0 | 0 | 0 | 0 | ||||
| Natural Law | 0 | 0 | 0 | 0 | 0 | ||||
Ward results
Arkley
| Party | Candidate | Votes | % | ± | |
|---|---|---|---|---|---|
| Labour | Anita Campbell | 2,288 | |||
| Labour | Pamela Coleman | 2,075 | |||
| Labour | Pauline V. M. Coakley-Webb | 2,072 | |||
| Conservative | Mark Johnson | 1,907 | |||
| Conservative | Andrew W. Knight | 1,795 | |||
| Conservative | Tony Mirza | 1,724 | |||
| Liberal Democrats | Victor F. Godman | 470 | |||
| Liberal Democrats | Nicholas O. Sullivan | 460 | |||
| Liberal Democrats | Michael M. Cole | 441 | |||
| Green | Aniel Paranjpe | 186 | |||
| Turnout | 4,754 | 39.4 | |||
| Labour hold | Swing | ||||
| Labour hold | Swing | ||||
| Labour hold | Swing | ||||
Brunswick Park
| Party | Candidate | Votes | % | ± | |
|---|---|---|---|---|---|
| Labour | Geoffrey N. Cooke | 1,826 | |||
| Conservative | Andreas Tambourides | 1,781 | |||
| Conservative | Lynne Hillan | 1,774 | |||
| Labour | Paul G. Rogers | 1,700 | |||
| Labour | Michael J. P. Marshall | 1,689 | |||
| Conservative | Arik Yacobi | 1,653 | |||
| Liberal Democrats | Peter J. Finlayson | 446 | |||
| Liberal Democrats | Peter D. Watkins | 383 | |||
| Liberal Democrats | Charles E. Wicksteed | 341 | |||
| Turnout | 4,164 | 38.4 | |||
| Labour gain from Conservative | Swing | ||||
| Conservative hold | Swing | ||||
| Conservative hold | Swing | ||||
Burnt Oak
| Party | Candidate | Votes | % | ± | |
|---|---|---|---|---|---|
| Labour | Allan J. Turner | 1,844 | |||
| Labour | Alan J. Williams | 1,830 | |||
| Labour | Linda R. McFadyen | 1,615 | |||
| Conservative | Peter J. P. Edwards | 430 | |||
| Conservative | Urmil K. Bhatt | 317 | |||
| Conservative | Keith F. Dyall | 316 | |||
| Liberal Democrats | Andrew Packer | 289 | |||
| Liberal Democrats | Karen S. Hatchett | 215 | |||
| Liberal Democrats | Henryk P. Feszczur | 159 | |||
| Turnout | 2,649 | 27.4 | |||
| Labour hold | Swing | ||||
| Labour hold | Swing | ||||
| Labour hold | Swing | ||||
Childs Hill
| Party | Candidate | Votes | % | ± | |
|---|---|---|---|---|---|
| Liberal Democrats | Jack B. Cohen | 1,422 | |||
| Liberal Democrats | Monroe E. Palmer | 1,407 | |||
| Liberal Democrats | Susette S. Palmer | 1,380 | |||
| Labour | Lorna Noble | 1,047 | |||
| Labour | Clare Fitzpatrick | 1,015 | |||
| Labour | Keith T. Priddle | 953 | |||
| Conservative | Jonathan Miller | 872 | |||
| Conservative | Peter M. Sugarman | 872 | |||
| Conservative | Marc A. Shaw | 790 | |||
| Turnout | 3,461 | 35.6 | |||
| Liberal Democrats hold | Swing | ||||
| Liberal Democrats hold | Swing | ||||
| Liberal Democrats hold | Swing | ||||
Colindale
| Party | Candidate | Votes | % | ± | |
|---|---|---|---|---|---|
| Labour | Danish Chopra | 1,715 | |||
| Labour | Gillian W. Sargeant | 1,589 | |||
| Labour | Nathaniel D. Rudolf | 1,464 | |||
| Conservative | Robert B. Linton | 485 | |||
| Conservative | Kirit K. Patel | 452 | |||
| Conservative | Yvonne W. Prentice | 437 | |||
| Liberal Democrats | Arthur J. Roycroft | 337 | |||
| Liberal Democrats | Guy J. Patton | 332 | |||
| Liberal Democrats | Michael C. Roberts | 315 | |||
| Green | Ketan K. Majmudar | 159 | |||
| Turnout | 2,799 | 23.1 | |||
| Labour hold | Swing | ||||
| Labour hold | Swing | ||||
| Labour hold | Swing | ||||
East Barnet
| Party | Candidate | Votes | % | ± | |
|---|---|---|---|---|---|
| Labour | Elizabeth A. T. Jarvis | 2,041 | |||
| Labour | Usha K. Chopra | 1,962 | |||
| Conservative | Olwen M. Evans | 1,942 | |||
| Conservative | Zoe Ford | 1,914 | |||
| Labour | Brenda E. A. Sandford | 1,914 | |||
| Conservative | James E. Hawthorn | 1,873 | |||
| Liberal Democrats | David J. Keech | 432 | |||
| Liberal Democrats | Elizabeth R. Wardle | 423 | |||
| Liberal Democrats | Renee L. Wheeler | 351 | |||
| Green | Raymond White | 256 | |||
| Turnout | 4,657 | 40.8 | |||
| Labour hold | Swing | ||||
| Labour hold | Swing | ||||
| Conservative gain from Labour | Swing | ||||
East Finchley
| Party | Candidate | Votes | % | ± | |
|---|---|---|---|---|---|
| Labour | Helen E. Gordon | 2,750 | |||
| Labour | Alison Moore | 2,547 | |||
| Labour | Philip R. Yeoman | 2,529 | |||
| Conservative | Barry P. Neville | 850 | |||
| Conservative | Michael W. Freer | 822 | |||
| Conservative | Graham D. Old | 786 | |||
| Green | Noel T. Lynch | 577 | |||
| Liberal Democrats | Joyce M. Arram | 458 | |||
| Liberal Democrats | Elinor T. Edwards | 358 | |||
| Green | Sally M. Rose | 355 | |||
| Liberal Democrats | Thomas G. Darrer | 334 | |||
| Green | Denis E. Vigay | 237 | |||
| Turnout | 4,542 | 38.8 | |||
| Labour hold | Swing | ||||
| Labour hold | Swing | ||||
| Labour hold | Swing | ||||
Edgware
| Party | Candidate | Votes | % | ± | |
|---|---|---|---|---|---|
| Conservative | Anthony P. Spencer | 1,642 | |||
| Conservative | Malcolm E. Lester | 1,592 | |||
| Conservative | Joan Scannell | 1,532 | |||
| Labour | Maree G. Glass | 1,206 | |||
| Labour | Harold Waterman | 1,148 | |||
| Labour | Alan M. Sloam | 1,120 | |||
| Liberal Democrats | Barbara A. Farbey | 324 | |||
| Liberal Democrats | June D. Burton | 323 | |||
| Liberal Democrats | Diana C. Iwi | 247 | |||
| Green | Jonathan D. Mulberg | 141 | |||
| Turnout | 3,382 | 28.9 | |||
| Conservative hold | Swing | ||||
| Conservative hold | Swing | ||||
| Conservative hold | Swing | ||||
Finchley
| Party | Candidate | Votes | % | ± | |
|---|---|---|---|---|---|
| Conservative | Eva Greenspan | 1,973 | |||
| Conservative | Leslie Sussman | 1,882 | |||
| Conservative | Barbara I. Langstone | 1,829 | |||
| Labour | Clare Furniss | 1,523 | |||
| Labour | Ilan A. Jacobs | 1,441 | |||
| Labour | Mary P. McGuirk | 1,425 | |||
| Liberal Democrats | Malcolm B. Davis | 501 | |||
| Green | Ashley Gunstock | 365 | |||
| Liberal Democrats | Rita D. Druiff | 346 | |||
| Liberal Democrats | Millicent J. Watkins | 332 | |||
| Turnout | 4,105 | 38.8 | |||
| Conservative hold | Swing | ||||
| Conservative hold | Swing | ||||
| Conservative hold | Swing | ||||
Friern Barnet
| Party | Candidate | Votes | % | ± | |
|---|---|---|---|---|---|
| Conservative | James J. Chapman | 2,107 | |||
| Conservative | Brian L. Salinger | 1,966 | |||
| Conservative | John C. Tiplady | 1,924 | |||
| Labour | Ross S. Houston | 1,407 | |||
| Labour | Timothy J. K. Roberts | 1,372 | |||
| Labour | Dilip K. Mitra | 1,310 | |||
| Liberal Democrats | Neil A. McL. Ferguson | 446 | |||
| Liberal Democrats | Tanya G. Jordan | 426 | |||
| Liberal Democrats | Yvonne Wicksteed | 388 | |||
| Green | Miranda J. Dunn | 238 | |||
| Turnout | 4,153 | 37.0 | |||
| Conservative hold | Swing | ||||
| Conservative hold | Swing | ||||
| Conservative hold | Swing | ||||
Garden Suburb
| Party | Candidate | Votes | % | ± | |
|---|---|---|---|---|---|
| Conservative | John L. Marshall | 2,649 | |||
| Conservative | Peter J. Skolar | 2,073 | |||
| Conservative | Yasman Naghar | 2,024 | |||
| Liberal Democrats | Majorie A. Harris | 1,312 | |||
| Liberal Democrats | Steven Hajioff | 1,229 | |||
| Liberal Democrats | Steven J. Deller | 1,068 | |||
| Labour | Carol A. Kohli | 531 | |||
| Labour | Anthony G. J. Hulstrom | 450 | |||
| Labour | Polly A. Napper | 443 | |||
| Green | Louise E. Gunstock | 256 | |||
| Turnout | 4,314 | 42.0 | |||
| Conservative hold | Swing | ||||
| Conservative hold | Swing | ||||
| Conservative hold | Swing | ||||
Golders Green
| Party | Candidate | Votes | % | ± | |
|---|---|---|---|---|---|
| Conservative | Melvin Cohen | 1,946 | |||
| Conservative | Abraham M. Dunner | 1,946 | |||
| Conservative | Christopher G. S. Harris | 1,762 | |||
| Labour | David G. Robinson | 1,617 | |||
| Labour | Alan Schneiderman | 1,579 | |||
| Labour | Matthew G. B. Staples | 1,533 | |||
| Liberal Democrats | Olive V. Ellner | 397 | |||
| Liberal Democrats | Peter A. Lusher | 344 | |||
| Liberal Democrats | Simon V. Kovar | 338 | |||
| Turnout | 4,139 | 38.4 | |||
| Conservative hold | Swing | ||||
| Conservative hold | Swing | ||||
| Conservative hold | Swing | ||||
Hadley
| Party | Candidate | Votes | % | ± | |
|---|---|---|---|---|---|
| Conservative | Katia David | 2,674 | |||
| Conservative | Hazel E. Mammatt | 2,654 | |||
| Conservative | Kantilal S. Patel | 2,456 | |||
| Labour | Michael B. Campbell | 1,984 | |||
| Labour | Marianne Haylett | 1,791 | |||
| Labour | Lawrence E. Williams | 1,746 | |||
| Liberal Democrats | Ronald Marsh | 785 | |||
| Liberal Democrats | David A. Nowell | 725 | |||
| Liberal Democrats | Brigid M. Povah | 594 | |||
| Green | Timothy Riley | 408 | |||
| Turnout | 5,611 | 39.5 | |||
| Conservative hold | Swing | ||||
| Conservative hold | Swing | ||||
| Conservative hold | Swing | ||||
Hale
| Party | Candidate | Votes | % | ± | |
|---|---|---|---|---|---|
| Labour | Steven E. Blomer | 1,523 | |||
| Labour | Ruth J. Nyman | 1,498 | |||
| Conservative | Brian C. Gordon | 1,393 | |||
| Labour | Julian E. Stern | 1,379 | |||
| Conservative | Michael Slipman | 1,253 | |||
| Conservative | Prafulla C. Patel | 1,201 | |||
| Liberal Democrats | James M. Creighton | 658 | |||
| Liberal Democrats | Geoffrey A. Jacobs | 557 | |||
| Liberal Democrats | Jeremy R. Pattison | 532 | |||
| Turnout | 3,655 | 34.8 | |||
| Labour hold | Swing | ||||
| Labour gain from Conservative | Swing | ||||
| Conservative hold | Swing | ||||
Hendon
| Party | Candidate | Votes | % | ± | |
|---|---|---|---|---|---|
| Conservative | Anthony H. Finn | 1,487 | |||
| Conservative | Maureen Braun | 1,349 | |||
| Conservative | Andrew M. Sherling | 1,293 | |||
| Liberal Democrats | Susan J. Palin | 1,226 | |||
| Liberal Democrats | Jonathan M. Davies | 1,164 | |||
| Labour | Aubrey E. Ross | 1,105 | |||
| Labour | Francis Deutsch | 1,022 | |||
| Liberal Democrats | Sean J. Hooker | 977 | |||
| Labour | Margaret C. Onokah | 912 | |||
| Green | Georgia Theodorou | 200 | |||
| Turnout | 3,867 | 31.5 | |||
| Conservative hold | Swing | ||||
| Conservative hold | Swing | ||||
| Conservative hold | Swing | ||||
Mill Hill
| Party | Candidate | Votes | % | ± | |
|---|---|---|---|---|---|
| Liberal Democrats | Wayne J. Casey | 2,469 | |||
| Liberal Democrats | Roger L. Axworthy | 2,348 | |||
| Liberal Democrats | Jeremy E. Davies | 2,339 | |||
| Conservative | Mary P. Gallagher | 1,083 | |||
| Conservative | Richard W. J. Martyn | 1,053 | |||
| Conservative | Leslie J. Pym | 1,040 | |||
| Labour | William J. Parnaby | 652 | |||
| Labour | Pijushkanti Bhattacharyya | 622 | |||
| Labour | Mohan R. Samarasinhe | 535 | |||
| Green | Gillian L. Dunne | 152 | |||
| Turnout | 4,289 | 37.2 | |||
| Liberal Democrats hold | Swing | ||||
| Liberal Democrats hold | Swing | ||||
| Liberal Democrats hold | Swing | ||||
St Paul's
| Party | Candidate | Votes | % | ± | |
|---|---|---|---|---|---|
| Labour | Kitty Lyons | 2,332 | |||
| Labour | Katherine M. McGuirk | 2,214 | |||
| Labour | James B. Tierney | 2,182 | |||
| Conservative | Mary Phillips | 1,427 | |||
| Conservative | Ida Westbrook | 1,359 | |||
| Conservative | Jonathan Z. Shrank | 1,308 | |||
| Liberal Democrats | Joan S. Beales | 421 | |||
| Liberal Democrats | Hugh S. L'Estrange | 362 | |||
| Green | Edelgard Vaswani | 343 | |||
| Liberal Democrats | lngeborg Graber | 336 | |||
| Turnout | 4,423 | 41.2 | |||
| Labour hold | Swing | ||||
| Labour hold | Swing | ||||
| Labour hold | Swing | ||||
Totteridge
| Party | Candidate | Votes | % | ± | |
|---|---|---|---|---|---|
| Conservative | Victor Lyon | 2,472 | |||
| Conservative | Brian J. Coleman | 2,457 | |||
| Conservative | Kevin D. Edson | 2,415 | |||
| Labour | Katherine Rounce | 1,273 | |||
| Labour | Michael A. J. O'Donnell | 1,246 | |||
| Labour | Victoria M. Spawls | 1,171 | |||
| Liberal Democrats | Irene Brewer | 518 | |||
| Liberal Democrats | Anthony D. Wildsmith | 450 | |||
| Liberal Democrats | Gavin A. Jordan | 439 | |||
| Green | Joy H. Boustred | 268 | |||
| Natural Law | Diane Derksen | 41 | |||
| Turnout | 4,483 | 38.6 | |||
| Conservative hold | Swing | ||||
| Conservative hold | Swing | ||||
| Conservative hold | Swing | ||||
West Hendon
| Party | Candidate | Votes | % | ± | |
|---|---|---|---|---|---|
| Labour | Agnes C. Siocombe | 1,408 | |||
| Labour | Arun C. Ghosh | 1,407 | |||
| Labour | Ansuya V. Sodha | 1,215 | |||
| Conservative | James G. Fluss | 979 | |||
| Conservative | Angela Shine | 978 | |||
| Conservative | Rene A. Braun | 954 | |||
| Liberal Democrats | Richard J. Coward | 344 | |||
| Liberal Democrats | Mary Dodd | 302 | |||
| Liberal Democrats | Shirley J. Rodwell | 299 | |||
| Green | Christine Antoniou | 171 | |||
| Turnout | 3,057 | 28.6 | |||
| Labour hold | Swing | ||||
| Labour hold | Swing | ||||
| Labour hold | Swing | ||||
Woodhouse
| Party | Candidate | Votes | % | ± | |
|---|---|---|---|---|---|
| Labour | Stanley J. Cross | 2,521 | |||
| Labour | Beverley A. Pearce | 2,358 | |||
| Labour | Barry J. Rawlings | 2,288 | |||
| Conservative | Mary E. J. M. Russell | 1,236 | |||
| Conservative | Roy Treeby | 1,209 | |||
| Conservative | Peter Yallouros | 1,160 | |||
| Green | Solomon O. Natelson | 435 | |||
| Liberal Democrats | David H. Ive | 413 | |||
| Liberal Democrats | Barrie R. Manson | 407 | |||
| Liberal Democrats | Joy R. Manson | 407 | |||
| Turnout | 4,555 | 37.5 | |||
| Labour hold | Swing | ||||
| Labour hold | Swing | ||||
| Labour hold | Swing | ||||
By-elections between 1998 and 2002
Woodhouse
| Party | Candidate | Votes | % | ± | |
|---|---|---|---|---|---|
| Labour | Paul G. Rogers | 1,481 | 49.4 | -5.3 | |
| Conservative | Roy Treeby | 1,098 | 36.6 | +9.8 | |
| Green | Solomon O. Natelson | 234 | 7.8 | -1.6 | |
| Liberal Democrats | Sean J. Hooker | 184 | 6.1 | -2.8 | |
| Majority | 383 | 12.8 | |||
| Turnout | 2,997 | 24.6 | |||
| Labour hold | Swing | ||||
The by-election was called following the resignation of Cllr. Stanley J. Cross.
Garden Suburb
| Party | Candidate | Votes | % | ± | |
|---|---|---|---|---|---|
| Conservative | Vanessa R. Gearson | 1,162 | 47.1 | -8.7 | |
| Liberal Democrats | Marjorie A. Harris | 811 | 32.9 | +5.3 | |
| Labour | Alan Schneiderman | 427 | 17.3 | +6.1 | |
| Green | Miranda J. Dunn | 67 | 2.7 | -2.7 | |
| Majority | 351 | 14.2 | |||
| Turnout | 2,467 | 24.1 | |||
| Conservative hold | Swing | ||||
The by-election was called following the resignation of Cllr. Peter J. Skolar.
Hadley
| Party | Candidate | Votes | % | ± | |
|---|---|---|---|---|---|
| Conservative | Yvonne W. Prentice | 1,743 | 58.5 | +12.8 | |
| Labour | Anthonakis N. Vourou | 738 | 24.7 | -9.2 | |
| Liberal Democrats | David A. G. Nowell | 357 | 12.0 | -1.3 | |
| Green | Edelgard Vaswani | 144 | 2.7 | -2.7 | |
| Majority | 1,005 | 33.8 | |||
| Turnout | 2,982 | 21.0 | |||
| Conservative hold | Swing | ||||
The by-election was called following the resignation of Cllr. Hazel E. Mammatt.
Mill Hill
| Party | Candidate | Votes | % | ± | |
|---|---|---|---|---|---|
| Liberal Democrats | Sean J. Hooker | 1,496 | 54.6 | -2.1 | |
| Conservative | John R. Hart | 809 | 29.5 | +4.6 | |
| Labour | Zakia Zubairi | 385 | 14.1 | -0.9 | |
| Green | Donald E. Lyven | 49 | 1.7 | -1.7 | |
| Majority | 687 | 25.1 | |||
| Turnout | 2,739 | 24.1 | |||
| Liberal Democrats hold | Swing | ||||
The by-election was called following the resignation of Cllr. Roger L. Axworthy.
Finchley
| Party | Candidate | Votes | % | ± | |
|---|---|---|---|---|---|
| Conservative | Michael W. Freer | 1,409 | 54.0 | +8.8 | |
| Labour | Christopher P. Underwood | 862 | 33.0 | -1.9 | |
| Liberal Democrats | Karen S. Hatchett | 245 | 9.4 | -2.1 | |
| Green | Edelgard Vaswani | 95 | 3.7 | -4.8 | |
| Majority | 547 | 19.0 | |||
| Turnout | 2,611 | 24.4 | |||
| Conservative hold | Swing | ||||
The by-election was called following the death of Cllr. Barbara I. Langstone.
gollark: Well, Rust is actually good, so you're wrong and bad. Deploying apioferrohazards.
gollark: So copy-cat with potatoS?
gollark: JS is inevitable. Atwood is coming for you.
gollark: I'm looking at making PotatOS for x86™ images.
gollark: Oh, so it's JavaScript.
References
- "Local Elections results". The Times. 9 May 1998. p. 46.
- Minors, Michael; Grenham, Dennis. "London Borough Council Elections 7 May 1998 including the Greater London Authority Referendum results" (PDF). Demographic and Statistical Studies. London Research Centre. Retrieved 21 February 2015.
- "London Borough Council Elections 2 May 2002" (PDF). London Datastore. Greater London Authority. Retrieved 25 February 2015.
| Mayor of London | |
|---|---|
| London Assembly | |
| Inner London Education Authority | |
| Greater London Council | |
| London County Council | |
| Borough Councils | |
| Referendums | |
| |
This article is issued from Wikipedia. The text is licensed under Creative Commons - Attribution - Sharealike. Additional terms may apply for the media files.